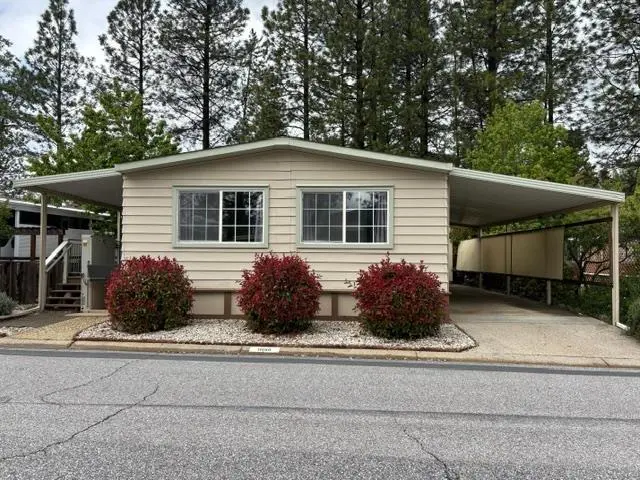
10180 Stone Arch Dr · Alta Sierra, CA
Flood risk 1/10 · Minimal
- FEMA flood zone
- X (unshaded)
- Chance of flooding over 30 yrs
- 0.0%
- Est. flood insurance / yr
- $507 – $1,088
Fire risk 9/10 · Severe
- Est. fire insurance / yr
- $659 – $1,223
Heat risk 5/10 · Moderate
- Hot days now (above 96°F)
- 7 days/yr
- Hot days in 30 yrs
- 16 days/yr
Wind risk 1/10 · Minimal
- Chance of severe wind over 30 yrs
- —
Air-quality risk 10/10 · Severe
- Unhealthy air days now
- 33 days/yr
- Unhealthy air days in 30 yrs
- 40 days/yr
Risk factors via First Street. Map © Google.
Why this score? — see what drove the B+ grade
The composite is a weighted blend of 9 inputs, each scored 0–100. Each bar is that input's sub-score; the figure is the points it added to the 100-point composite (weight × sub-score).
- Cash flow +30.0/30.0
- ARV discount +13.9/15.0
- 1% rule +10.0/10.0
- DSCR +10.0/10.0
- Schools +3.8/10.0
- Livability +3.0/5.0
- Rent growth +2.5/5.0
- Condition / age +2.5/5.0
- Appreciation +0.0/10.0
$89,000
🖨 Deal sheet 📄 Offer letter ✓ Due diligence
Listing remarks
This affordable and updated 2 bed 2 bath mobile home is located within the welcoming community of Forest Springs Mobile Home Park, 10180 Stone Arch Drive offers comfortable, low-maintenance living in the heart of the Sierra foothills. This well-situated mobile home combines convenience, accessibility, and the relaxed lifestyle that makes Grass Valley so desirable. Designed with ease of living in mind, the home features a wheelchair lift, providing enhanced accessibility and convenience. Inside, you will find a functional move in ready layout with inviting living spaces, abundant natural light, and a comfortable flow ideal for everyday living. Outside enjoy sitting on the deck, gardening in
Key facts
- Wheelchair lift
- Community clubhouse
- Private greenhouse
Tags
Property features AI
Finance
- HOA & community: No homeowners association; Located in a senior community; Land lease: no (note: land lease amount listed separately)
Exterior
- Parking: Off-street parking; Attached covered parking; Guest parking available; No traditional garage
- Utilities: Propane service; Individual electric meter; Internet available; 220V in kitchen; 220V in laundry; Public water (water district); Septic system
- Home design: Manufactured home (double wide) located in a park; Updated/remodeled; Built in 1977
- Construction: Composition roof; Skirting: wood and other materials; Suncrest make (manufactured home)
- Exterior features: Backyard; Close to clubhouse; Storage area and shed(s); Covered patio
Interior
- Kitchen: Free-standing refrigerator; Hood over range; Dishwasher; Garbage disposal; Microwave; Free-standing electric oven and range; Pantry closet; Synthetic countertops
- Bedrooms: 2 bedrooms
- Flooring: Laminate flooring
- Bathrooms: 2 full bathrooms; Sunken tub; Shower stall(s)
- Heating & cooling: Central heating (propane); Central cooling; Ceiling fans
- Interior features: Deck attached to the living room; Covered porch and porch with steps and railings; Pantry closet in kitchen; Synthetic countertops; Breakfast nook / dining-family combo; Storage area inside (additional storage/shed); Window upgrades with dual-pane full windows and caulked/sealed frames; Pets allowed (with limits)
- Laundry & utility: Washer and dryer included; Inside laundry room; 220V in laundry area
Neighborhood map
What this means for you Summary
Snapshot
- This is a 2-bed/2.0-bath manufactured listed at $89k.
Deal economics
- At list price, monthly cash flow is $1k ($14k/yr) — positive.
- The deal already cash-flows at list — no discount required.
- Meets the 1% rule at list price ($2k rent vs $89k).
- Recommended offer: $86k (3.0% below list) — sets the bar for market timing.
- Cap rate 21.7% vs local median 3.4% in Alta Sierra — top-decile yield for the area; either an underpriced asset or a hidden risk that comps aren't pricing in. Stress-test before assuming the spread holds.
Location & tenants
- Location reads 59/100 on livability (#662 in CA) — a working-class tenant base; expect higher turnover. Strengths: employment A+, housing A+; Watch: crime C-, schools D+, amenities F.
- Nevada Joint Union High (town): math 25% / reading 61% proficiency, ranked #201 of 517 in CA (top 39%) — families likely to look elsewhere, expect single-tenant / working-renter base with shorter leases.
- Market conditions: 252 active listings in the ZIP; 1 comparable units currently listed for rent nearby; solid renter incomes; 215 units permitted in Nevada County in 2024 (0 in 5+ unit buildings).
Forward outlook
- Local home prices are declining (-3.0%/yr); year-one equity from $615 of loan paydown is wiped out by about $3k of value loss. Plan a longer hold.
- Nevada County population projected at -14% by 2050 — secular population decline; favor cash flow + early exit over multi-decade hold.
- At projected returns (-3.0% appreciation + 3.0% rent growth), your $25k cash investment doubles in ~3 years — after that, you're playing with house money.
Negotiation context
- It's been on market 53 days — a 3% lower offer ($86k) is reasonable based on typical stale-listing flexibility.
Risks & watch-outs
- Climate carrying-cost: severe wildfire risk; extreme-heat days projected 7→16/yr by 2055 (HVAC capex compounding) — expect insurance premiums to compound above CPI over the hold.
Questions for the listing agent
- It's been on market 53 days. Have you received any prior offers? Is the seller open to a 3% concession, seller financing, or rate buy-down credit?
- Built in 1977 — when were the roof, HVAC, electrical panel, plumbing, and water heater last replaced?
- Is there a deadline driving the sale (1031 exchange, divorce, estate, relocation)? That informs how much negotiation room exists.
- Schools are D-rated, which usually means shorter tenancies and higher turnover. Who's the typical renter profile here, and what's been the actual vacancy rate?
- What's the average days-on-market for RENTAL listings here right now (not sales)? A rising rental-DOM trend means longer vacancies and softer asking-rent achievability than the comps imply.
- What's the recent tenant-quality profile in this submarket — average credit score on applications, eviction rate, late-payment / NSF rate, and stable-employment percentage? A property-management company in the area should have these aggregated.
- How much new for-sale + rental construction is in the pipeline within 1–3 miles? Heavy new supply typically softens prices + rents 12–24 months out; constrained supply supports both.
Investment metrics
- 1% rule
- 2.50% ✓
- Cap rate
- 21.70%
- Cash-on-cash
- 55.02%
- DSCR
- 3.45
- GRM
- 3.3
CMA / ARV
- ARV (on-the-fly)
- $103,680
- Comps found
- 12
Show comp detail 12 sales within ~0.75 mi
| Address | Dist | Beds/Ba | Sqft | Sold | Price | $/sf | Match |
|---|---|---|---|---|---|---|---|
| 10150 Stone Arch Dr | 0.05mi | 2/2.0 | 1,344 (+4%) | 1mo | $55,000 | $41 | 91 |
| 14821 Hidden Rock Dr #282 | 0.19mi | 2/2.0 | 1,337 (+3%) | 1mo | $89,500 | $67 | 85 |
| 10042 Grinding Rock Dr | 0.04mi | 2/2.0 | 1,440 (+11%) | 5mo | $90,000 | $63 | 76 |
| 10040 Stone Arch Dr | 0.11mi | 2/2.0 | 1,440 (+11%) | 4mo | $85,000 | $59 | 73 |
| 10131 Shamrock Lode | 0.13mi | 2/2.0 | 1,488 (+15%) | 1mo | $60,000 | $40 | 68 |
| 14338 St Hwy 49 #79 | 0.37mi | 2/2.0 | 1,440 (+11%) | 5mo | $120,000 | $83 | 60 |
| 10088 Dalewood Way | 0.53mi | 2/2.0 | 1,440 (+11%) | 0mo | $138,000 | $96 | 56 |
| 10046 Dalewood Way | 0.50mi | 2/2.0 | 1,440 (+11%) | 2mo | $160,000 | $111 | 56 |
| 10073 Dalewood Way | 0.54mi | 2/2.0 | 1,440 (+11%) | 1mo | $115,000 | $80 | 55 |
| 13927 Meda Dr | 0.66mi | 3/2.0 (+1) | 1,368 (+6%) | 1mo | $140,000 | $102 | 54 |
| 10070 Dalewood Way | 0.52mi | 2/2.0 | 1,152 (-11%) | 4mo | $130,000 | $113 | 54 |
| 14969 N Country Rd | 0.54mi | 3/2.0 (+1) | 1,456 (+12%) | 1mo | $82,500 | $57 | 48 |
Match score weights: distance 35% · size 25% · config 20% · recency 20%. Top-matched comps best support the ARV.
Projected returns pro-forma
-3.0% appreciation · 3.0% rent growth · sell at horizon
- IRR
- 53.3%
- Equity multiple
- 3.34×
- Total profit
- $58,387
- Equity at exit
- $13,270
- IRR
- 58.5%
- Equity multiple
- 6.81×
- Total profit
- $144,689
- Equity at exit
- $7,695
Cash invested: $24,920 (down + closing). Projections, not guarantees.
Landlord ↔ Tenant lean methodology
- Overall (STATE)
- 18 Strongly Tenant-Friendly
- State California
- 18 Strongly Tenant-Friendly · D+13
- County
- — inherits STATE
- City
- — inherits STATE
ZIP-level market 95949
- Home prices YoY
- -34.7%
- Active inventory
- 252
- Price-to-rent
- 3.3×
Monthly cashflow live
- Estimated rent
- $2,225 medium interval (Pro) →
- Mortgage (P&I)
- −$467
- Tax est. 1.5%
- −$111 /mo · $1,335/yr
- Insurance
- −$37
- HOA
- −$0
- Vacancy / Maint / Mgmt
- −$467
- Net cashflow
- $1,143
Break-even live
UW: 25.0% down · 7.5% · 30yr · 1.5% tax · 5.0% vac · 8.0% maint · 8.0% mgmt
Financing live
Cash to close
- Down payment
- $22,250
- Closing costs
- $2,670
- Reserves months
- —
- Total cash needed
- —
Loan-product check · same deal, 3 products live
Conventional
25% down · 7.5% · 30yr
- Down + closing
- —
- Monthly P&I
- —
- Monthly cashflow
- —
- DSCR
- —
- Eligible?
- —
Personal DTI + credit; lowest rate.
DSCR
20% down · 8.5% · 30yr
- Down + closing
- —
- Monthly P&I
- —
- Monthly cashflow
- —
- DSCR
- —
- Eligible?
- —
No personal income docs; deal must DSCR.
Hard money
10% down · 12.0% · 12mo
- Down + closing
- —
- Monthly P&I
- —
- Monthly cashflow
- —
- DSCR
- —
- Eligible?
- —
Short-term bridge; refi at stabilization.
Rent comps 1 comps
| Address | Beds | Baths | Sqft | Rent | $/sqft | DOM | Units | Dist |
|---|---|---|---|---|---|---|---|---|
| 15487 Kingsbury Cir Grass Valley, CA | 2.0 | 2.0 | 1200 | $2,000 | $1.67 | 3d | 1 | 1.27mi |
Listing history 16 events
-
2026-06-19days on market $89,000 Active 53 DOM
-
2026-06-18days on market $89,000 Active 52 DOM
-
2026-06-17days on market $89,000 Active 51 DOM
-
2026-06-16days on market $89,000 Active 50 DOM
-
2026-06-15days on market $89,000 Active 49 DOM
-
2026-06-13days on market $89,000 Active 47 DOM
-
2026-06-13days on market $89,000 Active 46 DOM
-
2026-06-10days on market $89,000 Active 44 DOM
-
2026-06-09days on market $89,000 Active 43 DOM
-
2026-06-08days on market $89,000 Active 42 DOM
-
2026-06-07days on market $89,000 Active 41 DOM
-
2026-06-05days on market $89,000 Active 38 DOM
-
2026-06-03days on market $89,000 Active 37 DOM
-
2026-06-02days on market $89,000 Active 36 DOM
-
2026-06-01days on market $89,000 Active 35 DOM
-
2026-05-31days on market $89,000 Active 34 DOM
ⓘ Source: listings_history table (triggers on properties + properties_extension) + one-shot
backfill from property_details.listing_events for pre-trigger history.
Climate risk First Street
- Flood 1/10 Low FEMA zone X (unshaded) · 0% chance over 30 yrs
- Wildfire 9/10 Extreme
- Heat 5/10 Major 7 d/yr ≥96°F today · 16 d/yr by 30 yrs out
- Wind 1/10 Low
- Air quality 10/10 Extreme 33 unhealthy d/yr today · 40 by 30 yrs out
Nearby sold comps map
Loading sold comps map…
Walkable amenities ~0.75 mi
Loading nearby amenities…
Taxation est. · year 1
- Rental income
- $26,699
- − Mortgage interest
- −$4,985
- − Property taxes
- −$1,335
- − Insurance
- −$445
- − Repairs & maintenance
- −$2,136
- − Management
- −$2,136
- − Depreciation
- −$2,589
- Taxable income
- $13,073
- Est. tax owed @ 24.0%
- −$3,138
- After-tax cash flow
- $10,574/yr
For passive investors: Depreciation is non-cash, so a rental often shows a tax loss while cash-flowing — sheltering income. Rental losses are passive: they offset passive income freely, and up to $25,000/yr can offset ordinary (W-2) income if you actively participate and your MAGI is under $100k (phasing out to $0 by $150k); unused losses carry forward. On sale, claimed depreciation is recaptured at up to 25%, and gains may owe capital-gains tax (a 1031 exchange can defer both). Figures are a year-1 estimate at your 24.0% rate — not tax advice; consult a CPA.
Schools (NCES district)
- District
- Nevada Joint Union High
- NCES district ID
- 0626880
- Math proficiency
- 25% ▼ -14.00%
- Reading proficiency
- 61% ▼ -7.00%
- Median HH income
- $57,336
- Composite
- 37.53/100
- National rank
- #4393
- State rank
- #201 of 517 in CA
Livability — Alta Sierra
- Score
- 59/100
- State rank
- #662
- US rank
- #20497
Category grades
Schools grade is shown separately in the Schools card above.
Census & demographics
- County
- Nevada County · 85,339 people
- Metro
- Truckee-Grass Valley, CA
- Population (ZIP)
- 20,552
- Household income
- $98,181
- Rent vs Own
- Severe rent burden
- 181.0
Population outlook (Nevada County) Hauer SSP2
- Today (2025)
- 98,490 people
- By 2030
- 97,295 · -1.2%
- By 2040
- 92,041 · -6.5%
- By 2050
- 85,164 · -13.5%
- By 2075
- 68,436 · -30.5%
- By 2100
- 49,536 · -49.7%
Race, ethnicity, and origin ACS 2023
- Neighborhood character
- Predominantly White (84%)
- Race & ethnicity
- White 84% Hispanic / Latino 8% Two or more races 8% Native American 1%
- Hispanic origin (detail)
- Mexican 6%
- Common ancestry
- Lithuanian 4% Italian 4% Slovak 2%
- Foreign-born
- 4% · Canada
- Languages at home
- 94% English-only · Spanish 3% Other Indo-European 1%
Political lean MEDSL · Nevada
- 2024 margin
- D (+12.2) · D 54.4% · R 42.1% · Other 3.5%
- 2008→2024 swing
- +6.9pp toward D · 2008: 5.3pp · 2024: 12.2pp
- All cycles
- 2024: D+12.2 2020: D+14.8 2016: D+4.5 2012: R+4.7 2008: D+5.3
Not yet ingested
- Civics
- —
Market trends
- HPI YoY
- ▼ -122.41%
- Current HPI
- 230.2373
- Rent YoY
- —
- Metro
- Truckee-Grass Valley, CA
- State GDP YoY
- ▲ 3.21%
- F500 in state
- 116
Industry mix (Fortune 500 HQ in CA)
| Industry | F500 HQs | Revenue |
|---|---|---|
| Technology | 27 | $1,492B |
|
||
| Financial Services | 3 | $174B |
|
||
| Retail | 3 | $44B |
|
||
| Insurance | 3 | $26B |
|
||
| Media / Entertainment | 2 | $115B |
|
||
| Pharmaceuticals / Biotech | 2 | $62B |
|
||
Property tax history
-3.7%/yrLatest (2025): $76 · +2.2% YoY. Source: county tax records.
Cash-flow waterfall
monthlySold comps — $/sqft
last 12 mo · ≤1 miLoading sold comps…