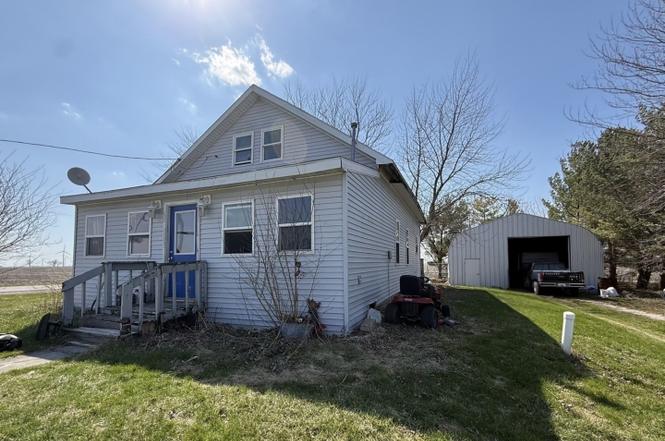
6985 S Verona Rd · Verona, IL
Flood risk 1/10 · Minimal
- FEMA flood zone
- X (unshaded)
- Chance of flooding over 30 yrs
- 0.0%
- Est. flood insurance / yr
- $473 – $860
Fire risk 1/10 · Minimal
- Est. fire insurance / yr
- $804 – $1,492
Heat risk 3/10 · Minor
- Hot days now (above 103°F)
- 7 days/yr
- Hot days in 30 yrs
- 17 days/yr
Wind risk 2/10 · Minimal
- Chance of severe wind over 30 yrs
- 2.0%
Air-quality risk 2/10 · Minimal
- Unhealthy air days now
- 1 days/yr
- Unhealthy air days in 30 yrs
- 1 days/yr
Risk factors via First Street. Map © Google.
Why this score? — see what drove the C+ grade
The composite is a weighted blend of 9 inputs, each scored 0–100. Each bar is that input's sub-score; the figure is the points it added to the 100-point composite (weight × sub-score).
- Cash flow +24.9/30.0
- DSCR +8.1/10.0
- 1% rule +7.7/10.0
- ARV discount +7.5/15.0
- Appreciation +4.3/10.0
- Schools +3.2/10.0
- Livability +2.9/5.0
- Rent growth +2.5/5.0
- Condition / age +2.5/5.0
$99,900
🖨 Deal sheet 📄 Offer letter ✓ Due diligence
Listing remarks MLS
THIS HOME WAS A SCHOOL HOUSE W/ FLAG STONE FOUNDATION. THERE IS A 22 X 26 SHED/WORKSHOP.
Key facts
- Office space
- Eat in kitchen
- Attic storage
Tags
Property features AI
Finance
- Other: Lot approximately 0.25–0.49 acre (dimensions 147 x 148); Parcel number 1002400003; Property not currently leased; Possession at closing
- HOA & community: No master association fees required
Exterior
- Parking: Detached garage (garage owned); Total 4 parking spaces; Dirt and gravel driveway; No attached garage
- Utilities: Well water; Septic tank sewer
- Home design: Detached single-family home; 1.5-story residence; Fee simple ownership; Property estimated age over 100 years; Asphalt roof; Aluminum siding
- Construction: Built before 1978
- Exterior features: Deck
Interior
- Kitchen: Kitchen with eating area (13 x 15)
- Bedrooms: Master bedroom on main level (10 x 16); Second-floor bedroom (10 x 23); Second-floor bedroom (10 x 20)
- Bathrooms: One full bathroom
- Heating & cooling: Space heater for heating; Window air conditioning units
- Interior features: Five total rooms; Foyer; Living room (23 x 19); Family room; Dining area open to kitchen
- Laundry & utility: Main-level laundry room (8 x 8)
Neighborhood map
What this means for you Summary
Snapshot
- This is a 3-bed/1.0-bath single-family listed at $100k.
Deal economics
- At list price, monthly cash flow is $215 ($3k/yr) — positive.
- The deal already cash-flows at list — no discount required.
- Meets the 1% rule at list price ($1k rent vs $100k).
Location & tenants
- Location reads 58/100 on livability (#1,115 in IL) — a working-class tenant base; expect higher turnover. Strengths: cost of living A+, housing A-; Watch: health & safety C-, crime D, amenities F.
- Seneca Twp Hsd 160 (rural): math 30% / reading 35% proficiency, ranked #416 of 919 in IL (top 45%) — families likely to look elsewhere, expect single-tenant / working-renter base with shorter leases.
- Zoned schools: Seneca High School (math 32% / reading 32%, grade F, #157 of 693 statewide, top 25%, 385 students, 0% FRL).
- Market conditions: 1 active listings in the ZIP; 84 units permitted in Grundy County in 2024 (0 in 5+ unit buildings).
Forward outlook
- Local home prices are declining (-1.3%/yr); year-one equity from $691 of loan paydown is wiped out by about $1k of value loss. Plan a longer hold.
- Grundy County population projected to shrink 9% by 2050 — rents likely to lag national; underwrite the cash flow, not the appreciation.
- At projected returns (-1.3% appreciation + 3.0% rent growth), your $28k cash investment doubles in ~9 years — after that, you're playing with house money.
Negotiation context
- Only 2 days on market — expect competitive offers; lowballing is unlikely to land.
- 2 sale attempts since 20y ago with the ask held roughly flat each time — persistent listings suggest the price (not the market) is what's stuck; bring a comps-based counter.
- Current owner paid $78k; 27% above their basis — modest negotiation headroom, anchor on the comps not their cost.
Risks & watch-outs
- Watch-outs: property tax is 2.6% of price; built in 1900 — expect roof / HVAC / electrical / plumbing capex.
Questions for the listing agent
- Built in 1900 — when were the roof, HVAC, electrical panel, plumbing, and water heater last replaced?
- Property tax is high relative to price — has the assessment been appealed recently, and will the sale trigger a re-assessment?
- Is there a deadline driving the sale (1031 exchange, divorce, estate, relocation)? That informs how much negotiation room exists.
- Schools are F-rated, which usually means shorter tenancies and higher turnover. Who's the typical renter profile here, and what's been the actual vacancy rate?
- Crime grade is D in this area — have there been break-ins, vandalism, or insurance claims at this property in the last 3 years? What carrier currently insures it and at what premium?
- What's the average days-on-market for RENTAL listings here right now (not sales)? A rising rental-DOM trend means longer vacancies and softer asking-rent achievability than the comps imply.
- What's the recent tenant-quality profile in this submarket — average credit score on applications, eviction rate, late-payment / NSF rate, and stable-employment percentage? A property-management company in the area should have these aggregated.
- How much new for-sale + rental construction is in the pipeline within 1–3 miles? Heavy new supply typically softens prices + rents 12–24 months out; constrained supply supports both.
Investment metrics
- 1% rule
- 1.27% ✓
- Cap rate
- 8.87%
- Cash-on-cash
- 9.22%
- DSCR
- 1.41
- GRM
- 6.6
CMA / ARV
No comps found within radius.
Projected returns pro-forma
-1.34% appreciation · 3.0% rent growth · sell at horizon
- IRR
- 3.9%
- Equity multiple
- 1.17×
- Total profit
- $4,699
- Equity at exit
- $22,475
- IRR
- 10.8%
- Equity multiple
- 2.02×
- Total profit
- $28,598
- Equity at exit
- $22,230
Cash invested: $27,972 (down + closing). Projections, not guarantees.
Landlord ↔ Tenant lean methodology
- Overall (STATE)
- 43 Moderately Tenant-Leaning
- State Illinois
- 43 Moderately Tenant-Leaning · D+7
- County
- — inherits STATE
- City
- — inherits STATE
ZIP-level market 60479
- Home prices YoY
- -0.9%
- Active inventory
- 1
- Price-to-rent
- 6.6×
Monthly cashflow live
- Estimated rent
- $1,264 medium interval (Pro) →
- Mortgage (P&I)
- −$524
- Tax from tax record
- −$218 /mo · $2,620/yr
- Insurance
- −$42
- HOA
- −$0
- Vacancy / Maint / Mgmt
- −$265
- Net cashflow
- $215
Break-even live
UW: 25.0% down · 7.5% · 30yr · 1.5% tax · 5.0% vac · 8.0% maint · 8.0% mgmt
Financing live
Cash to close
- Down payment
- $24,975
- Closing costs
- $2,997
- Reserves months
- —
- Total cash needed
- —
Loan-product check · same deal, 3 products live
Conventional
25% down · 7.5% · 30yr
- Down + closing
- —
- Monthly P&I
- —
- Monthly cashflow
- —
- DSCR
- —
- Eligible?
- —
Personal DTI + credit; lowest rate.
DSCR
20% down · 8.5% · 30yr
- Down + closing
- —
- Monthly P&I
- —
- Monthly cashflow
- —
- DSCR
- —
- Eligible?
- —
No personal income docs; deal must DSCR.
Hard money
10% down · 12.0% · 12mo
- Down + closing
- —
- Monthly P&I
- —
- Monthly cashflow
- —
- DSCR
- —
- Eligible?
- —
Short-term bridge; refi at stabilization.
Listing history 3 events
-
2026-06-18days on market $99,900 Active 2 DOM
-
2026-06-17remarks 699-char remark
-
2026-06-17$99,900 Active 1 DOM
ⓘ Source: listings_history table (triggers on properties + properties_extension) + one-shot
backfill from property_details.listing_events for pre-trigger history.
Tax reassessment forecast IL · Partial reset (capped growth)
- Current annual tax
- $2,620 · $218/mo
- Projected year-2 tax
- $2,620 · $218/mo
- Expected delta
- $0/yr ($0/mo · 0.0%)
ⓘ Screening estimate from a state-policy table — verify with the county assessor before closing.
Climate risk First Street
- Flood 1/10 Low FEMA zone X (unshaded) · 0% chance over 30 yrs
- Wildfire 1/10 Low
- Heat 3/10 Moderate 7 d/yr ≥103°F today · 17 d/yr by 30 yrs out
- Wind 2/10 Low 2% chance of damaging wind over 30 yrs
- Air quality 2/10 Low 1 unhealthy d/yr today · 1 by 30 yrs out
Nearby sold comps map
Loading sold comps map…
Walkable amenities ~0.75 mi
Loading nearby amenities…
Taxation est. · year 1
- Rental income
- $15,170
- − Mortgage interest
- −$5,596
- − Property taxes
- −$2,620
- − Insurance
- −$500
- − Repairs & maintenance
- −$1,214
- − Management
- −$1,214
- − Depreciation
- −$2,906
- Taxable income
- $1,122
- Est. tax owed @ 24.0%
- −$269
- After-tax cash flow
- $2,309/yr
For passive investors: Depreciation is non-cash, so a rental often shows a tax loss while cash-flowing — sheltering income. Rental losses are passive: they offset passive income freely, and up to $25,000/yr can offset ordinary (W-2) income if you actively participate and your MAGI is under $100k (phasing out to $0 by $150k); unused losses carry forward. On sale, claimed depreciation is recaptured at up to 25%, and gains may owe capital-gains tax (a 1031 exchange can defer both). Figures are a year-1 estimate at your 24.0% rate — not tax advice; consult a CPA.
Schools (NCES district)
- District
- Seneca Twp Hsd 160
- NCES district ID
- 1735850
- Math proficiency
- 30% ▲ 10.00%
- Reading proficiency
- 35% ▬ 0.00%
- Median HH income
- $63,241
- Composite
- 32.26/100
- National rank
- #10928
- State rank
- #416 of 919 in IL
Livability — Verona
- Score
- 58/100
- State rank
- #1115
- US rank
- #21076
Category grades
Schools grade is shown separately in the Schools card above.
Census & demographics
- Population (ZIP)
- 629
Population outlook (Grundy County) Hauer SSP2
- Today (2025)
- 50,716 people
- By 2030
- 50,218 · -1.0%
- By 2040
- 48,599 · -4.2%
- By 2050
- 46,212 · -8.9%
- By 2075
- 40,033 · -21.1%
- By 2100
- 32,966 · -35.0%
Race, ethnicity, and origin ACS 2023
- Neighborhood character
- Predominantly White (86%)
- Race & ethnicity
- White 86% Hispanic / Latino 8% Two or more races 6%
- Hispanic origin (detail)
- Mexican 8%
- Common ancestry
- Portuguese 8% Lithuanian 4% Romanian 2%
- Foreign-born
- 2% · Canada
- Languages at home
- 94% English-only · Spanish 5%
Political lean MEDSL · Grundy
- 2024 margin
- Strong R (+29.6) · D 34.5% · R 64.0% · Other 1.5%
- 2008→2024 swing
- -31.3pp toward R · 2008: 1.7pp · 2024: -29.6pp
- All cycles
- 2024: R+29.6 2020: R+25.8 2016: R+23.6 2012: R+9.0 2008: D+1.7
Not yet ingested
- Civics
- —
Market trends
- HPI YoY
- ▼ -1.34%
- Current HPI
- 141.2817
- Rent YoY
- —
- Metro
- —
- State GDP YoY
- ▲ 1.59%
- F500 in state
- 60
Industry mix (Fortune 500 HQ in IL)
| Industry | F500 HQs | Revenue |
|---|---|---|
| Insurance | 4 | $201B |
|
||
| Consumer Goods | 4 | $87B |
|
||
| Industrial Machinery | 3 | $64B |
|
||
| Healthcare | 2 | $55B |
|
||
| Retail / Pharmacy | 1 | $148B |
|
||
| Agriculture / Food | 1 | $86B |
|
||
Price history
+17.5% since first listed6 events — show timeline
- 2026-06-16 Listed $99,900 MRED as Distributed by MLS Grid
- 2026-06-16 Coming Soon $99,900 MRED as Distributed by MLS Grid
- 2007-03-08 Sold (MLS) $78,500 MRED as Distributed by MLS Grid
- 2007-03-08 Sold (Public Records) $78,500 Public Records
- 2007-02-08 Listing Removed — MRED as Distributed by MLS Grid
- 2006-08-12 Listed $85,000 MRED as Distributed by MLS Grid
Property tax history
+6.6%/yrLatest (2024): $2,620 · +10.0% YoY. Source: county tax records.
Cash-flow waterfall
monthlySold comps — $/sqft
last 12 mo · ≤1 miLoading sold comps…