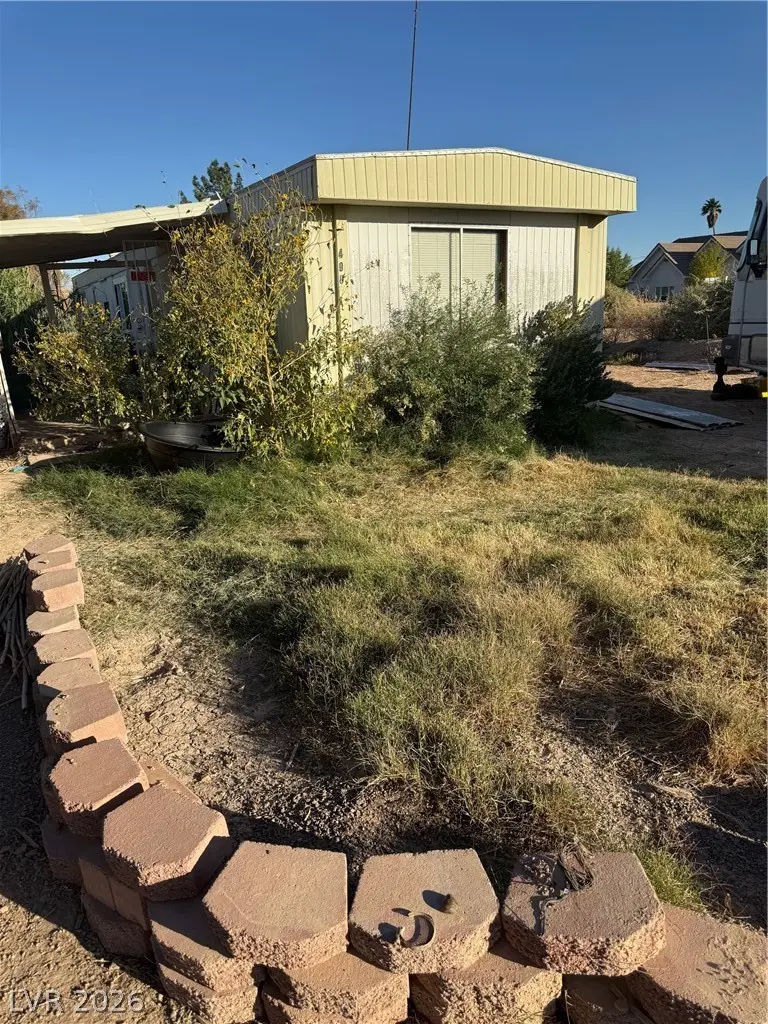
490 Kay Geng St · Moapa Valley, NV
Flood risk 1/10 · Minimal
- FEMA flood zone
- X (shaded)
- Chance of flooding over 30 yrs
- 0.0%
- Est. flood insurance / yr
- $507 – $1,088
Fire risk 5/10 · Moderate
- Est. fire insurance / yr
- $490 – $910
Heat risk 8/10 · Major
- Hot days now (above 110°F)
- 7 days/yr
- Hot days in 30 yrs
- 15 days/yr
Wind risk 1/10 · Minimal
- Chance of severe wind over 30 yrs
- —
Air-quality risk 1/10 · Minimal
- Unhealthy air days now
- 0 days/yr
- Unhealthy air days in 30 yrs
- 0 days/yr
Risk factors via First Street. Map © Google.
Why this score? — see what drove the B- grade
The composite is a weighted blend of 9 inputs, each scored 0–100. Each bar is that input's sub-score; the figure is the points it added to the 100-point composite (weight × sub-score).
- Cash flow +24.8/30.0
- Appreciation +8.2/10.0
- DSCR +8.1/10.0
- ARV discount +7.5/15.0
- 1% rule +6.4/10.0
- Livability +3.0/5.0
- Schools +2.6/10.0
- Rent growth +2.5/5.0
- Condition / age +2.5/5.0
$99,999
🖨 Deal sheet 📄 Offer letter ✓ Due diligence
Listing remarks MLS
Fixer upper, Value is in the location and land. Mobile home as is where is in current condition, large shed on property, some fencing. addition 16x16 on mobile home and in need of repair. no showings as tenants are in the process of being evicted.
Key facts
- Addition 16x16
- Large shed
- Some fencing
Tags
Neighborhood map
What this means for you Summary
Snapshot
- This is a 1-bed/1.0-bath manufactured listed at $100k.
Deal economics
- At list price, monthly cash flow is $213 ($3k/yr) — positive.
- The deal already cash-flows at list — no discount required.
- Meets the 1% rule at list price ($1k rent vs $100k).
- Recommended offer: $94k (6.0% below list) — sets the bar for market timing.
Location & tenants
- Location reads 60/100 on livability (#77 in NV) — a middle-class / working-renter tenant base. Strengths: housing A+, cost of living A, employment B+; Watch: amenities F, commute F, health & safety F.
- Clark County School District (urban): math 21% / reading 39% proficiency, ranked #11 of 17 in NV (top 65%) — families likely to look elsewhere, expect single-tenant / working-renter base with shorter leases.
- Market conditions: 73 active listings in the ZIP; 14,754 units permitted in Clark County in 2024 (2,301 in 5+ unit buildings).
Forward outlook
- In year one you build about $7k of equity ($691 loan paydown + $6k appreciation (6.3% local appreciation)).
- Clark County population projected at +36% by 2050 — long-run rental-demand tailwind backs the buy-and-hold thesis.
- At projected returns (6.3% appreciation + 3.0% rent growth), your $28k cash investment doubles in ~3 years — after that, you're playing with house money.
- By year 5, paydown + projected appreciation supports a ~$31k cash-out refi (75% LTV) — recoverable capital for the next deal without selling this one.
Negotiation context
- It's been on market 83 days — a 6% lower offer ($94k) is reasonable based on typical stale-listing flexibility.
- 6 sale attempts since 18y ago; this cycle's ask has dropped $15k (13%) from the opening price — seller is motivated, your offer sets the floor, not the list.
- Current owner paid $25k; list at $100k implies a 300% gain — meaningful room to come down on a strong offer.
Risks & watch-outs
- Climate carrying-cost: moderate wildfire risk; extreme-heat days projected 7→15/yr by 2055 (HVAC capex compounding) — expect insurance premiums to compound above CPI over the hold.
Questions for the listing agent
- It's been on market 83 days. Have you received any prior offers? Is the seller open to a 6% concession, seller financing, or rate buy-down credit?
- Why hasn't it sold? Are there any deal-killer items the seller is aware of (foundation, flood, title, zoning, code violations)?
- Is there a deadline driving the sale (1031 exchange, divorce, estate, relocation)? That informs how much negotiation room exists.
- What's the average days-on-market for RENTAL listings here right now (not sales)? A rising rental-DOM trend means longer vacancies and softer asking-rent achievability than the comps imply.
- What's the recent tenant-quality profile in this submarket — average credit score on applications, eviction rate, late-payment / NSF rate, and stable-employment percentage? A property-management company in the area should have these aggregated.
- How much new for-sale + rental construction is in the pipeline within 1–3 miles? Heavy new supply typically softens prices + rents 12–24 months out; constrained supply supports both.
Investment metrics
- 1% rule
- 1.14% ✓
- Cap rate
- 8.85%
- Cash-on-cash
- 9.12%
- DSCR
- 1.41
- GRM
- 7.3
CMA / ARV
No comps found within radius.
Projected returns pro-forma
6.31% appreciation · 3.0% rent growth · sell at horizon
- IRR
- 23.6%
- Equity multiple
- 2.58×
- Total profit
- $44,269
- Equity at exit
- $64,802
- IRR
- 22.1%
- Equity multiple
- 5.26×
- Total profit
- $119,184
- Equity at exit
- $119,225
Cash invested: $28,000 (down + closing). Projections, not guarantees.
Landlord ↔ Tenant lean methodology
- Overall (STATE)
- 71 Landlord-Friendly
- State Nevada
- 71 Landlord-Friendly · R+1
- County
- — inherits STATE
- City
- — inherits STATE
ZIP-level market 89040
- Home prices YoY
- 2.7%
- Active inventory
- 73
- Price-to-rent
- 7.3×
Monthly cashflow live
- Estimated rent
- $1,144 medium interval (Pro) →
- Mortgage (P&I)
- −$524
- Tax est. 1.5%
- −$125 /mo · $1,500/yr
- Insurance
- −$42
- HOA
- −$0
- Vacancy / Maint / Mgmt
- −$240
- Net cashflow
- $213
Break-even live
UW: 25.0% down · 7.5% · 30yr · 1.5% tax · 5.0% vac · 8.0% maint · 8.0% mgmt
Financing live
Cash to close
- Down payment
- $25,000
- Closing costs
- $3,000
- Reserves months
- —
- Total cash needed
- —
Loan-product check · same deal, 3 products live
Conventional
25% down · 7.5% · 30yr
- Down + closing
- —
- Monthly P&I
- —
- Monthly cashflow
- —
- DSCR
- —
- Eligible?
- —
Personal DTI + credit; lowest rate.
DSCR
20% down · 8.5% · 30yr
- Down + closing
- —
- Monthly P&I
- —
- Monthly cashflow
- —
- DSCR
- —
- Eligible?
- —
No personal income docs; deal must DSCR.
Hard money
10% down · 12.0% · 12mo
- Down + closing
- —
- Monthly P&I
- —
- Monthly cashflow
- —
- DSCR
- —
- Eligible?
- —
Short-term bridge; refi at stabilization.
Listing history 30 events
-
2026-06-18days on market $99,999 Active 83 DOM
-
2026-06-17days on market $99,999 Active 82 DOM
-
2026-06-16days on market $99,999 Active 81 DOM
-
2026-06-15days on market $99,999 Active 80 DOM
-
2026-06-13days on market $99,999 Active 78 DOM
-
2026-06-09days on market $99,999 Active 74 DOM
-
2026-06-08days on market $99,999 Active 73 DOM
-
2026-06-07days on market $99,999 Active 72 DOM
-
2026-06-03days on market $99,999 Active 68 DOM
-
2026-06-02days on market $99,999 Active 67 DOM
-
2026-06-01days on market $99,999 Active 66 DOM
-
2026-05-31days on market $99,999 Active 65 DOM
-
2026-04-09price $99,999 247-char remark
Show marketing remark (247 chars)
Fixer upper, Value is in the location and land. Mobile home as is where is in current condition, large shed on property, some fencing. addition 16x16 on mobile home and in need of repair. no showings as tenants are in the process of being evicted.
-
2026-03-26$115,000 Active 247-char remark
Show marketing remark (247 chars)
Fixer upper, Value is in the location and land. Mobile home as is where is in current condition, large shed on property, some fencing. addition 16x16 on mobile home and in need of repair. no showings as tenants are in the process of being evicted.
-
2024-03-01historical
-
2023-06-17$90,000 Active
-
2022-09-01historical
-
2022-07-02price $79,990
-
2022-02-16$79,900 Active
-
2021-12-31historical
-
2021-07-19price $75,000
-
2021-06-07$74,999 Active
-
2019-01-29soldstatus $25,000 Sold
-
2019-01-02status Pending
-
2018-08-21$35,000 Active
-
2009-01-09historical
-
2009-01-09soldstatus $75,000
-
2009-01-09soldstatus $75,000
-
2008-02-11$77,500
-
1990-03-22soldstatus $12,500
ⓘ Source: listings_history table (triggers on properties + properties_extension) + one-shot
backfill from property_details.listing_events for pre-trigger history.
Climate risk First Street
- Flood 1/10 Low FEMA zone X (shaded) · 0% chance over 30 yrs
- Wildfire 5/10 Major
- Heat 8/10 Severe 7 d/yr ≥110°F today · 15 d/yr by 30 yrs out
- Wind 1/10 Low
- Air quality 1/10 Low 0 unhealthy d/yr today · 0 by 30 yrs out
Nearby sold comps map
Loading sold comps map…
Walkable amenities ~0.75 mi
Loading nearby amenities…
Taxation est. · year 1
- Rental income
- $13,731
- − Mortgage interest
- −$5,601
- − Property taxes
- −$1,500
- − Insurance
- −$500
- − Repairs & maintenance
- −$1,098
- − Management
- −$1,098
- − Depreciation
- −$2,909
- Taxable income
- $1,023
- Est. tax owed @ 24.0%
- −$246
- After-tax cash flow
- $2,309/yr
For passive investors: Depreciation is non-cash, so a rental often shows a tax loss while cash-flowing — sheltering income. Rental losses are passive: they offset passive income freely, and up to $25,000/yr can offset ordinary (W-2) income if you actively participate and your MAGI is under $100k (phasing out to $0 by $150k); unused losses carry forward. On sale, claimed depreciation is recaptured at up to 25%, and gains may owe capital-gains tax (a 1031 exchange can defer both). Figures are a year-1 estimate at your 24.0% rate — not tax advice; consult a CPA.
Schools (NCES district)
- District
- Clark County School District
- NCES district ID
- 3200060
- Math proficiency
- 21% ▼ -13.00%
- Reading proficiency
- 39% ▼ -8.00%
- Median HH income
- $53,611
- Composite
- 26.48/100
- National rank
- #7211
- State rank
- #11 of 17 in NV
Livability — Moapa Valley
- Score
- 60/100
- State rank
- #77
- US rank
- #18937
Category grades
Schools grade is shown separately in the Schools card above.
Census & demographics
- Census place
- Moapa Valley, NV
- City population
- 3,079
- Population (ZIP)
- 3,842
Population outlook (Clark County) Hauer SSP2
- Today (2025)
- 2,504,101 people
- By 2030
- 2,693,770 · +7.6%
- By 2040
- 3,061,208 · +22.2%
- By 2050
- 3,400,072 · +35.8%
- By 2075
- 4,139,522 · +65.3%
- By 2100
- 4,596,916 · +83.6%
Race, ethnicity, and origin ACS 2023
- Neighborhood character
- Predominantly White (81%)
- Race & ethnicity
- White 81% Hispanic / Latino 15% Two or more races 6% Native American 2%
- Hispanic origin (detail)
- Mexican 11%
- Common ancestry
- Slovak 6% Iranian 2% Italian 2%
- Foreign-born
- 5% · Canada
- Languages at home
- 92% English-only · Spanish 7% Tagalog/Filipino 1%
Political lean MEDSL · Clark
- 2024 margin
- Toss-up / Even · D 50.4% · R 47.8% · Other 1.7%
- 2008→2024 swing
- -16.5pp toward R · 2008: 19.1pp · 2024: 2.6pp
- All cycles
- 2024: D+2.6 2020: D+9.3 2016: D+10.7 2012: D+14.5 2008: D+19.1
Not yet ingested
- Civics
- —
Market trends
- HPI YoY
- ▲ 6.31%
- Current HPI
- 242.3182
- Rent YoY
- —
- Metro
- —
- State GDP YoY
- ▲ 3.08%
- F500 in state
- 6
Industry mix (Fortune 500 HQ in NV)
| Industry | F500 HQs | Revenue |
|---|---|---|
| Hotels / Casinos | 3 | $36B |
|
||
Price history
+700.0% since first listed18 events — show timeline
- 2026-04-09 Price Changed $99,999 GLVAR
- 2026-03-26 Listed $115,000 GLVAR
- 2024-03-01 Listing Removed — GLVAR
- 2023-06-17 Listed $90,000 GLVAR
- 2022-09-01 Listing Removed — GLVAR
- 2022-07-02 Price Changed $79,990 GLVAR
- 2022-02-16 Listed $79,900 GLVAR
- 2021-12-31 Listing Removed — GLVAR
- 2021-07-19 Price Changed $75,000 GLVAR
- 2021-06-07 Listed $74,999 GLVAR
- 2019-01-29 Sold (MLS) $25,000 GLVAR
- 2019-01-02 Pending — GLVAR
- 2018-08-21 Listed $35,000 GLVAR
- 2009-01-09 Sold (Public Records) $75,000 Public Records
- 2009-01-09 Sold (MLS) $75,000 GLVAR
- 2009-01-09 Listing Removed — GLVAR
- 2008-02-11 Listed $77,500 GLVAR
- 1990-03-22 Sold (Public Records) $12,500 Public Records
Property tax history
-5.8%/yrLatest (2025): $145 · -8.4% YoY. Source: county tax records.
Cash-flow waterfall
monthlySold comps — $/sqft
last 12 mo · ≤1 miLoading sold comps…