 🏗️ New Construction
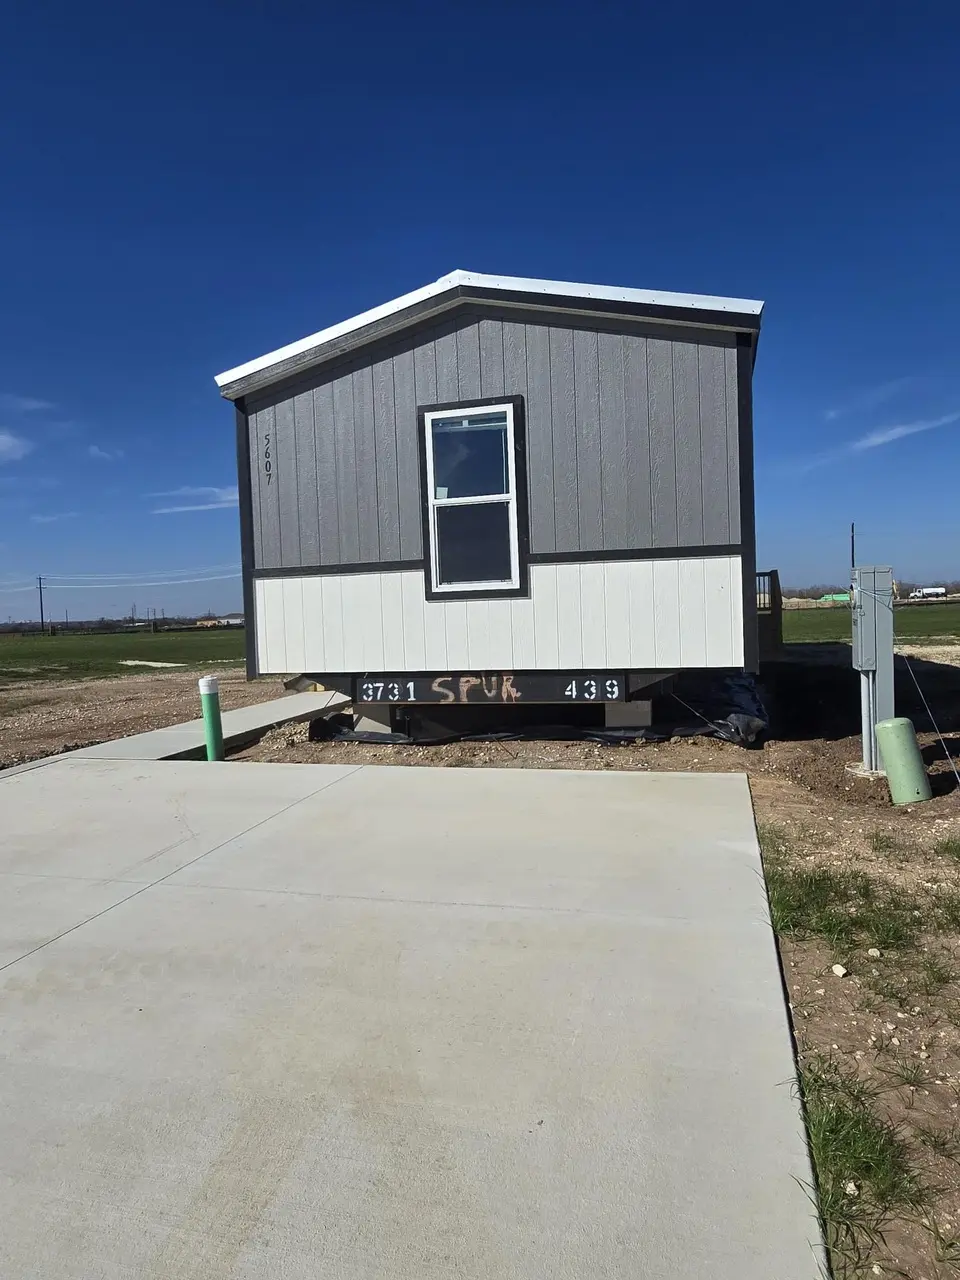
The Spur Plan · Pearland, TX
Flood risk No data
- FEMA flood zone
- —
- Chance of flooding over 30 yrs
- —
- Est. flood insurance / yr
- —
Fire risk No data
- Est. fire insurance / yr
- —
Heat risk No data
- Hot days now (above threshold)
- —
- Hot days in 30 yrs
- —
Wind risk No data
- Chance of severe wind over 30 yrs
- —
Air-quality risk No data
- Unhealthy air days now
- —
- Unhealthy air days in 30 yrs
- —
Risk factors via First Street. Map © Google.
Why this score? — see what drove the B grade
The composite is a weighted blend of 9 inputs, each scored 0–100. Each bar is that input's sub-score; the figure is the points it added to the 100-point composite (weight × sub-score).
- Cash flow +30.0/30.0
- 1% rule +10.0/10.0
- DSCR +10.0/10.0
- ARV discount +7.5/15.0
- Condition / age +4.8/5.0
- Livability +4.0/5.0
- Rent growth +3.2/5.0
- Schools +1.9/10.0
- Appreciation +0.0/10.0
$120,900
🖨 Deal sheet 📄 Offer letter ✓ Due diligence
Listing remarks MLS
Indulge in ultimate relaxation in this luxurious bathroom suite. Featuring a spacious walk-in tile shower, this haven allows you to unwind under a massaging rain showerhead or soak away stress in the deep soaker tub. While the abundant natural light creates a refreshing and inviting atmosphere. Step into the culinary heart of the home - a modern kitchen bathed in natural light. Stainless steel appliances gleam against sleek countertops, while ample cabinet space ensures everything has its designated place. Prepare that perfect meals or enjoy casual family dinners in this bright and functional space. Land Leased not owned
Key facts
- Walk-in tile shower
- Deep soaker tub
- Ample cabinet space
Tags
Neighborhood map
What this means for you Summary
Snapshot
- This is a 3-bed/2.0-bath manufactured listed at $121k. Condition is rated excellent.
Deal economics
- At list price, monthly cash flow is $647 ($8k/yr) — positive.
- The deal already cash-flows at list — no discount required.
- Meets the 1% rule at list price ($2k rent vs $121k).
- Recommended offer: $106k (12.0% below list) — sets the bar for market timing.
- Cap rate 12.7% vs local median 3.0% in Pearland — top-decile yield for the area; either an underpriced asset or a hidden risk that comps aren't pricing in. Stress-test before assuming the spread holds.
Location & tenants
- Location reads 81/100 on livability (#32 in TX, #1,539 nationally) — a professional / high-income tenant draw. Strengths: schools A+, employment A+, housing A+; Watch: amenities D-, commute F.
- East Central ISD (rural): math 16% / reading 25% proficiency, ranked #758 of 826 in TX (top 92%) — low school quality limits family demand, transient renter base, plan for 1-2y turnover; 61% free/reduced lunch — lower-income household profile, screen leases tightly.
- Market conditions: Rents rising (+2.9%/yr); 316 active listings in the ZIP; 6 comparable units currently listed for rent nearby; rentals lingering (median 44d on market — plan ~5-8 weeks vacancy on turnover, expect pricing pressure); 67% of comp listings sitting > 30 days — soft ceiling on asking rent; high-income renter base; 8,308 units permitted in Bexar County in 2024 (2,506 in 5+ unit buildings).
Forward outlook
- Local home prices are declining (-3.0%/yr); year-one equity from $836 of loan paydown is wiped out by about $4k of value loss. Plan a longer hold.
- Bexar County population projected at +50% by 2050 — long-run rental-demand tailwind backs the buy-and-hold thesis.
- At projected returns (-3.0% appreciation + 2.9% rent growth), your $34k cash investment doubles in ~6 years — after that, you're playing with house money.
Negotiation context
- It's been on market 390 days — a 12% lower offer ($106k) is reasonable based on typical stale-listing flexibility.
Questions for the listing agent
- It's been on market 390 days. Have you received any prior offers? Is the seller open to a 12% concession, seller financing, or rate buy-down credit?
- Why hasn't it sold? Are there any deal-killer items the seller is aware of (foundation, flood, title, zoning, code violations)?
- Is there a deadline driving the sale (1031 exchange, divorce, estate, relocation)? That informs how much negotiation room exists.
- Schools are A-rated — typically a magnet for longer-tenancy family renters. What's the average tenant stay here, and is there a school-zone premium baked into asking?
- What's the average days-on-market for RENTAL listings here right now (not sales)? A rising rental-DOM trend means longer vacancies and softer asking-rent achievability than the comps imply.
- What's the recent tenant-quality profile in this submarket — average credit score on applications, eviction rate, late-payment / NSF rate, and stable-employment percentage? A property-management company in the area should have these aggregated.
- How much new for-sale + rental construction is in the pipeline within 1–3 miles? Heavy new supply typically softens prices + rents 12–24 months out; constrained supply supports both.
Investment metrics
- 1% rule
- 1.55% ✓
- Cap rate
- 12.71%
- Cash-on-cash
- 22.92%
- DSCR
- 2.02
- GRM
- 5.4
CMA / ARV
No comps found within radius.
Projected returns pro-forma
-3.0% appreciation · 2.94% rent growth · sell at horizon
- IRR
- 15.8%
- Equity multiple
- 1.64×
- Total profit
- $21,503
- Equity at exit
- $18,027
- IRR
- 24.4%
- Equity multiple
- 3.11×
- Total profit
- $71,401
- Equity at exit
- $10,453
Cash invested: $33,852 (down + closing). Projections, not guarantees.
Landlord ↔ Tenant lean methodology
- Overall (STATE)
- 87 Strongly Landlord-Friendly
- State Texas
- 87 Strongly Landlord-Friendly · R+5
- County
- — inherits STATE
- City
- — inherits STATE
ZIP-level market 77581
- Home prices YoY
- -29.1%
- Rents YoY
- 2.9%
- Active inventory
- 316
- Price-to-rent
- 5.4×
Monthly cashflow live
- Estimated rent
- $1,876 high interval (Pro) →
- Mortgage (P&I)
- −$634
- Tax est. 1.5%
- −$151 /mo · $1,814/yr
- Insurance
- −$50
- HOA
- −$0
- Vacancy / Maint / Mgmt
- −$394
- Net cashflow
- $647
Break-even live
UW: 25.0% down · 7.5% · 30yr · 1.5% tax · 5.0% vac · 8.0% maint · 8.0% mgmt
Financing live
Cash to close
- Down payment
- $30,225
- Closing costs
- $3,627
- Reserves months
- —
- Total cash needed
- —
Loan-product check · same deal, 3 products live
Conventional
25% down · 7.5% · 30yr
- Down + closing
- —
- Monthly P&I
- —
- Monthly cashflow
- —
- DSCR
- —
- Eligible?
- —
Personal DTI + credit; lowest rate.
DSCR
20% down · 8.5% · 30yr
- Down + closing
- —
- Monthly P&I
- —
- Monthly cashflow
- —
- DSCR
- —
- Eligible?
- —
No personal income docs; deal must DSCR.
Hard money
10% down · 12.0% · 12mo
- Down + closing
- —
- Monthly P&I
- —
- Monthly cashflow
- —
- DSCR
- —
- Eligible?
- —
Short-term bridge; refi at stabilization.
Rent comps 6 comps
| Address | Beds | Baths | Sqft | Rent | $/sqft | DOM | Units | Dist |
|---|---|---|---|---|---|---|---|---|
| 10534 Green Rock Dr San Antonio, TX | 3.0 | 2.5 | 1311 | $1,700 | $1.30 | 43d | 1 | 0.28mi |
| 10454 Clearwater Way San Antonio, TX | 3.0 | 2.5 | 1239 | $1,425 | $1.15 | 10d | 1 | 0.51mi |
| 10447 Clearwater Way San Antonio, TX | 3.0 | 2.5 | 1420 | $1,500 | $1.06 | 43d | 1 | 0.53mi |
| 10822 Green Brook St San Antonio, TX | 3.0 | 2.0 | 1023 | $1,500 | $1.47 | 43d | 1 | 0.55mi |
| 11026 Tree Line San Antonio, TX | 3.0 | 2.5 | 1360 | $1,299 | $0.96 | 43d | 1 | 0.78mi |
| 5727 Coopers Xing San Antonio, TX | 3.0 | 2.0 | 1127 | $2,400 | $2.13 | 21d | 1 | 1.18mi |
Listing history 14 events
-
2026-06-18days on market $120,900 Active 390 DOM
-
2026-06-17days on market $120,900 Active 389 DOM
-
2026-06-16days on market $120,900 Active 388 DOM
-
2026-06-15days on market $120,900 Active 387 DOM
-
2026-06-13days on market $120,900 Active 385 DOM
-
2026-06-09days on market $120,900 Active 381 DOM
-
2026-06-08days on market $120,900 Active 380 DOM
-
2026-06-07days on market $120,900 Active 379 DOM
-
2026-06-04days on market $120,900 Active 376 DOM
-
2026-06-03days on market $120,900 Active 375 DOM
-
2026-06-02days on market $120,900 Active 374 DOM
-
2026-06-01days on market $120,900 Active 373 DOM
-
2026-05-31days on market $120,900 Active 372 DOM
-
2025-05-24$120,900 Active 628-char remark
Show marketing remark (628 chars)
Indulge in ultimate relaxation in this luxurious bathroom suite. Featuring a spacious walk-in tile shower, this haven allows you to unwind under a massaging rain showerhead or soak away stress in the deep soaker tub. While the abundant natural light creates a refreshing and inviting atmosphere. Step into the culinary heart of the home - a modern kitchen bathed in natural light. Stainless steel appliances gleam against sleek countertops, while ample cabinet space ensures everything has its designated place. Prepare that perfect meals or enjoy casual family dinners in this bright and functional space. Land Leased not owned
ⓘ Source: listings_history table (triggers on properties + properties_extension) + one-shot
backfill from property_details.listing_events for pre-trigger history.
Nearby sold comps map
Loading sold comps map…
Walkable amenities ~0.75 mi
Loading nearby amenities…
Taxation est. · year 1
- Rental income
- $22,512
- − Mortgage interest
- −$6,772
- − Property taxes
- −$1,814
- − Insurance
- −$604
- − Repairs & maintenance
- −$1,801
- − Management
- −$1,801
- − Depreciation
- −$3,517
- Taxable income
- $6,203
- Est. tax owed @ 24.0%
- −$1,489
- After-tax cash flow
- $6,270/yr
For passive investors: Depreciation is non-cash, so a rental often shows a tax loss while cash-flowing — sheltering income. Rental losses are passive: they offset passive income freely, and up to $25,000/yr can offset ordinary (W-2) income if you actively participate and your MAGI is under $100k (phasing out to $0 by $150k); unused losses carry forward. On sale, claimed depreciation is recaptured at up to 25%, and gains may owe capital-gains tax (a 1031 exchange can defer both). Figures are a year-1 estimate at your 24.0% rate — not tax advice; consult a CPA.
Condition & rehab AI · 6 photos
This manufactured home is in excellent condition with a modern kitchen and spacious bathroom. It is move-in ready and would benefit from landscaping and a smart home system to further enhance its value.
Value-add opportunities
- Both Landscaping and curb appeal improvements — Enhances the home's curb appeal and can attract more buyers or renters.
- Both Add a smart home system — Improves convenience and can be a selling point for potential buyers or renters.
Renovation cost estimate screening
Value-add ROI direction
- Both Landscaping and curb appeal improvements — Enhances the home's curb appeal and can attract more buyers or renters. ↑
- Both Add a smart home system — Improves convenience and can be a selling point for potential buyers or renters. ↑
ⓘ Cost ranges are severity-bucket heuristics (US national rule-of-thumb). Get contractor quotes + a written scope before underwriting a rehab budget.
Schools (NCES district)
- District
- East Central ISD
- NCES district ID
- 4817850
- Math proficiency
- 16% ▼ -12.00%
- Reading proficiency
- 25% ▼ -6.00%
- Median HH income
- $53,941
- Composite
- 18.67/100
- National rank
- #8887
- State rank
- #758 of 826 in TX
Livability — Pearland
- Score
- 81/100
- State rank
- #32
- US rank
- #1539
Category grades
Schools grade is shown separately in the Schools card above.
Census & demographics
- County
- Brazoria County · 374,982 people
- City population
- 142,397
- Metro
- Houston-The Woodlands-Sugar Land, TX
- Population (ZIP)
- 51,332
- Household income
- $111,139
- Rent vs Own
- Severe rent burden
- 826.0
Population outlook (Bexar County) Hauer SSP2
- Today (2025)
- 2,336,851 people
- By 2030
- 2,560,728 · +9.6%
- By 2040
- 3,020,569 · +29.3%
- By 2050
- 3,493,522 · +49.5%
- By 2075
- 4,668,459 · +99.8%
- By 2100
- 5,533,242 · +136.8%
Race, ethnicity, and origin ACS 2023
- Neighborhood character
- Diverse neighborhood (Simpson 0.66)
- Race & ethnicity
- White 47% Hispanic / Latino 33% Two or more races 20% Black 10% Asian 7%
- Hispanic origin (detail)
- Mexican 26% Puerto Rican 2%
- Common ancestry
- Lithuanian 2% Slovak 2% Romanian 2%
- Foreign-born
- 12% · Canada, Vietnam, Guatemala
- Languages at home
- 77% English-only · Spanish 16% Other Indo-European 3% Vietnamese 2%
Political lean MEDSL · Bexar
- 2024 margin
- Lean D (+9.8) · D 54.3% · R 44.6% · Other 1.1%
- 2008→2024 swing
- +4.2pp toward D · 2008: 5.6pp · 2024: 9.8pp
- All cycles
- 2024: D+9.8 2020: D+18.2 2016: D+13.5 2012: D+4.6 2008: D+5.6
Not yet ingested
- Civics
- —
Market trends
- HPI YoY
- ▼ -100.56%
- Current HPI
- 244.7942
- Rent YoY
- ▲ 2.94%
- Metro
- Houston-The Woodlands-Sugar Land, TX
- State GDP YoY
- ▲ 3.95%
- F500 in state
- 110
Industry mix (Fortune 500 HQ in TX)
| Industry | F500 HQs | Revenue |
|---|---|---|
| Energy | 16 | $1,198B |
|
||
| Technology | 5 | $198B |
|
||
| Engineering / Construction | 4 | $72B |
|
||
| Energy Services | 3 | $60B |
|
||
| Utilities | 3 | $41B |
|
||
| Healthcare | 2 | $330B |
|
||
Price history
1 event — show timeline
- 2025-05-24 Listed $120,900 Zillow
Cash-flow waterfall
monthlySold comps — $/sqft
last 12 mo · ≤1 miLoading sold comps…