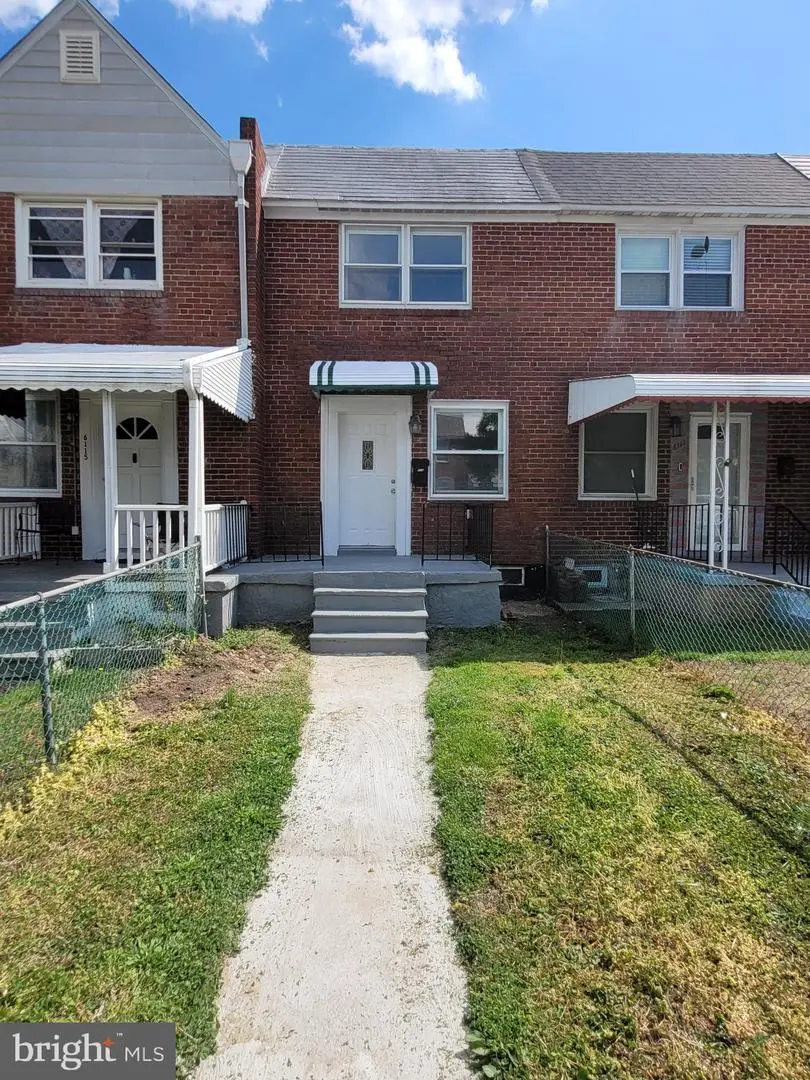
6113 Cardiff Ave · Baltimore, MD
Flood risk 1/10 · Minimal
- FEMA flood zone
- X (unshaded)
- Chance of flooding over 30 yrs
- 0.0%
- Est. flood insurance / yr
- $473 – $860
Fire risk 1/10 · Minimal
- Est. fire insurance / yr
- $755 – $1,403
Heat risk 8/10 · Major
- Hot days now (above 103°F)
- 7 days/yr
- Hot days in 30 yrs
- 15 days/yr
Wind risk 6/10 · Moderate
- Chance of severe wind over 30 yrs
- 27.0%
Air-quality risk 5/10 · Moderate
- Unhealthy air days now
- 6 days/yr
- Unhealthy air days in 30 yrs
- 8 days/yr
Risk factors via First Street. Map © Google.
Why this score? — see what drove the C- grade
The composite is a weighted blend of 9 inputs, each scored 0–100. Each bar is that input's sub-score; the figure is the points it added to the 100-point composite (weight × sub-score).
- Cash flow +26.3/30.0
- DSCR +8.9/10.0
- 1% rule +6.4/10.0
- Livability +3.8/5.0
- Rent growth +2.8/5.0
- Condition / age +2.5/5.0
- Schools +1.0/10.0
- ARV discount +0.0/15.0
- Appreciation +0.0/10.0
$170,000
🖨 Deal sheet 📄 Offer letter ✓ Due diligence
Listing remarks
Check out this 3BR 2BA, new A/C & water heater and potential to have a parking pad out back. Owner had rubber roof installed. Why rent when you can own or add it to your rental portfolio, come see for yourself today. Home has easy access to 295, 95, Bayview, N. I. H. , Canton and walking distance to Amazon Baltimore. Canton Crossing and Yard 56 around the corner for shopping.
Key facts
- Water heater
- Easy access to 295
- New a/c
Tags
Property features AI
Exterior
- Parking: On-street parking; Off-street parking
- Utilities: Public water; Public sewer; Natural gas for heating and hot water
- Home design: Interior townhouse/rowhouse; Fee simple ownership
- Construction: Brick construction; Rubber roof; Other foundation
- Exterior features: No tidal water on property
Interior
- Bedrooms: Two bedrooms on the upper level; One bedroom on the lower level
- Bathrooms: Two full bathrooms (one on upper level, one on lower level)
- Heating & cooling: Forced air heating; Electric-powered cooling (other type)
- Interior features: Partially finished basement with walkout level
Neighborhood map
What this means for you Summary
Snapshot
- This is a 3-bed/1.0-bath townhouse listed at $170k.
Deal economics
- At list price, monthly cash flow is $440 ($5k/yr) — positive.
- The deal already cash-flows at list — no discount required.
- Meets the 1% rule at list price ($2k rent vs $170k).
- Recommended offer: $167k (1.5% below list) — sets the bar for market timing.
- Cap rate 9.4% vs local median 6.0% in Baltimore — top-decile yield for the area; either an underpriced asset or a hidden risk that comps aren't pricing in. Stress-test before assuming the spread holds.
Location & tenants
- Location reads 76/100 on livability (#90 in MD, #3,396 nationally) — a middle-class / working-renter tenant base. Strengths: amenities A+, commute A+, housing A+; Watch: schools D, crime F.
- Baltimore City Public Schools (urban): math 7% / reading 16% proficiency, ranked #24 of 24 in MD (top 100%) — low school quality limits family demand, transient renter base, plan for 1-2y turnover; 79% free/reduced lunch — lower-income household profile, screen leases tightly.
- Market conditions: Rents rising (+1.3%/yr); 391 active listings in the ZIP; 27 comparable units currently listed for rent nearby; rentals at typical pace (median 22d on market — plan ~3-4 weeks tenant-placement turnaround); solid renter incomes; 1,273 units permitted in Baltimore city in 2024 (1,104 in 5+ unit buildings).
Forward outlook
- Local home prices are declining (-3.0%/yr); year-one equity from $1k of loan paydown is wiped out by about $5k of value loss. Plan a longer hold.
- Baltimore County population projected to shrink 4% by 2050 — rents likely to lag national; underwrite the cash flow, not the appreciation.
Negotiation context
- It's been on market 17 days — a 2% lower offer ($167k) is reasonable based on typical stale-listing flexibility.
- 2 sale attempts since 20y ago with the ask held roughly flat each time — persistent listings suggest the price (not the market) is what's stuck; bring a comps-based counter.
Risks & watch-outs
- Watch-outs: built in 1953 — expect roof / HVAC / electrical / plumbing capex.
- Climate carrying-cost: major wind risk, 27% chance of damaging wind over 30y; extreme-heat days projected 7→15/yr by 2055 (HVAC capex compounding) — expect insurance premiums to compound above CPI over the hold.
Questions for the listing agent
- Built in 1953 — when were the roof, HVAC, electrical panel, plumbing, and water heater last replaced?
- Is there a deadline driving the sale (1031 exchange, divorce, estate, relocation)? That informs how much negotiation room exists.
- Schools are D-rated, which usually means shorter tenancies and higher turnover. Who's the typical renter profile here, and what's been the actual vacancy rate?
- Crime grade is F in this area — have there been break-ins, vandalism, or insurance claims at this property in the last 3 years? What carrier currently insures it and at what premium?
- What's the average days-on-market for RENTAL listings here right now (not sales)? A rising rental-DOM trend means longer vacancies and softer asking-rent achievability than the comps imply.
- What's the recent tenant-quality profile in this submarket — average credit score on applications, eviction rate, late-payment / NSF rate, and stable-employment percentage? A property-management company in the area should have these aggregated.
- How much new for-sale + rental construction is in the pipeline within 1–3 miles? Heavy new supply typically softens prices + rents 12–24 months out; constrained supply supports both.
Investment metrics
- 1% rule
- 1.14% ✓
- Cap rate
- 9.40%
- Cash-on-cash
- 11.08%
- DSCR
- 1.49
- GRM
- 7.3
CMA / ARV
- ARV (median comp)
- $137,856
- List price
- $170,000
- Delta
- 23.32%
- Verdict
- OVERPRICED
- Comps
- 20 within 1.0 mi
Show comp detail 12 sales within ~0.75 mi
| Address | Dist | Beds/Ba | Sqft | Sold | Price | $/sf | Match |
|---|---|---|---|---|---|---|---|
| 1527 Elrino St | 0.10mi | 3/1.5 | 840 (0%) | 1mo | $105,000 | $125 | 92 |
| 1536 Elrino St | 0.08mi | 2/1.0 (-1) | 840 (0%) | 5mo | $128,700 | $153 | 87 |
| 1106 Anglesea St | 0.34mi | 2/1.0 (-1) | 840 (0%) | 2mo | $115,000 | $137 | 77 |
| 1217 Anglesea St | 0.29mi | 2/1.5 (-1) | 840 (0%) | 4mo | $135,000 | $161 | 76 |
| 1440 Broening Hwy | 0.07mi | 2/1.0 (-1) | 840 (0%) | 20mo | $122,000 | $145 | 75 |
| 1332 Broening Hwy | 0.18mi | 2/1.5 (-1) | 840 (0%) | 15mo | $179,000 | $213 | 72 |
| 1208 Broening Hwy | 0.28mi | 2/1.0 (-1) | 840 (0%) | 12mo | $135,000 | $161 | 72 |
| 1108 Anglesea St | 0.34mi | 2/1.0 (-1) | 840 (0%) | 10mo | $125,000 | $149 | 71 |
| 1627 Malvern St | 0.53mi | 2/1.5 (-1) | 840 (0%) | 3mo | $150,000 | $179 | 66 |
| 6109 Bessemer Ave | 0.06mi | 3/1.5 | 960 (+14%) | 7mo | $162,000 | $169 | 66 |
| 6519 Danville Ave | 0.43mi | 3/1.5 | 840 (0%) | 17mo | $154,650 | $184 | 64 |
| 1703 Malvern St | 0.53mi | 2/1.0 (-1) | 840 (0%) | 22mo | $106,000 | $126 | 51 |
Match score weights: distance 35% · size 25% · config 20% · recency 20%. Top-matched comps best support the ARV.
Projected returns pro-forma
-3.0% appreciation · 1.31% rent growth · sell at horizon
- IRR
- -1.6%
- Equity multiple
- 0.94×
- Total profit
- $-2,813
- Equity at exit
- $25,348
- IRR
- 6.3%
- Equity multiple
- 1.43×
- Total profit
- $20,648
- Equity at exit
- $14,698
Cash invested: $47,600 (down + closing). Projections, not guarantees.
Landlord ↔ Tenant lean methodology
- Overall (CITY)
- 12 Strongly Tenant-Friendly
- State Maryland
- 27 Tenant-Leaning · D+14
- County
- — inherits STATE
- City Baltimore
- 12 Strongly Tenant-Friendly · D+58
ZIP-level market 21224
- Rents YoY
- 1.3%
- Active inventory
- 391
- Price-to-rent
- 7.3×
Monthly cashflow live
- Estimated rent
- $1,941 high interval (Pro) →
- Mortgage (P&I)
- −$891
- Tax from tax record
- −$131 /mo · $1,574/yr
- Insurance
- −$71
- HOA
- −$0
- Vacancy / Maint / Mgmt
- −$408
- Net cashflow
- $440
Break-even live
UW: 25.0% down · 7.5% · 30yr · 1.5% tax · 5.0% vac · 8.0% maint · 8.0% mgmt
Financing live
Cash to close
- Down payment
- $42,500
- Closing costs
- $5,100
- Reserves months
- —
- Total cash needed
- —
Loan-product check · same deal, 3 products live
Conventional
25% down · 7.5% · 30yr
- Down + closing
- —
- Monthly P&I
- —
- Monthly cashflow
- —
- DSCR
- —
- Eligible?
- —
Personal DTI + credit; lowest rate.
DSCR
20% down · 8.5% · 30yr
- Down + closing
- —
- Monthly P&I
- —
- Monthly cashflow
- —
- DSCR
- —
- Eligible?
- —
No personal income docs; deal must DSCR.
Hard money
10% down · 12.0% · 12mo
- Down + closing
- —
- Monthly P&I
- —
- Monthly cashflow
- —
- DSCR
- —
- Eligible?
- —
Short-term bridge; refi at stabilization.
Rent comps 27 comps
| Address | Beds | Baths | Sqft | Rent | $/sqft | DOM | Units | Dist |
|---|---|---|---|---|---|---|---|---|
| 1504 Elrino St Baltimore, MD | 2.0 | 2.0 | 1050 | $1,650 | $1.57 | 4d | 1 | 0.06mi |
| 1613 Elrino St Baltimore, MD | 2.0 | 1.0 | 700 | $1,350 | $1.93 | 44d | 1 | 0.18mi |
| 6518 Brown Ave Baltimore, MD | 1.0–2.0 | 1.0 | 675 | $1,300 | $1.93 | 24d | 3 | 0.45mi |
| 560 Bayview Blvd Baltimore, MD | 1.0–3.0 | 1.0–3.0 | 1108 | $3,372 | $3.04 | 2d | 25 | 0.76mi |
| 6722 Brentwood Ave Unit 2FL Dundalk, MD | 3.0 | 1.0 | 900 | $1,750 | $1.94 | 44d | 1 | 0.77mi |
| 456 Elrino St Unit B Baltimore, MD | 2.0 | 1.0 | 800 | $1,600 | $2.00 | 44d | 1 | 0.81mi |
| 442 Folcroft St Unit A Baltimore, MD | 2.0 | 1.5 | 1071 | $1,600 | $1.49 | 3d | 1 | 0.84mi |
| 363 Gusryan St Baltimore, MD | 2.0 | 2.0 | 840 | $1,950 | $2.32 | 12d | 1 | 0.92mi |
| 334 Kane St Baltimore, MD | 2.0 | 2.0 | 1050 | $1,675 | $1.60 | 24d | 1 | 0.98mi |
| 628 47th St Apt RW2 Baltimore, MD | 2.0 | 1.0 | 750 | $1,200 | $1.60 | 11d | 1 | 1.02mi |
| 630 47th St Unit B Baltimore, MD | 2.0 | 1.0 | 750 | $1,200 | $1.60 | 44d | 1 | 1.03mi |
| 2125 Cameron Dr Dundalk, MD | 1.0–2.0 | 1.0 | 697 | $1,350 | $1.94 | 44d | 9 | 1.03mi |
| 3850 Boston St Baltimore, MD | 2.0 | 1.0–2.0 | 854 | $3,378 | $3.96 | 2d | 22 | 1.06mi |
| 6905 Bank St Baltimore, MD | 2.0 | 1.5 | 784 | $1,650 | $2.10 | 44d | 1 | 1.11mi |
| 6802 Conley St Baltimore, MD | 2.0 | 1.5 | 939 | $1,750 | $1.86 | 22d | 1 | 1.15mi |
| 3700 Toone St Baltimore, MD | 1.0–2.0 | 1.0–2.0 | 1093 | $3,218 | $2.94 | 2d | 28 | 1.19mi |
| 1955 Walnut Ave Dundalk, MD | 3.0 | 1.0 | 950 | $2,300 | $2.42 | 44d | 1 | 1.23mi |
| 4015 Eastern Ave Unit 2L Baltimore, MD | 3.0 | 2.0 | 1100 | $1,800 | $1.64 | 44d | 1 | 1.29mi |
| 1200 S Conkling St Baltimore, MD | 1.0–2.0 | 1.0–2.0 | 1085 | $2,933 | $2.70 | 2d | 16 | 1.29mi |
| 3610 Dillon St Baltimore, MD | 1.0–2.0 | 1.0–2.0 | 828 | $2,820 | $3.41 | 44d | 1 | 1.31mi |
| 3518 Elliott St Baltimore, MD | 3.0 | 2.5 | 1036 | $2,800 | $2.70 | 18d | 1 | 1.31mi |
| 6552 Parnell Ave Dundalk, MD | 2.0 | 1.5 | 885 | $1,500 | $1.69 | 18d | 1 | 1.34mi |
| 7124 Gough St Baltimore, MD | 2.0 | 1.5 | 1096 | $1,700 | $1.55 | 22d | 1 | 1.37mi |
| 3905 Bank St Baltimore, MD | 4.0 | 1.0–3.0 | 909 | $2,820 | $3.10 | 2d | 20 | 1.37mi |
| 6545 Baltimore Ave Dundalk, MD | 2.0 | 1.0 | 852 | $1,500 | $1.76 | 44d | 1 | 1.42mi |
| 321 Fagley St Baltimore, MD | 2.0 | 1.0 | 800 | $1,650 | $2.06 | 20d | 1 | 1.43mi |
| 223 Grundy St Baltimore, MD | 2.0 | 1.0 | 864 | $1,450 | $1.68 | 24d | 1 | 1.46mi |
Listing history 5 events
-
2026-05-18status Pending 384-char remark
-
2026-05-11historical Active Under Contract 384-char remark
-
2026-04-25$170,000 Active 384-char remark
-
2007-01-30historical
-
2006-07-31
ⓘ Source: listings_history table (triggers on properties + properties_extension) + one-shot
backfill from property_details.listing_events for pre-trigger history.
Tax reassessment forecast MD · Partial reset (capped growth)
- Current annual tax
- $1,574 · $131/mo
- Projected year-2 tax
- $1,713 · $143/mo
- Expected delta
- +$140/yr (+$12/mo · 8.9%)
ⓘ Screening estimate from a state-policy table — verify with the county assessor before closing.
Climate risk First Street
- Flood 1/10 Low FEMA zone X (unshaded) · 0% chance over 30 yrs
- Wildfire 1/10 Low
- Heat 8/10 Severe 7 d/yr ≥103°F today · 15 d/yr by 30 yrs out
- Wind 6/10 Major 27% chance of damaging wind over 30 yrs
- Air quality 5/10 Major 6 unhealthy d/yr today · 8 by 30 yrs out
Nearby sold comps map
Loading sold comps map…
Walkable amenities ~0.75 mi
Loading nearby amenities…
Taxation est. · year 1
- Rental income
- $23,288
- − Mortgage interest
- −$9,523
- − Property taxes
- −$1,574
- − Insurance
- −$850
- − Repairs & maintenance
- −$1,863
- − Management
- −$1,863
- − Depreciation
- −$4,945
- Taxable income
- $2,670
- Est. tax owed @ 24.0%
- −$641
- After-tax cash flow
- $4,635/yr
For passive investors: Depreciation is non-cash, so a rental often shows a tax loss while cash-flowing — sheltering income. Rental losses are passive: they offset passive income freely, and up to $25,000/yr can offset ordinary (W-2) income if you actively participate and your MAGI is under $100k (phasing out to $0 by $150k); unused losses carry forward. On sale, claimed depreciation is recaptured at up to 25%, and gains may owe capital-gains tax (a 1031 exchange can defer both). Figures are a year-1 estimate at your 24.0% rate — not tax advice; consult a CPA.
Schools (NCES district)
- District
- Baltimore City Public Schools
- NCES district ID
- 2400090
- Math proficiency
- 7% ▼ -9.00%
- Reading proficiency
- 16% ▼ -5.00%
- Median HH income
- $42,108
- Composite
- 10.08/100
- National rank
- #9805
- State rank
- #24 of 24 in MD
Livability — Baltimore
- Score
- 76/100
- State rank
- #90
- US rank
- #3396
Category grades
Schools grade is shown separately in the Schools card above.
Census & demographics
- Census place
- Baltimore, MD
- County
- Baltimore City · 558,601 people
- City population
- 588,727
- Metro
- Baltimore-Columbia-Towson, MD
- Population (ZIP)
- 47,465
- Household income
- $89,017
- Rent vs Own
- Severe rent burden
- 1786.0
Population outlook (Baltimore County) Hauer SSP2
- Today (2025)
- 624,249 people
- By 2030
- 621,541 · -0.4%
- By 2040
- 609,756 · -2.3%
- By 2050
- 597,249 · -4.3%
- By 2075
- 552,236 · -11.5%
- By 2100
- 513,934 · -17.7%
Race, ethnicity, and origin ACS 2023
- Neighborhood character
- Diverse neighborhood (Simpson 0.62)
- Race & ethnicity
- White 55% Hispanic / Latino 21% Black 16% Two or more races 7% Asian 4%
- Hispanic origin (detail)
- Mexican 4% Puerto Rican 2% Dominican 1%
- Common ancestry
- Romanian 5% Lithuanian 2% Italian 1%
- Foreign-born
- 17% · Canada, China, Vietnam
- Languages at home
- 76% English-only · Spanish 18% Other Indo-European 2% Russian/Polish/Slavic 1%
Political lean MEDSL · Baltimore
- 2024 margin
- Solid D (+73.0) · D 85.2% · R 12.2% · Other 2.6%
- 2008→2024 swing
- -2.5pp toward R · 2008: 75.5pp · 2024: 73.0pp
- All cycles
- 2024: D+73.0 2020: D+76.6 2016: D+74.6 2012: D+76.4 2008: D+75.5
Not yet ingested
- Civics
- —
Market trends
- HPI YoY
- ▼ -332.23%
- Current HPI
- 241.284
- Rent YoY
- ▲ 1.31%
- Metro
- Baltimore-Columbia-Towson, MD
- State GDP YoY
- ▲ 2.97%
- F500 in state
- 12
Industry mix (Fortune 500 HQ in MD)
| Industry | F500 HQs | Revenue |
|---|---|---|
| Aerospace / Defense | 1 | $71B |
|
||
| Utilities | 1 | $25B |
|
||
| Hotels | 1 | $24B |
|
||
| Consumer Goods | 1 | $7B |
|
||
| Real Estate | 1 | $6B |
|
||
| Chemicals | 1 | $2B |
|
||
Price history
5 events — show timeline
- 2026-05-18 Pending — BRIGHT MLS
- 2026-05-11 Contingent — BRIGHT MLS
- 2026-04-25 Listed $170,000 BRIGHT MLS
- 2007-01-30 Delisted — MRIS
- 2006-07-31 Listed — MRIS
Property tax history
-1.8%/yrLatest (2025): $1,574 · +0.0% YoY. Source: county tax records.
Cash-flow waterfall
monthlySold comps — $/sqft
last 12 mo · ≤1 miLoading sold comps…