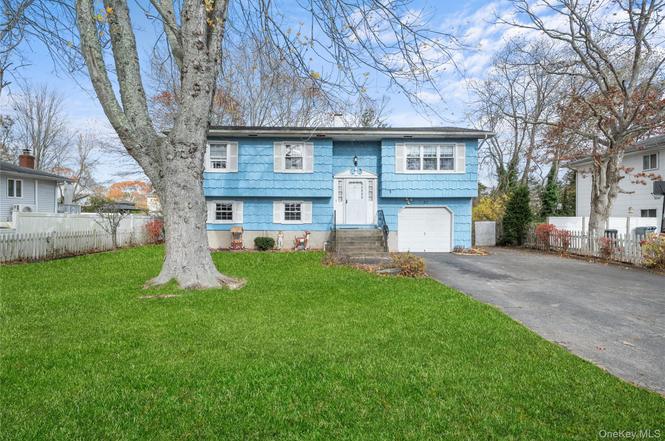
21 Lama Dr · Shirley, NY
Flood risk 1/10 · Minimal
- FEMA flood zone
- X (unshaded)
- Chance of flooding over 30 yrs
- 0.0%
- Est. flood insurance / yr
- $473 – $860
Fire risk 2/10 · Minimal
- Est. fire insurance / yr
- $691 – $1,283
Heat risk 4/10 · Minor
- Hot days now (above 92°F)
- 7 days/yr
- Hot days in 30 yrs
- 20 days/yr
Wind risk 8/10 · Major
- Chance of severe wind over 30 yrs
- 80.0%
Air-quality risk 4/10 · Minor
- Unhealthy air days now
- 3 days/yr
- Unhealthy air days in 30 yrs
- 5 days/yr
Risk factors via First Street. Map © Google.
Why this score? — see what drove the B- grade
The composite is a weighted blend of 9 inputs, each scored 0–100. Each bar is that input's sub-score; the figure is the points it added to the 100-point composite (weight × sub-score).
- Cash flow +24.4/30.0
- ARV discount +15.0/15.0
- DSCR +7.9/10.0
- 1% rule +6.6/10.0
- Schools +4.7/10.0
- Livability +3.1/5.0
- Rent growth +2.5/5.0
- Condition / age +2.5/5.0
- Appreciation +0.0/10.0
$469,000
🖨 Deal sheet 📄 Offer letter ✓ Due diligence
Listing remarks
Don’t miss this opportunity! This spacious High Ranch single-family home offers 1,956 sq ft of living space on a 9,148 sq ft lot, perfectly positioned mid-block in a central Shirley location close to everything. Featuring 3 bedrooms and 1.5 full bathrooms, this home includes an eat-in kitchen, a large attached 1-car garage, and a 4-car driveway—plenty of parking for multiple vehicles. The ground level provides access to the rear yard, garage, and includes a bathroom, laundry room, bonus room, and a very large family room—ideal for entertaining, extended living space, or potential guest quarters. The property is being sold “As Is” with no contingencies, and a qu
Key facts
- 9,148 sq ft lot
- Garage
- Built 1973
Neighborhood map
What this means for you Summary
Snapshot
- This is a 3-bed/1.5-bath single-family listed at $469k.
Deal economics
- At list price, monthly cash flow is $952 ($11k/yr) — positive.
- The deal already cash-flows at list — no discount required.
- Meets the 1% rule at list price ($5k rent vs $469k).
- Recommended offer: $462k (1.5% below list) — sets the bar for market timing.
- Cap rate 8.7% vs local median 4.8% in Shirley — top-decile yield for the area; either an underpriced asset or a hidden risk that comps aren't pricing in. Stress-test before assuming the spread holds.
Location & tenants
- Location reads 62/100 on livability (#886 in NY) — a middle-class / working-renter tenant base. Strengths: employment A+, housing A+; Watch: crime D+, amenities F, commute F.
- William Floyd Union Free School District (suburban): math 48% / reading 57% proficiency, ranked #309 of 590 in NY (top 52%) — acceptable for families but not a draw, mixed tenant base, ~2y average lease.
- Zoned schools: Nathaniel Woodhull Elementary School (math 45% / reading 50%, grade D, #1,191 of 2,108 statewide, top 57%, 703 students, 54% FRL); William Paca Middle School (math 31% / reading 37%, grade F, #497 of 729 statewide, top 69%, 1,009 students, 59% FRL); William Floyd High School (math 65% / reading 87%, grade A-, #616 of 1,100 statewide, top 57%, 3,013 students, 54% FRL).
- Market conditions: 183 active listings in the ZIP; 2 comparable units currently listed for rent nearby; 1,366 units permitted in Suffolk County in 2024 (216 in 5+ unit buildings).
Forward outlook
- Local home prices are declining (-3.0%/yr); year-one equity from $3k of loan paydown is wiped out by about $14k of value loss. Plan a longer hold.
- Suffolk County population projected to shrink 5% by 2050 — rents likely to lag national; underwrite the cash flow, not the appreciation.
Negotiation context
- It's been on market 15 days — a 2% lower offer ($462k) is reasonable based on typical stale-listing flexibility.
- Current owner paid $125k; list at $469k implies a 275% gain — meaningful room to come down on a strong offer.
Risks & watch-outs
- Climate carrying-cost: severe wind risk, 80% chance of damaging wind over 30y — expect insurance premiums to compound above CPI over the hold.
Questions for the listing agent
- Built in 1973 — when were the roof, HVAC, electrical panel, plumbing, and water heater last replaced?
- Is there a deadline driving the sale (1031 exchange, divorce, estate, relocation)? That informs how much negotiation room exists.
- Schools are F-rated, which usually means shorter tenancies and higher turnover. Who's the typical renter profile here, and what's been the actual vacancy rate?
- Crime grade is D in this area — have there been break-ins, vandalism, or insurance claims at this property in the last 3 years? What carrier currently insures it and at what premium?
- What's the average days-on-market for RENTAL listings here right now (not sales)? A rising rental-DOM trend means longer vacancies and softer asking-rent achievability than the comps imply.
- What's the recent tenant-quality profile in this submarket — average credit score on applications, eviction rate, late-payment / NSF rate, and stable-employment percentage? A property-management company in the area should have these aggregated.
- How much new for-sale + rental construction is in the pipeline within 1–3 miles? Heavy new supply typically softens prices + rents 12–24 months out; constrained supply supports both.
Investment metrics
- 1% rule
- 1.16% ✓
- Cap rate
- 8.73%
- Cash-on-cash
- 8.70%
- DSCR
- 1.39
- GRM
- 7.2
CMA / ARV
- ARV (on-the-fly)
- $633,744
- Comps found
- 12
Show comp detail 12 sales within ~0.75 mi
| Address | Dist | Beds/Ba | Sqft | Sold | Price | $/sf | Match |
|---|---|---|---|---|---|---|---|
| 7 Tipton Dr W | 0.23mi | 3/1.5 | 1,808 (-8%) | 0mo | $620,000 | $343 | 76 |
| 41 Lama Dr | 0.16mi | 3/2.0 | 1,798 (-8%) | 1mo | $630,000 | $350 | 76 |
| 55 Lama Dr | 0.26mi | 4/2.5 (+1) | 1,998 (+2%) | 8mo | $615,000 | $308 | 69 |
| 39 Appel Dr E | 0.65mi | 3/2.0 | 1,950 (-0%) | 0mo | $665,000 | $341 | 67 |
| 32 Rockledge Dr | 0.39mi | 3/2.0 | 1,736 (-11%) | 3mo | $520,000 | $300 | 59 |
| 70 Breston Dr E | 0.55mi | 4/3.0 (+1) | 2,041 (+4%) | 0mo | $628,000 | $308 | 56 |
| 45 Arrowhead Dr | 0.48mi | 3/3.0 | 2,112 (+8%) | 5mo | $600,000 | $284 | 54 |
| 11 Happy Acres Dr | 0.23mi | 4/2.5 (+1) | 1,722 (-12%) | 12mo | $630,000 | $366 | 50 |
| 10 Helene Dr | 0.54mi | 4/2.0 (+1) | 1,775 (-9%) | 13mo | $590,000 | $332 | 42 |
| 30 Beacon St | 0.59mi | 3/2.0 | 1,700 (-13%) | 13mo | $550,000 | $324 | 38 |
| 118 Lexington Rd | 0.75mi | 4/2.5 (+1) | 2,137 (+9%) | 4mo | $540,000 | $253 | 37 |
| 63 Linden Ln | 0.66mi | 4/2.0 (+1) | 2,171 (+11%) | 11mo | $600,000 | $276 | 35 |
Match score weights: distance 35% · size 25% · config 20% · recency 20%. Top-matched comps best support the ARV.
Projected returns pro-forma
-3.0% appreciation · 3.0% rent growth · sell at horizon
- IRR
- -3.1%
- Equity multiple
- 0.88×
- Total profit
- $-15,239
- Equity at exit
- $69,929
- IRR
- 6.6%
- Equity multiple
- 1.50×
- Total profit
- $65,379
- Equity at exit
- $40,551
Cash invested: $131,320 (down + closing). Projections, not guarantees.
Landlord ↔ Tenant lean methodology
- Overall (STATE)
- 15 Strongly Tenant-Friendly
- State New York
- 15 Strongly Tenant-Friendly · D+10
- County
- — inherits STATE
- City
- — inherits STATE
ZIP-level market 11967
- Home prices YoY
- -33.1%
- Active inventory
- 183
- Price-to-rent
- 7.2×
Monthly cashflow live
- Estimated rent
- $5,443 medium interval (Pro) →
- Mortgage (P&I)
- −$2,459
- Tax from tax record
- −$694 /mo · $8,324/yr
- Insurance
- −$195
- HOA
- −$0
- Vacancy / Maint / Mgmt
- −$1,143
- Net cashflow
- $952
Break-even live
UW: 25.0% down · 7.5% · 30yr · 1.5% tax · 5.0% vac · 8.0% maint · 8.0% mgmt
Financing live
Cash to close
- Down payment
- $117,250
- Closing costs
- $14,070
- Reserves months
- —
- Total cash needed
- —
Loan-product check · same deal, 3 products live
Conventional
25% down · 7.5% · 30yr
- Down + closing
- —
- Monthly P&I
- —
- Monthly cashflow
- —
- DSCR
- —
- Eligible?
- —
Personal DTI + credit; lowest rate.
DSCR
20% down · 8.5% · 30yr
- Down + closing
- —
- Monthly P&I
- —
- Monthly cashflow
- —
- DSCR
- —
- Eligible?
- —
No personal income docs; deal must DSCR.
Hard money
10% down · 12.0% · 12mo
- Down + closing
- —
- Monthly P&I
- —
- Monthly cashflow
- —
- DSCR
- —
- Eligible?
- —
Short-term bridge; refi at stabilization.
Rent comps 2 comps
| Address | Beds | Baths | Sqft | Rent | $/sqft | DOM | Units | Dist |
|---|---|---|---|---|---|---|---|---|
| 357 Smith Rd Shirley, NY | 3.0 | 2.0 | 2000 | $6,500 | $3.25 | 2d | 1 | 1.10mi |
| 126 Flower Rd Shirley, NY | 4.0 | 1.0 | 1756 | $4,100 | $2.33 | 1d | 1 | 1.28mi |
Listing history 4 events
-
2025-12-04status Pending
-
2025-11-20$469,000 Active
-
2025-11-17historical $469,000
-
1987-09-24soldstatus $125,000
ⓘ Source: listings_history table (triggers on properties + properties_extension) + one-shot
backfill from property_details.listing_events for pre-trigger history.
Tax reassessment forecast NY · Partial reset (capped growth)
- Current annual tax
- $8,324 · $694/mo
- Projected year-2 tax
- $8,324 · $694/mo
- Expected delta
- $0/yr ($0/mo · 0.0%)
ⓘ Screening estimate from a state-policy table — verify with the county assessor before closing.
Climate risk First Street
- Flood 1/10 Low FEMA zone X (unshaded) · 0% chance over 30 yrs
- Wildfire 2/10 Low
- Heat 4/10 Moderate 7 d/yr ≥92°F today · 20 d/yr by 30 yrs out
- Wind 8/10 Severe 80% chance of damaging wind over 30 yrs
- Air quality 4/10 Moderate 3 unhealthy d/yr today · 5 by 30 yrs out
Nearby sold comps map
Loading sold comps map…
Walkable amenities ~0.75 mi
Loading nearby amenities…
Taxation est. · year 1
- Rental income
- $65,320
- − Mortgage interest
- −$26,271
- − Property taxes
- −$8,324
- − Insurance
- −$2,345
- − Repairs & maintenance
- −$5,226
- − Management
- −$5,226
- − Depreciation
- −$13,644
- Taxable income
- $4,285
- Est. tax owed @ 24.0%
- −$1,028
- After-tax cash flow
- $10,391/yr
For passive investors: Depreciation is non-cash, so a rental often shows a tax loss while cash-flowing — sheltering income. Rental losses are passive: they offset passive income freely, and up to $25,000/yr can offset ordinary (W-2) income if you actively participate and your MAGI is under $100k (phasing out to $0 by $150k); unused losses carry forward. On sale, claimed depreciation is recaptured at up to 25%, and gains may owe capital-gains tax (a 1031 exchange can defer both). Figures are a year-1 estimate at your 24.0% rate — not tax advice; consult a CPA.
Schools (NCES district)
- District
- William Floyd Union Free School District
- NCES district ID
- 3618690
- Math proficiency
- 48% ▲ 3.00%
- Reading proficiency
- 57% ▲ 11.00%
- Median HH income
- $70,564
- Composite
- 46.79/100
- National rank
- #2383
- State rank
- #309 of 590 in NY
Livability — Shirley
- Score
- 62/100
- State rank
- #886
- US rank
- #17184
Category grades
Schools grade is shown separately in the Schools card above.
Census & demographics
- Census place
- Shirley, NY
- City population
- 27,266
- Population (ZIP)
- 27,266
Population outlook (Suffolk County) Hauer SSP2
- Today (2025)
- 1,505,262 people
- By 2030
- 1,498,318 · -0.5%
- By 2040
- 1,471,101 · -2.3%
- By 2050
- 1,424,848 · -5.3%
- By 2075
- 1,337,157 · -11.2%
- By 2100
- 1,217,720 · -19.1%
Race, ethnicity, and origin ACS 2023
- Neighborhood character
- Diverse neighborhood (Simpson 0.57)
- Race & ethnicity
- White 59% Hispanic / Latino 25% Black 9% Two or more races 8% Asian 4%
- Hispanic origin (detail)
- Puerto Rican 10% Dominican 2%
- Common ancestry
- Romanian 3% Lithuanian 2% Scotch-Irish 1%
- Foreign-born
- 12% · Canada, China, Jamaica
- Languages at home
- 76% English-only · Spanish 17% Other Indo-European 4% Chinese 1%
Political lean MEDSL · Suffolk
- 2024 margin
- Lean R (+10.0) · D 45.0% · R 55.0%
- 2008→2024 swing
- -16.0pp toward R · 2008: 6.0pp · 2024: -10.0pp
- All cycles
- 2024: R+10.0 2020: R+0.0 2016: R+8.2 2012: D+2.9 2008: D+6.0
Not yet ingested
- Civics
- —
Market trends
- HPI YoY
- ▼ -212.21%
- Current HPI
- 428.8362
- Rent YoY
- —
- Metro
- —
- State GDP YoY
- ▲ 2.60%
- F500 in state
- 92
Industry mix (Fortune 500 HQ in NY)
| Industry | F500 HQs | Revenue |
|---|---|---|
| Financial Services | 10 | $950B |
|
||
| Consumer Goods | 9 | $162B |
|
||
| Insurance | 4 | $225B |
|
||
| Telecommunications | 2 | $144B |
|
||
| Pharmaceuticals | 2 | $112B |
|
||
| Media / Entertainment | 2 | $69B |
|
||
Price history
+275.2% since first listed4 events — show timeline
- 2025-12-04 Pending — OneKey® MLS as Distributed by MLS Grid
- 2025-11-20 Listed $469,000 OneKey® MLS as Distributed by MLS Grid
- 2025-11-17 Coming Soon $469,000 OneKey® MLS as Distributed by MLS Grid
- 1987-09-24 Sold (Public Records) $125,000 Public Records
Property tax history
+1.9%/yrLatest (2025): $8,324 · +0.0% YoY. Source: county tax records.
Cash-flow waterfall
monthlySold comps — $/sqft
last 12 mo · ≤1 miLoading sold comps…