 🏗️ New Construction
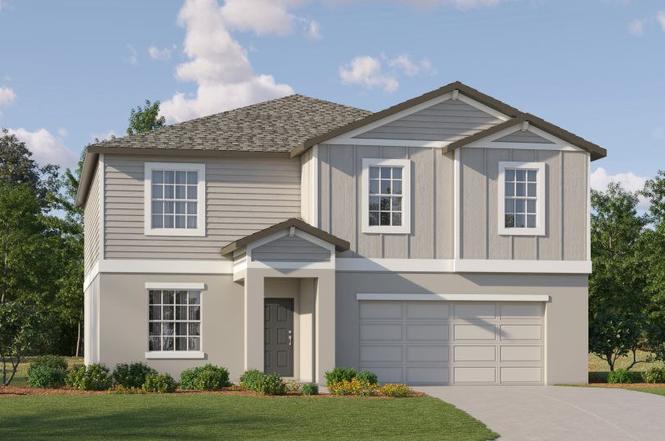
Richmond Plan · Connerton, FL
Flood risk 1/10 · Minimal
- FEMA flood zone
- A
- Chance of flooding over 30 yrs
- 0.0%
- Est. flood insurance / yr
- $1,009 – $1,996
Fire risk 6/10 · Moderate
- Est. fire insurance / yr
- $947 – $1,759
Heat risk 10/10 · Severe
- Hot days now (above 109°F)
- 7 days/yr
- Hot days in 30 yrs
- 27 days/yr
Wind risk 9/10 · Severe
- Chance of severe wind over 30 yrs
- 99.0%
Air-quality risk 2/10 · Minimal
- Unhealthy air days now
- 1 days/yr
- Unhealthy air days in 30 yrs
- 1 days/yr
Risk factors via First Street. Map © Google.
Why this score? — see what drove the F grade
The composite is a weighted blend of 9 inputs, each scored 0–100. Each bar is that input's sub-score; the figure is the points it added to the 100-point composite (weight × sub-score).
- ARV discount +7.5/15.0
- Cash flow +5.9/30.0
- Schools +4.3/10.0
- Appreciation +4.2/10.0
- Livability +3.3/5.0
- Rent growth +2.5/5.0
- Condition / age +2.5/5.0
- 1% rule +1.3/10.0
- DSCR +0.3/10.0
$453,690
🖨 Deal sheet (PDF) 📄 Offer letter ✓ Due diligence
Key facts
- 2 garage spots
- Listed 391 days
Property features AI
Finance
- Other: Address: 20421 Rose Cottage Way, Land O Lakes, FL 34637; Status: Active
- Financial info: List price $451,190
Exterior
- Parking: 2 total parking spaces; 2-car garage
- Home design: Single-family home (Richmond plan); New construction — listed as Plan
- Exterior features: Living area approximately 3,092 square feet
Interior
- Bedrooms: 6 bedrooms
- Bathrooms: 3 full bathrooms
- Interior features: Plan: Richmond (new construction plan)
Neighborhood map
What this means for you Summary
Snapshot
- This is a 6-bed/3.0-bath single-family listed at $454k.
Deal economics
- At list price, monthly cash flow is $-1k ($-16k/yr) — negative.
- To cash-flow at today's rent, offer at most $433k (4.5% below list).
- To meet the 1% rule (rent ≥ 1% of price), the offer needs to be $395k (13.0% below list).
- Recommended offer: $395k (13.0% below list) — sets the bar for 1% rule.
Location & tenants
- Location reads 66/100 on livability (#596 in FL) — a middle-class / working-renter tenant base. Strengths: crime A+, employment A+, housing A+; Watch: amenities F, commute F, health & safety F.
- Pasco (suburban): math 50% / reading 52% proficiency, ranked #32 of 73 in FL (top 44%) — acceptable for families but not a draw, mixed tenant base, ~2y average lease.
- Zoned schools: Connerton Elementary School (math 48% / reading 57%, grade C-, #976 of 2,144 statewide, top 46%, 958 students, 39% FRL); Pine View Middle School (math 63% / reading 52%, grade B, #157 of 571 statewide, top 28%, 1,170 students, 32% FRL); Land O' Lakes High School (math 56% / reading 64%, grade C+, #106 of 667 statewide, top 16%, 2,248 students, 27% FRL) — zoned schools average 33% FRL vs 48% district-wide (16 pts lower); this property's tenant base skews higher-income than the district average.
- Market conditions: 287 active listings in the ZIP; 1 comparable units currently listed for rent nearby; high-income renter base; 6,765 units permitted in Pasco County in 2024 (1,250 in 5+ unit buildings).
- This rent runs 41% of the median local income ($115k/yr) — at the standard rent-burdened threshold; future hikes will face affordability resistance.
Forward outlook
- Local home prices are declining (-1.5%/yr); year-one equity from $4k of loan paydown is wiped out by about $10k of value loss. Plan a longer hold.
- Pasco County population projected at +29% by 2050 — long-run rental-demand tailwind backs the buy-and-hold thesis.
Negotiation context
- It's been on market 391 days — a 12% lower offer ($399k) is reasonable based on typical stale-listing flexibility.
Risks & watch-outs
- Watch-outs: flood insurance adds $125/mo.
- Climate carrying-cost: in FEMA flood zone A (mandatory federal flood insurance); severe wind risk, 99% chance of damaging wind over 30y; major wildfire risk; extreme-heat days projected 7→27/yr by 2055 (HVAC capex compounding) — expect insurance premiums to compound above CPI over the hold.
Questions for the listing agent
- What do current leases actually rent for vs. the listed asking? Can we see a recent rent roll and the last 12 months of T-12 income?
- It's been on market 391 days. Have you received any prior offers? Is the seller open to a 13% concession, seller financing, or rate buy-down credit?
- What's the actual annual flood-insurance premium (NFIP or private), and is the property in a SFHA with mandatory coverage?
- Why hasn't it sold? Are there any deal-killer items the seller is aware of (foundation, flood, title, zoning, code violations)?
- Is there a deadline driving the sale (1031 exchange, divorce, estate, relocation)? That informs how much negotiation room exists.
- Schools are D-rated, which usually means shorter tenancies and higher turnover. Who's the typical renter profile here, and what's been the actual vacancy rate?
- The area grade is low — what's the realistic commute time and amenity access for the typical tenant pool here? Any planned neighborhood developments (good or bad) we should know about?
- What's the average days-on-market for RENTAL listings here right now (not sales)? A rising rental-DOM trend means longer vacancies and softer asking-rent achievability than the comps imply.
- What's the recent tenant-quality profile in this submarket — average credit score on applications, eviction rate, late-payment / NSF rate, and stable-employment percentage? A property-management company in the area should have these aggregated.
- How much new for-sale + rental construction is in the pipeline within 1–3 miles? Heavy new supply typically softens prices + rents 12–24 months out; constrained supply supports both.
Investment metrics
- 1% rule
- 0.63% ✗
- Cap rate
- 3.96%
- Cash-on-cash
- -8.32%
- DSCR
- 0.63
- GRM
- 13.2
CMA / ARV
- ARV (on-the-fly)
- $627,676
- Comps found
- 4
Show comp detail 4 sales within ~0.75 mi
| Address | Dist | Beds/Ba | Sqft | Sold | Price | $/sf | Match |
|---|---|---|---|---|---|---|---|
| 8836 Handel Loop | 0.26mi | 5/3.0 (-1) | 2,853 (-8%) | 4mo | $487,000 | $171 | 66 |
| 8831 Garden Party Dr | 0.19mi | 5/4.5 (-1) | 2,933 (-5%) | 16mo | $595,000 | $203 | 58 |
| 20142 Lace Cascade Rd | 0.58mi | 5/3.0 (-1) | 3,116 (+1%) | 12mo | $815,000 | $262 | 56 |
| 8742 Handel Loop | 0.25mi | 5/3.0 (-1) | 3,531 (+14%) | 8mo | $685,000 | $194 | 53 |
Match score weights: distance 35% · size 25% · config 20% · recency 20%. Top-matched comps best support the ARV.
Projected returns pro-forma
-1.54% appreciation · 3.0% rent growth · sell at horizon
- IRR
- -21.0%
- Equity multiple
- 0.16×
- Total profit
- $-147,817
- Equity at exit
- $135,452
- IRR
- -14.7%
- Equity multiple
- -0.15×
- Total profit
- $-202,436
- Equity at exit
- $128,960
Cash invested: $175,749 (down + closing). Projections, not guarantees.
Landlord ↔ Tenant lean methodology
- Overall (STATE)
- 87 Strongly Landlord-Friendly
- State Florida
- 87 Strongly Landlord-Friendly · R+3
- County
- — inherits STATE
- City
- — inherits STATE
ZIP-level market 34637
- Home prices YoY
- -1.2%
- Active inventory
- 287
- Price-to-rent
- 9.6×
Monthly cashflow live
- Estimated rent
- $3,948 medium interval (Pro) →
- Mortgage (P&I)
- −$3,292
- Tax est. 1.5%
- −$785 /mo · $9,415/yr
- Insurance
- −$262
- Flood insurance flood zone
- −$125 /mo · $1,502/yr
- HOA
- −$0
- Vacancy / Maint / Mgmt
- −$829
- Net cashflow
- $-1,344
Break-even live
Sensitivity live
| Price | -10% $-910 | -5% $-1,127 | +0% $-1,344 | +5% $-1,561 | +10% $-1,778 |
|---|---|---|---|---|---|
| Rent | -10% $-1,656 | -5% $-1,500 | +0% $-1,344 | +5% $-1,188 | +10% $-1,032 |
| Rate | -1.0pp $-1,028 | -0.5pp $-1,184 | base $-1,344 | +0.5pp $-1,507 | +1.0pp $-1,672 |
UW: 25.0% down · 7.5% · 30yr · 1.5% tax · 5.0% vac · 8.0% maint · 8.0% mgmt
Financing live
Cash to close
- Down payment
- $156,919
- Closing costs
- $18,830
- Reserves months
- —
- Total cash needed
- —
Loan-product check · same deal, 3 products live
Conventional
25% down · 7.5% · 30yr
- Down + closing
- —
- Monthly P&I
- —
- Monthly cashflow
- —
- DSCR
- —
- Eligible?
- —
Personal DTI + credit; lowest rate.
DSCR
20% down · 8.5% · 30yr
- Down + closing
- —
- Monthly P&I
- —
- Monthly cashflow
- —
- DSCR
- —
- Eligible?
- —
No personal income docs; deal must DSCR.
Hard money
10% down · 12.0% · 12mo
- Down + closing
- —
- Monthly P&I
- —
- Monthly cashflow
- —
- DSCR
- —
- Eligible?
- —
Short-term bridge; refi at stabilization.
Rent comps 1 comps
| Address | Beds | Baths | Sqft | Rent | $/sqft | DOM | Units | Dist |
|---|---|---|---|---|---|---|---|---|
| 20411 Lace Cascade Rd Land O Lakes, FL | 5.0 | 3.5 | 4359 | $5,400 | $1.24 | 26d | 1 | 0.38mi |
Listing history 16 events
-
2026-06-18days on market $453,690 Active 391 DOM
-
2026-06-18price $453,690 Active 390 DOM
-
2026-06-17days on market $453,190 Active 390 DOM
-
2026-06-16days on market $453,190 Active 389 DOM
-
2026-06-15price $453,190 Active 388 DOM
-
2026-06-15days on market $452,690 Active 388 DOM
-
2026-06-13pricedays on market $452,690 Active 386 DOM
-
2026-06-09days on market $452,190 Active 382 DOM
-
2026-06-08pricedays on market $452,190 Active 381 DOM
-
2026-06-08price $451,690 Active 380 DOM
-
2026-06-07days on market $451,190 Active 380 DOM
-
2026-06-04days on market $451,190 Active 377 DOM
-
2026-06-03days on market $451,190 Active 376 DOM
-
2026-06-02days on market $451,190 Active 375 DOM
-
2026-06-01days on market $451,190 Active 374 DOM
-
2026-05-31days on market $451,190 Active 373 DOM
ⓘ Source: listings_history table (triggers on properties + properties_extension) + one-shot
backfill from property_details.listing_events for pre-trigger history.
Climate risk First Street
- Flood 1/10 Low FEMA zone A · 0% chance over 30 yrs
- Wildfire 6/10 Major
- Heat 10/10 Extreme 7 d/yr ≥109°F today · 27 d/yr by 30 yrs out
- Wind 9/10 Extreme 99% chance of damaging wind over 30 yrs
- Air quality 2/10 Low 1 unhealthy d/yr today · 1 by 30 yrs out
Nearby sold comps map
Loading sold comps map…
Walkable amenities ~0.75 mi
Loading nearby amenities…
Taxation est. · year 1
- Rental income
- $47,378
- − Mortgage interest
- −$35,160
- − Property taxes
- −$9,415
- − Insurance
- −$4,641
- − Repairs & maintenance
- −$3,790
- − Management
- −$3,790
- − Depreciation
- −$18,260
- Taxable loss
- −$27,678
- Est. tax savings @ 24.0%
- +$6,643
- After-tax cash flow
- $-9,484/yr
For passive investors: Depreciation is non-cash, so a rental often shows a tax loss while cash-flowing — sheltering income. Rental losses are passive: they offset passive income freely, and up to $25,000/yr can offset ordinary (W-2) income if you actively participate and your MAGI is under $100k (phasing out to $0 by $150k); unused losses carry forward. On sale, claimed depreciation is recaptured at up to 25%, and gains may owe capital-gains tax (a 1031 exchange can defer both). Figures are a year-1 estimate at your 24.0% rate — not tax advice; consult a CPA.
Schools (NCES district)
- District
- Pasco
- NCES district ID
- 1201530
- Math proficiency
- 50% ▼ -10.00%
- Reading proficiency
- 52% ▼ -5.00%
- Median HH income
- $45,039
- Composite
- 43.14/100
- National rank
- #3074
- State rank
- #32 of 73 in FL
Livability — Connerton
- Score
- 66/100
- State rank
- #596
- US rank
- #11437
Category grades
Schools grade is shown separately in the Schools card above.
Census & demographics
- Census place
- Connerton, FL
- County
- Pasco County · 524,098 people
- City population
- 11,398
- Metro
- Tampa-St. Petersburg-Clearwater, FL
- Population (ZIP)
- 13,049
- Household income
- $115,214
- Rent vs Own
- Severe rent burden
- 96.0
Population outlook (Pasco County) Hauer SSP2
- Today (2025)
- 570,045 people
- By 2030
- 605,844 · +6.3%
- By 2040
- 674,806 · +18.4%
- By 2050
- 736,022 · +29.1%
- By 2075
- 862,900 · +51.4%
- By 2100
- 906,364 · +59.0%
Race, ethnicity, and origin ACS 2023
- Neighborhood character
- Predominantly White (70%)
- Race & ethnicity
- White 70% Hispanic / Latino 16% Two or more races 10% Black 7% Asian 5%
- Hispanic origin (detail)
- Mexican 1% Puerto Rican 10% Cuban 1%
- Common ancestry
- Romanian 5% Italian 3% Iranian 2%
- Foreign-born
- 8% · Canada
- Languages at home
- 85% English-only · Spanish 8% Other Indo-European 4% Tagalog/Filipino 1%
Political lean MEDSL · Pasco
- 2024 margin
- Strong R (+25.2) · D 36.9% · R 62.1% · Other 1.0%
- 2008→2024 swing
- -21.6pp toward R · 2008: -3.6pp · 2024: -25.2pp
- All cycles
- 2024: R+25.2 2020: R+20.1 2016: R+21.6 2012: R+6.7 2008: R+3.6
Not yet ingested
- Civics
- —
Market trends
- HPI YoY
- ▼ -1.54%
- Current HPI
- 126.1415
- Rent YoY
- —
- Metro
- Tampa-St. Petersburg-Clearwater, FL
- State GDP YoY
- ▲ 3.28%
- F500 in state
- 36
Industry mix (Fortune 500 HQ in FL)
| Industry | F500 HQs | Revenue |
|---|---|---|
| Industrial Technology | 2 | $29B |
|
||
| Insurance | 2 | $17B |
|
||
| Retail | 1 | $60B |
|
||
| Technology Distribution | 1 | $58B |
|
||
| Homebuilding | 1 | $35B |
|
||
| Technology Manufacturing | 1 | $35B |
|
||
Cash-flow waterfall
monthlySold comps — $/sqft
last 12 mo · ≤1 miLoading sold comps…