7380 Clunie Pl #13006 · Boca Raton, FL
Flood risk No data
- FEMA flood zone
- —
- Chance of flooding over 30 yrs
- —
- Est. flood insurance / yr
- —
Fire risk No data
- Est. fire insurance / yr
- —
Heat risk No data
- Hot days now (above threshold)
- —
- Hot days in 30 yrs
- —
Wind risk No data
- Chance of severe wind over 30 yrs
- —
Air-quality risk No data
- Unhealthy air days now
- —
- Unhealthy air days in 30 yrs
- —
Risk factors via First Street. Map © Google.
Why this score? — see what drove the C+ grade
The composite is a weighted blend of 9 inputs, each scored 0–100. Each bar is that input's sub-score; the figure is the points it added to the 100-point composite (weight × sub-score).
- Cash flow +21.8/30.0
- 1% rule +7.7/10.0
- ARV discount +7.5/15.0
- DSCR +7.0/10.0
- Appreciation +5.3/10.0
- Schools +4.3/10.0
- Livability +3.9/5.0
- Rent growth +2.6/5.0
- Condition / age +2.5/5.0
$349,900
🖨 Deal sheet 📄 Offer letter ✓ Due diligence
Listing remarks MLS
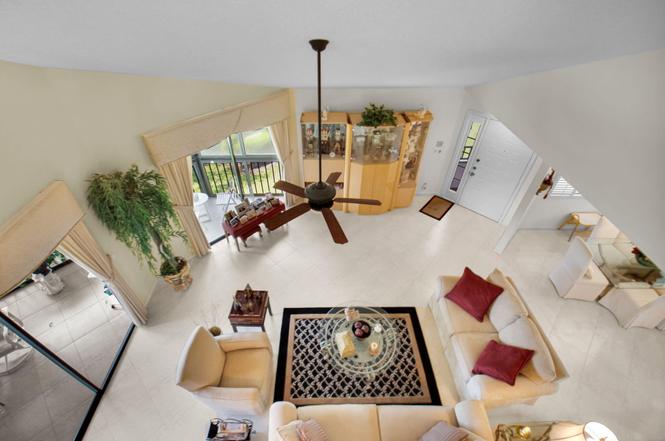
GREAT BEN HOGAN 3 BEDROOM/3 BATH IN NEWEST SECTION. WALK TO CLUB AND ATLANTIC. NEW AC AND NEW CARPET. MUST SEE!
Key facts
- Pickleball courts
- Tennis courts
- Golf course views
Tags
Neighborhood map
What this means for you Summary
Snapshot
- This is a 3-bed/3.0-bath condo listed at $350k.
Deal economics
- At list price, monthly cash flow is $543 ($7k/yr) — positive.
- The deal already cash-flows at list — no discount required.
- Meets the 1% rule at list price ($4k rent vs $350k).
- Cap rate 8.2% vs local median 2.8% in Boca Raton — top-decile yield for the area; either an underpriced asset or a hidden risk that comps aren't pricing in. Stress-test before assuming the spread holds.
Location & tenants
- Location reads 77/100 on livability (#192 in FL, #3,070 nationally) — a middle-class / working-renter tenant base. Strengths: employment A+, health & safety A+, crime B+; Watch: amenities D, cost of living F.
- Palm Beach (suburban): math 46% / reading 53% proficiency, ranked #34 of 73 in FL (top 47%) — families likely to look elsewhere, expect single-tenant / working-renter base with shorter leases.
- Zoned schools: Orchard View Elementary School (math 48% / reading 47%, grade D, #1,182 of 2,144 statewide, top 55%, 596 students, 76% FRL); Spanish River Community High School (math 64% / reading 74%, grade B, #63 of 667 statewide, top 10%, 2,578 students, 25% FRL) — zoned schools at 50% FRL track the district average.
- Market conditions: Rents flat; 577 active listings in the ZIP; 21 comparable units currently listed for rent nearby; rentals at typical pace (median 21d on market — plan ~3-4 weeks tenant-placement turnaround); solid renter incomes; 3,974 units permitted in Palm Beach County in 2024 (1,012 in 5+ unit buildings).
- At $4,440/mo this rent would consume 66% of the median local household income ($80k/yr) (locally 494% of renters already pay >50% of income on rent) — very limited rent-growth headroom before tenants either downsize or default.
Forward outlook
- In year one you build about $5k of equity ($2k loan paydown + $2k appreciation (0.7% local appreciation)).
- Palm Beach County population projected at +30% by 2050 — long-run rental-demand tailwind backs the buy-and-hold thesis.
- At projected returns (0.7% appreciation + 0.5% rent growth), your $98k cash investment doubles in ~9 years — after that, you're playing with house money.
- By year 7, paydown + projected appreciation supports a ~$34k cash-out refi (75% LTV) — recoverable capital for the next deal without selling this one.
Negotiation context
- Only 12 days on market — expect competitive offers; lowballing is unlikely to land.
- 3 sale attempts since 20y ago with the ask held roughly flat each time — persistent listings suggest the price (not the market) is what's stuck; bring a comps-based counter.
- Current owner paid $300k; 17% above their basis — modest negotiation headroom, anchor on the comps not their cost.
Questions for the listing agent
- What does the HOA fee cover, when was the last increase, and are there any pending special assessments or reserve-fund shortfalls?
- Any open or pending special assessments — roof, HVAC, plumbing, elevator, façade? What's the per-unit balance and payoff schedule, and is the seller paying it off at close or rolling it to the buyer?
- Is there a deadline driving the sale (1031 exchange, divorce, estate, relocation)? That informs how much negotiation room exists.
- Schools are A-rated — typically a magnet for longer-tenancy family renters. What's the average tenant stay here, and is there a school-zone premium baked into asking?
- What's the average days-on-market for RENTAL listings here right now (not sales)? A rising rental-DOM trend means longer vacancies and softer asking-rent achievability than the comps imply.
- What's the recent tenant-quality profile in this submarket — average credit score on applications, eviction rate, late-payment / NSF rate, and stable-employment percentage? A property-management company in the area should have these aggregated.
- How much new apartment / multifamily construction is in the pipeline within 1–3 miles? Heavy new supply (>2% of stock underway) typically softens rents 12–24 months out; light construction supports rent growth.
Investment metrics
- 1% rule
- 1.27% ✓
- Cap rate
- 8.16%
- Cash-on-cash
- 6.66%
- DSCR
- 1.30
- GRM
- 6.6
CMA / ARV
No comps found within radius.
Projected returns pro-forma
0.69% appreciation · 0.51% rent growth · sell at horizon
- IRR
- 5.3%
- Equity multiple
- 1.26×
- Total profit
- $25,378
- Equity at exit
- $113,782
- IRR
- 8.0%
- Equity multiple
- 1.87×
- Total profit
- $85,164
- Equity at exit
- $146,916
Cash invested: $97,972 (down + closing). Projections, not guarantees.
Landlord ↔ Tenant lean methodology
- Overall (STATE)
- 87 Strongly Landlord-Friendly
- State Florida
- 87 Strongly Landlord-Friendly · R+3
- County
- — inherits STATE
- City
- — inherits STATE
ZIP-level market 33446
- Home prices YoY
- 0.3%
- Rents YoY
- 0.5%
- Active inventory
- 577
- Price-to-rent
- 6.6×
Monthly cashflow live
- Estimated rent
- $4,440 high interval (Pro) →
- Mortgage (P&I)
- −$1,835
- Tax from tax record
- −$263 /mo · $3,154/yr
- Insurance
- −$146
- HOA
- −$721
- Vacancy / Maint / Mgmt
- −$933
- Net cashflow
- $543
Break-even live
UW: 25.0% down · 7.5% · 30yr · 1.5% tax · 5.0% vac · 8.0% maint · 8.0% mgmt
Financing live
Cash to close
- Down payment
- $87,475
- Closing costs
- $10,497
- Reserves months
- —
- Total cash needed
- —
Loan-product check · same deal, 3 products live
Conventional
25% down · 7.5% · 30yr
- Down + closing
- —
- Monthly P&I
- —
- Monthly cashflow
- —
- DSCR
- —
- Eligible?
- —
Personal DTI + credit; lowest rate.
DSCR
20% down · 8.5% · 30yr
- Down + closing
- —
- Monthly P&I
- —
- Monthly cashflow
- —
- DSCR
- —
- Eligible?
- —
No personal income docs; deal must DSCR.
Hard money
10% down · 12.0% · 12mo
- Down + closing
- —
- Monthly P&I
- —
- Monthly cashflow
- —
- DSCR
- —
- Eligible?
- —
Short-term bridge; refi at stabilization.
Rent comps 21 comps
| Address | Beds | Baths | Sqft | Rent | $/sqft | DOM | Units | Dist |
|---|---|---|---|---|---|---|---|---|
| 15694 Loch Maree Ln #5903 Delray Beach, FL | 2.0 | 2.0 | 1705 | $9,000 | $5.28 | 15d | 1 | 0.33mi |
| 15711 Loch Maree Ln #4702 Delray Beach, FL | 2.0 | 2.0 | 1688 | $10,000 | $5.92 | 24d | 1 | 0.39mi |
| 15845 Vivanco St Delray Beach, FL | 3.0 | 2.5 | 2149 | $4,000 | $1.86 | 24d | 1 | 0.40mi |
| 15426 Fiorenza Cir Delray Beach, FL | 2.0 | 2.0 | 1883 | $3,750 | $1.99 | 8d | 1 | 0.41mi |
| 15323 Fiorenza Cir Delray Beach, FL | 2.0 | 2.0 | 2057 | $6,000 | $2.92 | 24d | 1 | 0.41mi |
| 16032 Lomond Hills Trl #152 Delray Beach, FL | 2.0 | 2.0 | 1415 | $10,000 | $7.07 | 21d | 1 | 0.42mi |
| 7512 Eagle Point Dr Delray Beach, FL | 3.0 | 2.0 | 1463 | $4,000 | $2.73 | 4d | 1 | 0.64mi |
| 7512 Eagle Point Dr Unit 7512 Delray Beach, FL | 3.0 | 2.0 | 1463 | $4,000 | $2.73 | 19d | 1 | 0.64mi |
| 7657 Lexington Club Blvd Delray Beach, FL | 3.0 | 2.0 | 1645 | $4,500 | $2.74 | 24d | 1 | 0.66mi |
| 15018 Three Ponds Trl Delray Beach, FL | 3.0 | 2.0 | 1703 | $4,150 | $2.44 | 12d | 1 | 0.99mi |
| 15018 Three Ponds Trl Delray Beach, FL | 3.0 | 2.0 | 1703 | $4,150 | $2.44 | 24d | 1 | 0.99mi |
| 14856 Barletta Way Delray Beach, FL | 2.0 | 2.0 | 1406 | $3,200 | $2.28 | 24d | 1 | 1.15mi |
| 16089 Poppyseed Cir #2006 Delray Beach, FL | 3.0 | 2.5 | 1652 | $3,200 | $1.94 | 24d | 1 | 1.25mi |
| 14624 Three Ponds Trl Delray Beach, FL | 3.0 | 2.0 | 1411 | $3,250 | $2.30 | 18d | 1 | 1.30mi |
| 6197 Caladium Rd Delray Beach, FL | 2.0 | 2.0 | 1427 | $4,000 | $2.80 | 24d | 1 | 1.31mi |
| 16129 Poppyseed Cir #1603 Delray Beach, FL | 3.0 | 2.5 | 1652 | $3,250 | $1.97 | 3d | 1 | 1.35mi |
| 16129 Poppyseed Cir #1603 Delray Beach, FL | 3.0 | 2.5 | 1652 | $3,350 | $2.03 | 21d | 1 | 1.35mi |
| 6077 Lake Hibiscus Dr Unit 6077 Delray Beach, FL | 3.0 | 2.0 | 1570 | $3,200 | $2.04 | 19d | 1 | 1.45mi |
| 6550 Country Wood Way Delray Beach, FL | 3.0 | 2.0 | 1408 | $4,000 | $2.84 | 24d | 1 | 1.46mi |
| 6550 Country Wood Way Delray Beach, FL | 3.0 | 2.0 | 1408 | $4,000 | $2.84 | 5d | 1 | 1.46mi |
| 6108 Petunia Rd Delray Beach, FL | 2.0 | 2.0 | 1532 | $4,500 | $2.94 | 24d | 1 | 1.46mi |
HOA detail condo
- Monthly dues
- $721 · $8,652/yr
- Assessments
- None detected in remarks — confirm with the listing agent.
Listing history 10 events
-
2026-03-11status Pending
-
2026-03-08status Pending
-
2026-02-24$349,900 Active
-
2025-12-27historical $8,000
-
2025-05-25$8,000
-
2006-03-08soldstatus $300,000
-
2006-02-28soldstatus $300,000 111-char remark
Show marketing remark (111 chars)
GREAT BEN HOGAN 3 BEDROOM/3 BATH IN NEWEST SECTION. WALK TO CLUB AND ATLANTIC. NEW AC AND NEW CARPET. MUST SEE!
-
2006-02-01historical 111-char remark
Show marketing remark (111 chars)
GREAT BEN HOGAN 3 BEDROOM/3 BATH IN NEWEST SECTION. WALK TO CLUB AND ATLANTIC. NEW AC AND NEW CARPET. MUST SEE!
-
2006-01-03$325,000 111-char remark
Show marketing remark (111 chars)
GREAT BEN HOGAN 3 BEDROOM/3 BATH IN NEWEST SECTION. WALK TO CLUB AND ATLANTIC. NEW AC AND NEW CARPET. MUST SEE!
-
1997-08-01soldstatus $142,000
ⓘ Source: listings_history table (triggers on properties + properties_extension) + one-shot
backfill from property_details.listing_events for pre-trigger history.
Tax reassessment forecast FL · Resets to sale price
- Current annual tax
- $3,154 · $263/mo
- Projected year-2 tax
- $3,154 · $263/mo
- Expected delta
- $0/yr ($0/mo · 0.0%)
ⓘ Screening estimate from a state-policy table — verify with the county assessor before closing.
Nearby sold comps map
Loading sold comps map…
Walkable amenities ~0.75 mi
Loading nearby amenities…
Taxation est. · year 1
- Rental income
- $53,286
- − Mortgage interest
- −$19,600
- − Property taxes
- −$3,154
- − Insurance
- −$1,750
- − Repairs & maintenance
- −$4,263
- − Management
- −$4,263
- − HOA
- −$8,652
- − Depreciation
- −$10,179
- Taxable income
- $1,426
- Est. tax owed @ 24.0%
- −$342
- After-tax cash flow
- $6,180/yr
For passive investors: Depreciation is non-cash, so a rental often shows a tax loss while cash-flowing — sheltering income. Rental losses are passive: they offset passive income freely, and up to $25,000/yr can offset ordinary (W-2) income if you actively participate and your MAGI is under $100k (phasing out to $0 by $150k); unused losses carry forward. On sale, claimed depreciation is recaptured at up to 25%, and gains may owe capital-gains tax (a 1031 exchange can defer both). Figures are a year-1 estimate at your 24.0% rate — not tax advice; consult a CPA.
Schools (NCES district)
- District
- Palm Beach
- NCES district ID
- 1201500
- Math proficiency
- 46% ▼ -16.00%
- Reading proficiency
- 53% ▼ -4.00%
- Median HH income
- $53,943
- Composite
- 42.72/100
- National rank
- #3160
- State rank
- #34 of 73 in FL
Livability — Boca Raton
- Score
- 77/100
- State rank
- #192
- US rank
- #3070
Category grades
Schools grade is shown separately in the Schools card above.
Census & demographics
- County
- Palm Beach County · 1,438,312 people
- City population
- 123,167
- Metro
- Miami-Fort Lauderdale-Pompano Beach, FL
- Population (ZIP)
- 28,431
- Household income
- $80,187
- Rent vs Own
- Severe rent burden
- 494.0
Population outlook (Palm Beach County) Hauer SSP2
- Today (2025)
- 1,637,487 people
- By 2030
- 1,743,255 · +6.5%
- By 2040
- 1,948,712 · +19.0%
- By 2050
- 2,132,979 · +30.3%
- By 2075
- 2,530,027 · +54.5%
- By 2100
- 2,706,979 · +65.3%
Race, ethnicity, and origin ACS 2023
- Neighborhood character
- Predominantly White (79%)
- Race & ethnicity
- White 79% Hispanic / Latino 13% Two or more races 9% Black 4%
- Hispanic origin (detail)
- Puerto Rican 3% Dominican 1%
- Common ancestry
- Romanian 9% Scotch-Irish 9% Italian 2%
- Foreign-born
- 20% · Canada, Jamaica, Guatemala
- Languages at home
- 80% English-only · Spanish 12% Other Indo-European 2% French/Haitian/Cajun 2%
Political lean MEDSL · Palm Beach
- 2024 margin
- Toss-up / Even · D 50.0% · R 49.2%
- 2008→2024 swing
- -22.1pp toward R · 2008: 22.9pp · 2024: 0.8pp
- All cycles
- 2024: D+0.8 2020: D+12.8 2016: D+15.3 2012: D+17.0 2008: D+22.9
Not yet ingested
- Civics
- —
Market trends
- HPI YoY
- ▲ 0.69%
- Current HPI
- 242.5138
- Rent YoY
- ▲ 0.51%
- Metro
- Miami-Fort Lauderdale-Pompano Beach, FL
- State GDP YoY
- ▲ 3.28%
- F500 in state
- 36
Industry mix (Fortune 500 HQ in FL)
| Industry | F500 HQs | Revenue |
|---|---|---|
| Industrial Technology | 2 | $29B |
|
||
| Insurance | 2 | $17B |
|
||
| Retail | 1 | $60B |
|
||
| Technology Distribution | 1 | $58B |
|
||
| Homebuilding | 1 | $35B |
|
||
| Technology Manufacturing | 1 | $35B |
|
||
Price history
+146.4% since first listed10 events — show timeline
- 2026-03-11 Pending — Beaches MLS
- 2026-03-08 Pending — Beaches MLS
- 2026-02-24 Listed $349,900 Beaches MLS
- 2025-12-27 Rental Removed $8,000 RMLSFL
- 2025-05-25 Listed for Rent $8,000 RMLSFL
- 2006-03-08 Sold (Public Records) $300,000 Public Records
- 2006-02-28 Sold (MLS) $300,000 Beaches MLS
- 2006-02-01 Listing Removed — Beaches MLS
- 2006-01-03 Listed $325,000 Beaches MLS
- 1997-08-01 Sold (Public Records) $142,000 Public Records
Property tax history
-0.4%/yrLatest (2025): $3,154 · -1.3% YoY. Source: county tax records.
Cash-flow waterfall
monthlySold comps — $/sqft
last 12 mo · ≤1 miLoading sold comps…