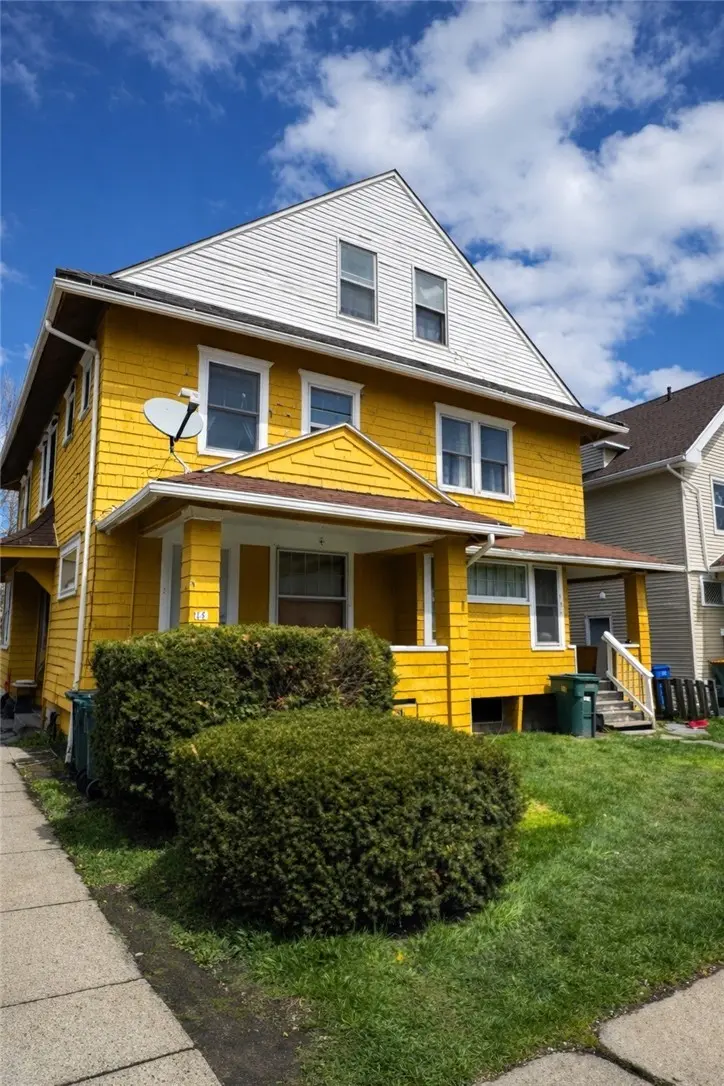
156 Clay Ave · Rochester, NY
Flood risk 1/10 · Minimal
- FEMA flood zone
- X (unshaded)
- Chance of flooding over 30 yrs
- 0.0%
- Est. flood insurance / yr
- $473 – $860
Fire risk 4/10 · Minor
- Est. fire insurance / yr
- $691 – $1,283
Heat risk 2/10 · Minimal
- Hot days now (above 96°F)
- 7 days/yr
- Hot days in 30 yrs
- 15 days/yr
Wind risk 1/10 · Minimal
- Chance of severe wind over 30 yrs
- —
Air-quality risk 2/10 · Minimal
- Unhealthy air days now
- 1 days/yr
- Unhealthy air days in 30 yrs
- 2 days/yr
Risk factors via First Street. Map © Google.
Why this score? — see what drove the B grade
The composite is a weighted blend of 9 inputs, each scored 0–100. Each bar is that input's sub-score; the figure is the points it added to the 100-point composite (weight × sub-score).
- Cash flow +28.2/30.0
- ARV discount +15.0/15.0
- DSCR +10.0/10.0
- 1% rule +7.8/10.0
- Livability +3.8/5.0
- Rent growth +2.5/5.0
- Appreciation +2.2/10.0
- Condition / age +2.2/5.0
- Schools +1.9/10.0
$134,900
🖨 Deal sheet 📄 Offer letter ✓ Due diligence
Listing remarks
CASH-FLOWING SIDE-BY-SIDE DUPLEX with a cap rate exceeding 10% as currently operated, plus additional upside potential. Both units are fully occupied, making this a strong addition to any investment portfolio from day one. Each unit offers 3 bedrooms and 1 full bathroom, with spacious layouts contributing to a total of 2,896 square feet. The property is separately metered and features individual basements with laundry hookups and ample storage, along with full attic spaces for even more flexibility. A brand new Certificate of Occupancy will be provided prior to closing, offering added confidence and a smooth transition for the next owner. Located in Rochester’s Maplewood district, the
Key facts
- Side-by-side duplex
- Individual basements
- Separately metered
Tags
Property features AI
Finance
- Other: Two separate rent units with current rents of $1,109 and $1,089; Leases: one expires Aug 1, 2025; the other expires Jun 30, 2026
- Financial info: Gross income listed as $26,376; Owner pays trash collection and water; Rent includes trash collection and water; Operating expenses include insurance and professional management
Exterior
- Parking: Paved parking with two or more spaces
- Utilities: Public water connected; Sewer connected; Circuit breaker electric
- Home design: Two-story multi-family (2 units); Residential 2-unit zoning; Entry level information not specified; Facing direction not specified
- Construction: Vinyl siding; Wood siding; Copper plumbing; Asphalt shingle roof; Block foundation; Existing (not new) construction
- Exterior features: Balcony; Near public transit; Rectangular residential lot; City street frontage
Interior
- Kitchen: Gas water heater
- Bedrooms: Two 3-bedroom units
- Flooring: Carpet; Hardwood; Laminate; Luxury vinyl; Varies
- Bathrooms: Two full bathrooms (one per unit)
- Heating & cooling: Gas forced-air heating
- Interior features: Natural woodwork; Full basement
- Laundry & utility: Separate gas meters (2); Separate electric meters (2)
Neighborhood map
What this means for you Summary
Snapshot
- This is a 6-bed/2.0-bath townhouse listed at $135k. Condition is rated fair.
Deal economics
- At list price, monthly cash flow is $427 ($5k/yr) — positive.
- The deal already cash-flows at list — no discount required.
- Meets the 1% rule at list price ($2k rent vs $135k).
Location & tenants
- Location reads 76/100 on livability (#222 in NY, #3,482 nationally) — a middle-class / working-renter tenant base. Strengths: commute A+, cost of living A+, housing A+; Watch: schools D+, crime F, employment F.
- Rochester City School District (urban): math 21% / reading 26% proficiency, ranked #589 of 590 in NY (top 100%) — low school quality limits family demand, transient renter base, plan for 1-2y turnover; 82% free/reduced lunch — lower-income household profile, screen leases tightly.
- Market conditions: 71 active listings in the ZIP; 1,169 units permitted in Monroe County in 2024 (591 in 5+ unit buildings).
Forward outlook
- Local home prices are declining (-3.0%/yr); year-one equity from $933 of loan paydown is wiped out by about $4k of value loss. Plan a longer hold.
- Monroe County population projected to shrink 6% by 2050 — rents likely to lag national; underwrite the cash flow, not the appreciation.
- At projected returns (-3.0% appreciation + 3.0% rent growth), your $38k cash investment doubles in ~9 years — after that, you're playing with house money.
Negotiation context
- Only 11 days on market — expect competitive offers; lowballing is unlikely to land.
Risks & watch-outs
- Watch-outs: built in 1920 — expect roof / HVAC / electrical / plumbing capex.
Questions for the listing agent
- Have any recent inspections been done? Can we get a copy of the seller's disclosures and any deferred-maintenance estimates?
- Built in 1920 — when were the roof, HVAC, electrical panel, plumbing, and water heater last replaced?
- Is there a deadline driving the sale (1031 exchange, divorce, estate, relocation)? That informs how much negotiation room exists.
- Schools are D-rated, which usually means shorter tenancies and higher turnover. Who's the typical renter profile here, and what's been the actual vacancy rate?
- Crime grade is F in this area — have there been break-ins, vandalism, or insurance claims at this property in the last 3 years? What carrier currently insures it and at what premium?
- What's the average days-on-market for RENTAL listings here right now (not sales)? A rising rental-DOM trend means longer vacancies and softer asking-rent achievability than the comps imply.
- What's the recent tenant-quality profile in this submarket — average credit score on applications, eviction rate, late-payment / NSF rate, and stable-employment percentage? A property-management company in the area should have these aggregated.
- How much new for-sale + rental construction is in the pipeline within 1–3 miles? Heavy new supply typically softens prices + rents 12–24 months out; constrained supply supports both.
Investment metrics
- 1% rule
- 1.28% ✓
- Cap rate
- 10.09%
- Cash-on-cash
- 13.56%
- DSCR
- 1.60
- GRM
- 6.5
CMA / ARV
- ARV (on-the-fly)
- $165,072
- Comps found
- 11
Show comp detail 11 sales within ~0.75 mi
| Address | Dist | Beds/Ba | Sqft | Sold | Price | $/sf | Match |
|---|---|---|---|---|---|---|---|
| 115-117 Electric Ave #115 | 0.18mi | 6/2.0 | 2,776 (-4%) | 13mo | $147,550 | $53 | 74 |
| 192-194 Magee Ave | 0.13mi | 5/3.0 (-1) | 2,582 (-11%) | 6mo | $170,000 | $66 | 62 |
| 1538 St Paul St | 0.71mi | 6/2.0 | 2,912 (+1%) | 10mo | $169,900 | $58 | 58 |
| 229 Pullman Ave | 0.29mi | 5/2.0 (-1) | 2,755 (-5%) | 20mo | $150,000 | $54 | 57 |
| 18-20 Bryan St | 0.53mi | 6/2.0 | 2,688 (-7%) | 12mo | $115,000 | $43 | 53 |
| 62 Raines Park | 0.53mi | 6/2.0 | 3,236 (+12%) | 8mo | $183,000 | $57 | 49 |
| 591-593 Magee Ave | 0.66mi | 6/2.0 | 2,463 (-15%) | 2mo | $148,300 | $60 | 43 |
| 96-98 Gorsline St | 0.38mi | 5/2.0 (-1) | 2,490 (-14%) | 13mo | $225,000 | $90 | 43 |
| 366 Augustine St | 0.53mi | 5/2.0 (-1) | 2,521 (-13%) | 8mo | $175,000 | $69 | 43 |
| 901 Lake Ave | 0.70mi | 5/3.0 (-1) | 2,624 (-9%) | 15mo | $108,000 | $41 | 30 |
| 222-224 Selye Ter | 0.72mi | 5/2.0 (-1) | 2,496 (-14%) | 13mo | $127,500 | $51 | 28 |
Match score weights: distance 35% · size 25% · config 20% · recency 20%. Top-matched comps best support the ARV.
Projected returns pro-forma
-3.0% appreciation · 3.0% rent growth · sell at horizon
- IRR
- 3.7%
- Equity multiple
- 1.14×
- Total profit
- $5,353
- Equity at exit
- $20,114
- IRR
- 13.2%
- Equity multiple
- 2.05×
- Total profit
- $39,775
- Equity at exit
- $11,664
Cash invested: $37,772 (down + closing). Projections, not guarantees.
Landlord ↔ Tenant lean methodology
- Overall (STATE)
- 15 Strongly Tenant-Friendly
- State New York
- 15 Strongly Tenant-Friendly · D+10
- County
- — inherits STATE
- City
- — inherits STATE
ZIP-level market 14613
- Home prices YoY
- -2.0%
- Active inventory
- 71
- Price-to-rent
- 6.5×
Monthly cashflow live
- Estimated rent
- $1,720 medium interval (Pro) →
- Mortgage (P&I)
- −$707
- Tax est. 1.5%
- −$169 /mo · $2,024/yr
- Insurance
- −$56
- HOA
- −$0
- Vacancy / Maint / Mgmt
- −$361
- Net cashflow
- $427
Break-even live
UW: 25.0% down · 7.5% · 30yr · 1.5% tax · 5.0% vac · 8.0% maint · 8.0% mgmt
Financing live
Cash to close
- Down payment
- $33,725
- Closing costs
- $4,047
- Reserves months
- —
- Total cash needed
- —
Loan-product check · same deal, 3 products live
Conventional
25% down · 7.5% · 30yr
- Down + closing
- —
- Monthly P&I
- —
- Monthly cashflow
- —
- DSCR
- —
- Eligible?
- —
Personal DTI + credit; lowest rate.
DSCR
20% down · 8.5% · 30yr
- Down + closing
- —
- Monthly P&I
- —
- Monthly cashflow
- —
- DSCR
- —
- Eligible?
- —
No personal income docs; deal must DSCR.
Hard money
10% down · 12.0% · 12mo
- Down + closing
- —
- Monthly P&I
- —
- Monthly cashflow
- —
- DSCR
- —
- Eligible?
- —
Short-term bridge; refi at stabilization.
Listing history 2 events
-
2026-05-01status Pending
-
2026-04-20$134,900 Active
ⓘ Source: listings_history table (triggers on properties + properties_extension) + one-shot
backfill from property_details.listing_events for pre-trigger history.
Climate risk First Street
- Flood 1/10 Low FEMA zone X (unshaded) · 0% chance over 30 yrs
- Wildfire 4/10 Moderate
- Heat 2/10 Low 7 d/yr ≥96°F today · 15 d/yr by 30 yrs out
- Wind 1/10 Low
- Air quality 2/10 Low 1 unhealthy d/yr today · 2 by 30 yrs out
Nearby sold comps map
Loading sold comps map…
Walkable amenities ~0.75 mi
Loading nearby amenities…
Taxation est. · year 1
- Rental income
- $20,645
- − Mortgage interest
- −$7,556
- − Property taxes
- −$2,024
- − Insurance
- −$674
- − Repairs & maintenance
- −$1,652
- − Management
- −$1,652
- − Depreciation
- −$3,924
- Taxable income
- $3,163
- Est. tax owed @ 24.0%
- −$759
- After-tax cash flow
- $4,363/yr
For passive investors: Depreciation is non-cash, so a rental often shows a tax loss while cash-flowing — sheltering income. Rental losses are passive: they offset passive income freely, and up to $25,000/yr can offset ordinary (W-2) income if you actively participate and your MAGI is under $100k (phasing out to $0 by $150k); unused losses carry forward. On sale, claimed depreciation is recaptured at up to 25%, and gains may owe capital-gains tax (a 1031 exchange can defer both). Figures are a year-1 estimate at your 24.0% rate — not tax advice; consult a CPA.
Condition & rehab AI · 2 photos
This townhouse requires extensive repairs and maintenance, including a new roof, siding, landscaping, and fencing. Significant updates would be needed to improve its condition and increase its resale and rental value.
Repairs flagged
- Major roof — Signs of wear and potential leaks.
- Major siding — Visible signs of wear and discoloration.
- Major landscaping — Sparse and in need of maintenance.
- Major fencing — In poor condition and may need repair or replacement.
- Major interior — Likely in a similar state of disrepair as the exterior based on the exterior condition.
Value-add opportunities
- Both roof replacement — A new roof would significantly improve the home's appearance and functionality.
- Both siding repair/replacement — New siding would enhance the home's curb appeal and increase its value.
- Both landscaping and fencing repair — A well-maintained exterior would attract more potential buyers and renters.
- Both interior repairs and updates — A fresh interior would make the home more attractive and increase its value for both resale and rental purposes.
Renovation cost estimate screening
| Repair item | Severity | Est. cost |
|---|---|---|
| roof · Signs of wear and potential leaks. | Major | $15,000–50,000 |
| siding · Visible signs of wear and discoloration. | Major | $15,000–50,000 |
| landscaping · Sparse and in need of maintenance. | Major | $15,000–50,000 |
| fencing · In poor condition and may need repair or replacement. | Major | $15,000–50,000 |
| interior · Likely in a similar state of disrepair as the exterior based on the exterior condition. | Major | $15,000–50,000 |
| Total estimated repair cost · 5 items | $75,000–250,000 |
Value-add ROI direction
- Both roof replacement — A new roof would significantly improve the home's appearance and functionality. ↑
- Both siding repair/replacement — New siding would enhance the home's curb appeal and increase its value. ↑
- Both landscaping and fencing repair — A well-maintained exterior would attract more potential buyers and renters. ↑
- Both interior repairs and updates — A fresh interior would make the home more attractive and increase its value for both resale and rental purposes. ↑
ⓘ Cost ranges are severity-bucket heuristics (US national rule-of-thumb). Get contractor quotes + a written scope before underwriting a rehab budget.
Schools (NCES district)
- District
- Rochester City School District
- NCES district ID
- 3624750
- Math proficiency
- 21% ▬ 0.00%
- Reading proficiency
- 26% ▲ 4.00%
- Median HH income
- $30,923
- Composite
- 18.98/100
- National rank
- #8850
- State rank
- #589 of 590 in NY
Livability — Rochester
- Score
- 76/100
- State rank
- #222
- US rank
- #3482
Category grades
Schools grade is shown separately in the Schools card above.
Census & demographics
- Census place
- Rochester, NY
- City population
- 432,803
- Population (ZIP)
- 14,740
Population outlook (Monroe County) Hauer SSP2
- Today (2025)
- 759,460 people
- By 2030
- 757,154 · -0.3%
- By 2040
- 740,644 · -2.5%
- By 2050
- 714,443 · -5.9%
- By 2075
- 645,883 · -15.0%
- By 2100
- 547,084 · -28.0%
Race, ethnicity, and origin ACS 2023
- Neighborhood character
- Highly diverse neighborhood (Simpson 0.70)
- Race & ethnicity
- Black 45% White 22% Hispanic / Latino 20% Two or more races 10% Asian 8% Pacific Islander 1%
- Hispanic origin (detail)
- Puerto Rican 16% Dominican 3%
- Common ancestry
- British 2% Serbian 1% Romanian 1%
- Foreign-born
- 13% · Canada, India, Philippines
- Languages at home
- 79% English-only · Spanish 12% Other Asian/Pacific 5% Other Indo-European 3%
Political lean MEDSL · Monroe
- 2024 margin
- D (+19.1) · D 59.5% · R 40.5%
- 2008→2024 swing
- +1.4pp toward D · 2008: 17.7pp · 2024: 19.1pp
- All cycles
- 2024: D+19.1 2020: D+21.0 2016: D+14.1 2012: D+17.4 2008: D+17.7
Not yet ingested
- Civics
- —
Market trends
- HPI YoY
- ▼ -5.56%
- Current HPI
- 274.2485
- Rent YoY
- —
- Metro
- —
- State GDP YoY
- ▲ 2.60%
- F500 in state
- 92
Industry mix (Fortune 500 HQ in NY)
| Industry | F500 HQs | Revenue |
|---|---|---|
| Financial Services | 10 | $950B |
|
||
| Consumer Goods | 9 | $162B |
|
||
| Insurance | 4 | $225B |
|
||
| Telecommunications | 2 | $144B |
|
||
| Pharmaceuticals | 2 | $112B |
|
||
| Media / Entertainment | 2 | $69B |
|
||
Price history
2 events — show timeline
- 2026-05-01 Pending — UNYREIS
- 2026-04-20 Listed $134,900 UNYREIS
Cash-flow waterfall
monthlySold comps — $/sqft
last 12 mo · ≤1 miLoading sold comps…