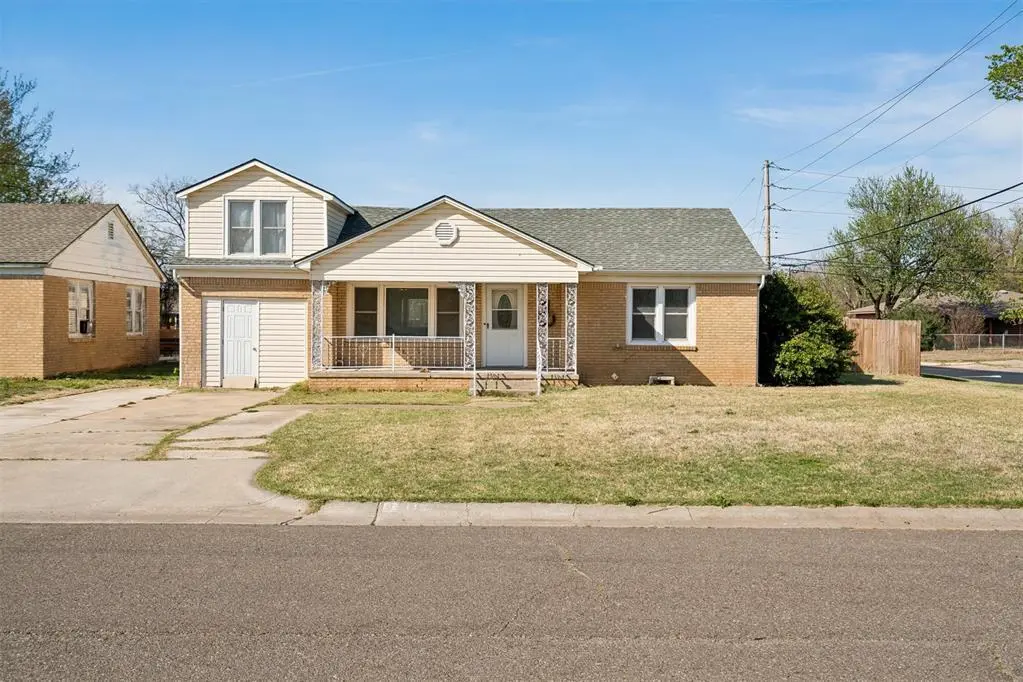
115 E Haddock St · Norman, OK
Flood risk 1/10 · Minimal
- FEMA flood zone
- X (unshaded)
- Chance of flooding over 30 yrs
- 0.0%
- Est. flood insurance / yr
- $507 – $1,088
Fire risk 1/10 · Minimal
- Est. fire insurance / yr
- $2,463 – $4,575
Heat risk 6/10 · Moderate
- Hot days now (above 108°F)
- 7 days/yr
- Hot days in 30 yrs
- 19 days/yr
Wind risk 2/10 · Minimal
- Chance of severe wind over 30 yrs
- 4.0%
Air-quality risk 2/10 · Minimal
- Unhealthy air days now
- 1 days/yr
- Unhealthy air days in 30 yrs
- 1 days/yr
Risk factors via First Street. Map © Google.
Why this score? — see what drove the D+ grade
The composite is a weighted blend of 9 inputs, each scored 0–100. Each bar is that input's sub-score; the figure is the points it added to the 100-point composite (weight × sub-score).
- ARV discount +15.0/15.0
- Cash flow +13.7/30.0
- Rent growth +4.4/5.0
- Livability +4.2/5.0
- DSCR +4.1/10.0
- 1% rule +3.2/10.0
- Schools +2.6/10.0
- Condition / age +2.5/5.0
- Appreciation +0.0/10.0
$199,900
🖨 Deal sheet (PDF) 📄 Offer letter ✓ Due diligence
Listing remarks
updated 1.5-story home offers 3 bedrooms and 1.5 bathrooms, combining modern upgrades with comfortable living space. Step inside to find brand new carpet, updated flooring, fresh paint, and new windows throughout. The home features two spacious living areas, perfect for entertaining, relaxing, or creating a separate family and media space. The completely updated kitchen is a standout, offering a fresh, modern feel and comes fully equipped with a refrigerator, dishwasher, stove, and microwave. The home also includes a convenient indoor utility room, with washer and dryer included.
Key facts
- Updated kitchen
- Updated flooring
- Indoor utility room
Tags
Property features AI
Finance
- Other: No storm shelter; Located in Tulls 1 addition
- Financial info: Seller offering as-is; financing options include Conventional, FHA, or VA; Loan qualification possible
- HOA & community: No mandatory association dues
Exterior
- Utilities: Cable available; Electricity available; Natural gas available; High-speed internet available; Public utilities
- Home design: Single family residence; One-and-one-half story; Residential, existing construction
- Construction: Brick construction; Composition roof; Combination foundation
- Exterior features: Open patio; Wood fencing; Corner lot
Interior
- Kitchen: Built-in electric range; Electric oven
- Bedrooms: 3 bedrooms
- Flooring: Carpet; Vinyl
- Bathrooms: 2 full bathrooms
- Interior features: Dishwasher; Disposal; Microwave; Refrigerator; Water heater
- Laundry & utility: Washer and dryer included
Neighborhood map
What this means for you Summary
Snapshot
- This is a 2-bed/1.5-bath single-family listed at $200k.
Deal economics
- At list price, monthly cash flow is $16 ($187/yr) — positive.
- The deal already cash-flows at list — no discount required.
- To meet the 1% rule (rent ≥ 1% of price), the offer needs to be $164k (18.1% below list).
- Recommended offer: $164k (18.1% below list) — sets the bar for 1% rule.
- Cap rate 6.4% vs local median 3.6% in Norman — top-decile yield for the area; either an underpriced asset or a hidden risk that comps aren't pricing in. Stress-test before assuming the spread holds.
Location & tenants
- Location reads 85/100 on livability (#1 in OK, #557 nationally) — a professional / high-income tenant draw. Strengths: amenities A+, commute A+, cost of living A+.
- Norman (suburban): math 27% / reading 32% proficiency, ranked #61 of 270 in OK (top 23%) — low school quality limits family demand, transient renter base, plan for 1-2y turnover.
- Zoned schools: Wilson Es (math 32% / reading 37%, grade F, #168 of 845 statewide, top 24%, 285 students, 0% FRL); Longfellow Ms (math 18% / reading 27%, grade F, #122 of 345 statewide, top 37%, 709 students, 0% FRL); Norman North Hs (math 45% / reading 57%, grade D+, #2 of 447 statewide, top 0%, 2,401 students, 0% FRL) — zoned schools average 0% FRL vs 39% district-wide (39 pts lower); this property's tenant base skews higher-income than the district average.
- Market conditions: Rents rising fast (+7.7%/yr); 253 active listings in the ZIP; 12 comparable units currently listed for rent nearby; rentals leasing fast (median 13d on market — plan ~1-2 weeks tenant-placement turnaround); 592 units permitted in Cleveland County in 2024 (12 in 5+ unit buildings).
- This rent runs 33% of the median local income ($59k/yr) — at the standard rent-burdened threshold; future hikes will face affordability resistance.
Forward outlook
- Local home prices are declining (-3.0%/yr); year-one equity from $1k of loan paydown is wiped out by about $6k of value loss. Plan a longer hold.
- Cleveland County population projected at +40% by 2050 — long-run rental-demand tailwind backs the buy-and-hold thesis.
Negotiation context
- It's been on market 82 days — a 6% lower offer ($188k) is reasonable based on typical stale-listing flexibility.
- Current owner paid $48k; list at $200k implies a 316% gain — meaningful room to come down on a strong offer.
Risks & watch-outs
- Watch-outs: built in 1950 — expect roof / HVAC / electrical / plumbing capex.
- Climate carrying-cost: extreme-heat days projected 7→19/yr by 2055 (HVAC capex compounding) — expect insurance premiums to compound above CPI over the hold.
Questions for the listing agent
- It's been on market 82 days. Have you received any prior offers? Is the seller open to a 18% concession, seller financing, or rate buy-down credit?
- Built in 1950 — when were the roof, HVAC, electrical panel, plumbing, and water heater last replaced?
- Why hasn't it sold? Are there any deal-killer items the seller is aware of (foundation, flood, title, zoning, code violations)?
- Is there a deadline driving the sale (1031 exchange, divorce, estate, relocation)? That informs how much negotiation room exists.
- The area grade is low — what's the realistic commute time and amenity access for the typical tenant pool here? Any planned neighborhood developments (good or bad) we should know about?
- What's the average days-on-market for RENTAL listings here right now (not sales)? A rising rental-DOM trend means longer vacancies and softer asking-rent achievability than the comps imply.
- What's the recent tenant-quality profile in this submarket — average credit score on applications, eviction rate, late-payment / NSF rate, and stable-employment percentage? A property-management company in the area should have these aggregated.
- How much new for-sale + rental construction is in the pipeline within 1–3 miles? Heavy new supply typically softens prices + rents 12–24 months out; constrained supply supports both.
Investment metrics
- 1% rule
- 0.82% ✗
- Cap rate
- 6.39%
- Cash-on-cash
- 0.33%
- DSCR
- 1.01
- GRM
- 10.2
CMA / ARV
- ARV (on-the-fly)
- $265,815
- Comps found
- 12
Show comp detail 12 sales within ~0.75 mi
| Address | Dist | Beds/Ba | Sqft | Sold | Price | $/sf | Match |
|---|---|---|---|---|---|---|---|
| 220 Telstar St | 0.27mi | 3/2.0 (+1) | 1,928 (-2%) | 7mo | $200,000 | $104 | 71 |
| 134 E Himes St | 0.35mi | 2/2.0 | 1,744 (-11%) | 0mo | $235,000 | $135 | 62 |
| 219 E Dale St | 0.16mi | 3/2.0 (+1) | 1,692 (-14%) | 1mo | $175,000 | $103 | 61 |
| 207 Americana Ct | 0.19mi | 3/2.0 (+1) | 2,166 (+10%) | 10mo | $207,500 | $96 | 60 |
| 131 W Hayes St | 0.26mi | 3/1.0 (+1) | 1,849 (-6%) | 16mo | $180,000 | $97 | 57 |
| 1706 N Peters Ave | 0.20mi | 3/2.0 (+1) | 1,689 (-14%) | 4mo | $195,000 | $115 | 57 |
| 1516 Wilderness Dr | 0.30mi | 3/2.0 (+1) | 1,740 (-12%) | 14mo | $210,000 | $121 | 48 |
| 1325 Dorchester Dr | 0.65mi | 3/2.0 (+1) | 1,745 (-11%) | 1mo | $320,000 | $183 | 43 |
| 1513 Shrill Ct | 0.63mi | 3/2.0 (+1) | 1,895 (-4%) | 18mo | $285,000 | $150 | 42 |
| 811 E Mosier St | 0.68mi | 3/2.0 (+1) | 1,814 (-8%) | 19mo | $279,000 | $154 | 32 |
| 517 Shrill St | 0.63mi | 3/2.0 (+1) | 1,827 (-7%) | 23mo | $278,000 | $152 | 32 |
| 129 E Acres St | 0.66mi | 3/2.0 (+1) | 2,183 (+11%) | 22mo | $299,900 | $137 | 26 |
Match score weights: distance 35% · size 25% · config 20% · recency 20%. Top-matched comps best support the ARV.
Projected returns pro-forma
-3.0% appreciation · 7.66% rent growth · sell at horizon
- IRR
- -11.1%
- Equity multiple
- 0.58×
- Total profit
- $-23,403
- Equity at exit
- $29,806
- IRR
- 3.5%
- Equity multiple
- 1.30×
- Total profit
- $17,049
- Equity at exit
- $17,284
Cash invested: $55,972 (down + closing). Projections, not guarantees.
Landlord ↔ Tenant lean methodology
- Overall (STATE)
- 83 Strongly Landlord-Friendly
- State Oklahoma
- 83 Strongly Landlord-Friendly · R+20
- County
- — inherits STATE
- City
- — inherits STATE
ZIP-level market 73069
- Rents YoY
- 7.7%
- Active inventory
- 253
- Price-to-rent
- 10.2×
Monthly cashflow live
- Estimated rent
- $1,637 high interval (Pro) →
- Mortgage (P&I)
- −$1,048
- Tax from tax record
- −$146 /mo · $1,750/yr
- Insurance
- −$83
- HOA
- −$0
- Vacancy / Maint / Mgmt
- −$344
- Net cashflow
- $16
Break-even live
Sensitivity live
| Price | -10% $129 | -5% $72 | +0% $16 | +5% $-41 | +10% $-98 |
|---|---|---|---|---|---|
| Rent | -10% $-114 | -5% $-49 | +0% $16 | +5% $80 | +10% $145 |
| Rate | -1.0pp $116 | -0.5pp $66 | base $16 | +0.5pp $-36 | +1.0pp $-89 |
UW: 25.0% down · 7.5% · 30yr · 1.5% tax · 5.0% vac · 8.0% maint · 8.0% mgmt
Financing live
Cash to close
- Down payment
- $49,975
- Closing costs
- $5,997
- Reserves months
- —
- Total cash needed
- —
Loan-product check · same deal, 3 products live
Conventional
25% down · 7.5% · 30yr
- Down + closing
- —
- Monthly P&I
- —
- Monthly cashflow
- —
- DSCR
- —
- Eligible?
- —
Personal DTI + credit; lowest rate.
DSCR
20% down · 8.5% · 30yr
- Down + closing
- —
- Monthly P&I
- —
- Monthly cashflow
- —
- DSCR
- —
- Eligible?
- —
No personal income docs; deal must DSCR.
Hard money
10% down · 12.0% · 12mo
- Down + closing
- —
- Monthly P&I
- —
- Monthly cashflow
- —
- DSCR
- —
- Eligible?
- —
Short-term bridge; refi at stabilization.
Rent comps 12 comps
| Address | Beds | Baths | Sqft | Rent | $/sqft | DOM | Units | Dist |
|---|---|---|---|---|---|---|---|---|
| 1505 Shrill Ct Norman, OK | 3.0 | 2.0 | 1818 | $2,195 | $1.21 | 25d | 1 | 0.64mi |
| 805 Grickle Dr Norman, OK | 3.0 | 2.0 | 1405 | $1,550 | $1.10 | 5d | 1 | 0.96mi |
| 712 Dakota St Norman, OK | 3.0 | 1.0 | 1353 | $1,395 | $1.03 | 5d | 1 | 0.98mi |
| 809 Woods Ave Norman, OK | 3.0 | 2.0 | 1556 | $1,550 | $1.00 | 25d | 1 | 1.06mi |
| 343 Woodcrest Dr Norman, OK | 3.0 | 2.0 | 1470 | $1,495 | $1.02 | 25d | 1 | 1.07mi |
| 2700 Red Fish Rd Norman, OK | 3.0 | 2.0 | 1411 | $1,600 | $1.13 | 4d | 1 | 1.09mi |
| 1008 Woods Ave Norman, OK | 3.0 | 1.5 | 1690 | $1,500 | $0.89 | 13d | 1 | 1.11mi |
| 120 Napoli Ct Norman, OK | 3.0 | 2.0 | 2105 | $2,175 | $1.03 | 13d | 1 | 1.14mi |
| 1607 Denison Dr Norman, OK | 3.0 | 1.5 | 1357 | $1,595 | $1.18 | 25d | 1 | 1.32mi |
| 816 Sequoyah Trl Norman, OK | 3.0 | 2.0 | 1367 | $1,525 | $1.12 | 5d | 1 | 1.33mi |
| 2909 Lerkim Ln Norman, OK | 3.0 | 2.0 | 1464 | $1,750 | $1.20 | 5d | 1 | 1.37mi |
| 321 E Duffy St Unit A Norman, OK | 2.0 | 1.0 | 1650 | $1,450 | $0.88 | 5d | 1 | 1.47mi |
Listing history 20 events
-
2026-06-21days on market $199,900 Active 82 DOM
-
2026-06-18days on market $199,900 Active 79 DOM
-
2026-06-17days on market $199,900 Active 78 DOM
-
2026-06-16days on market $199,900 Active 77 DOM
-
2026-06-16price $199,900 Active 76 DOM
-
2026-06-15days on market $207,513 Active 76 DOM
-
2026-06-13days on market $207,513 Active 74 DOM
-
2026-06-09days on market $207,513 Active 70 DOM
-
2026-06-08days on market $207,513 Active 69 DOM
-
2026-06-07days on market $207,513 Active 68 DOM
-
2026-06-05days on market $207,513 Active 65 DOM
-
2026-06-03days on market $207,513 Active 64 DOM
-
2026-06-02days on market $207,513 Active 63 DOM
-
2026-06-01days on market $207,513 Active 62 DOM
-
2026-05-31days on market $207,513 Active 61 DOM
-
2026-05-17price $207,513
-
2026-05-01price $219,900
-
2026-04-13price $229,900
-
2026-03-31$235,000 Active
-
1995-08-15soldstatus $48,000
ⓘ Source: listings_history table (triggers on properties + properties_extension) + one-shot
backfill from property_details.listing_events for pre-trigger history.
Tax reassessment forecast OK · Resets to sale price
- Current annual tax
- $1,750 · $146/mo
- Projected year-2 tax
- $1,799 · $150/mo
- Expected delta
- +$49/yr (+$4/mo · 2.8%)
ⓘ Screening estimate from a state-policy table — verify with the county assessor before closing.
Climate risk First Street
- Flood 1/10 Low FEMA zone X (unshaded) · 0% chance over 30 yrs
- Wildfire 1/10 Low
- Heat 6/10 Major 7 d/yr ≥108°F today · 19 d/yr by 30 yrs out
- Wind 2/10 Low 4% chance of damaging wind over 30 yrs
- Air quality 2/10 Low 1 unhealthy d/yr today · 1 by 30 yrs out
Nearby sold comps map
Loading sold comps map…
Walkable amenities ~0.75 mi
Loading nearby amenities…
Taxation est. · year 1
- Rental income
- $19,641
- − Mortgage interest
- −$11,198
- − Property taxes
- −$1,750
- − Insurance
- −$1,000
- − Repairs & maintenance
- −$1,571
- − Management
- −$1,571
- − Depreciation
- −$5,815
- Taxable loss
- −$3,264
- Est. tax savings @ 24.0%
- +$783
- After-tax cash flow
- $971/yr
For passive investors: Depreciation is non-cash, so a rental often shows a tax loss while cash-flowing — sheltering income. Rental losses are passive: they offset passive income freely, and up to $25,000/yr can offset ordinary (W-2) income if you actively participate and your MAGI is under $100k (phasing out to $0 by $150k); unused losses carry forward. On sale, claimed depreciation is recaptured at up to 25%, and gains may owe capital-gains tax (a 1031 exchange can defer both). Figures are a year-1 estimate at your 24.0% rate — not tax advice; consult a CPA.
Schools (NCES district)
- District
- Norman
- NCES district ID
- 4021720
- Math proficiency
- 27% ▼ -9.00%
- Reading proficiency
- 32% ▼ -8.00%
- Median HH income
- $48,940
- Composite
- 25.67/100
- National rank
- #7395
- State rank
- #61 of 270 in OK
Livability — Norman
- Score
- 85/100
- State rank
- #1
- US rank
- #557
Category grades
Schools grade is shown separately in the Schools card above.
Census & demographics
- Census place
- Norman, OK
- County
- Cleveland County · 239,547 people
- City population
- 123,141
- Metro
- Oklahoma City, OK
- Population (ZIP)
- 28,462
- Household income
- $58,888
- Rent vs Own
- Severe rent burden
- 1704.0
Population outlook (Cleveland County) Hauer SSP2
- Today (2025)
- 323,621 people
- By 2030
- 349,070 · +7.9%
- By 2040
- 400,168 · +23.7%
- By 2050
- 454,101 · +40.3%
- By 2075
- 602,926 · +86.3%
- By 2100
- 734,485 · +127.0%
Race, ethnicity, and origin ACS 2023
- Neighborhood character
- Diverse neighborhood (Simpson 0.56)
- Race & ethnicity
- White 64% Two or more races 15% Hispanic / Latino 14% Native American 4% Black 4% Asian 3% Pacific Islander 1%
- Hispanic origin (detail)
- Mexican 9%
- Common ancestry
- Lithuanian 3% Italian 3% Slovak 2%
- Foreign-born
- 9% · Canada, China
- Languages at home
- 84% English-only · Spanish 10% Other Indo-European 1% Chinese 1%
Political lean MEDSL · Cleveland
- 2024 margin
- R (+14.9) · D 41.4% · R 56.4% · Other 2.2%
- 2008→2024 swing
- +9.1pp toward D · 2008: -24.0pp · 2024: -14.9pp
- All cycles
- 2024: R+14.9 2020: R+14.1 2016: R+21.7 2012: R+25.9 2008: R+24.0
Not yet ingested
- Civics
- —
Market trends
- HPI YoY
- ▼ -252.79%
- Current HPI
- 272.4754
- Rent YoY
- ▲ 7.66%
- Metro
- Oklahoma City, OK
- State GDP YoY
- ▲ 1.55%
- F500 in state
- 6
Industry mix (Fortune 500 HQ in OK)
| Industry | F500 HQs | Revenue |
|---|---|---|
| Energy | 3 | $48B |
|
||
Price history
+332.3% since first listed5 events — show timeline
- 2026-05-17 Price Changed $207,513 MLSOK
- 2026-05-01 Price Changed $219,900 MLSOK
- 2026-04-13 Price Changed $229,900 MLSOK
- 2026-03-31 Listed $235,000 MLSOK
- 1995-08-15 Sold (Public Records) $48,000 Public Records
Property tax history
+4.1%/yrLatest (2024): $1,750 · +4.7% YoY. Source: county tax records.
Cash-flow waterfall
monthlySold comps — $/sqft
last 12 mo · ≤1 miLoading sold comps…