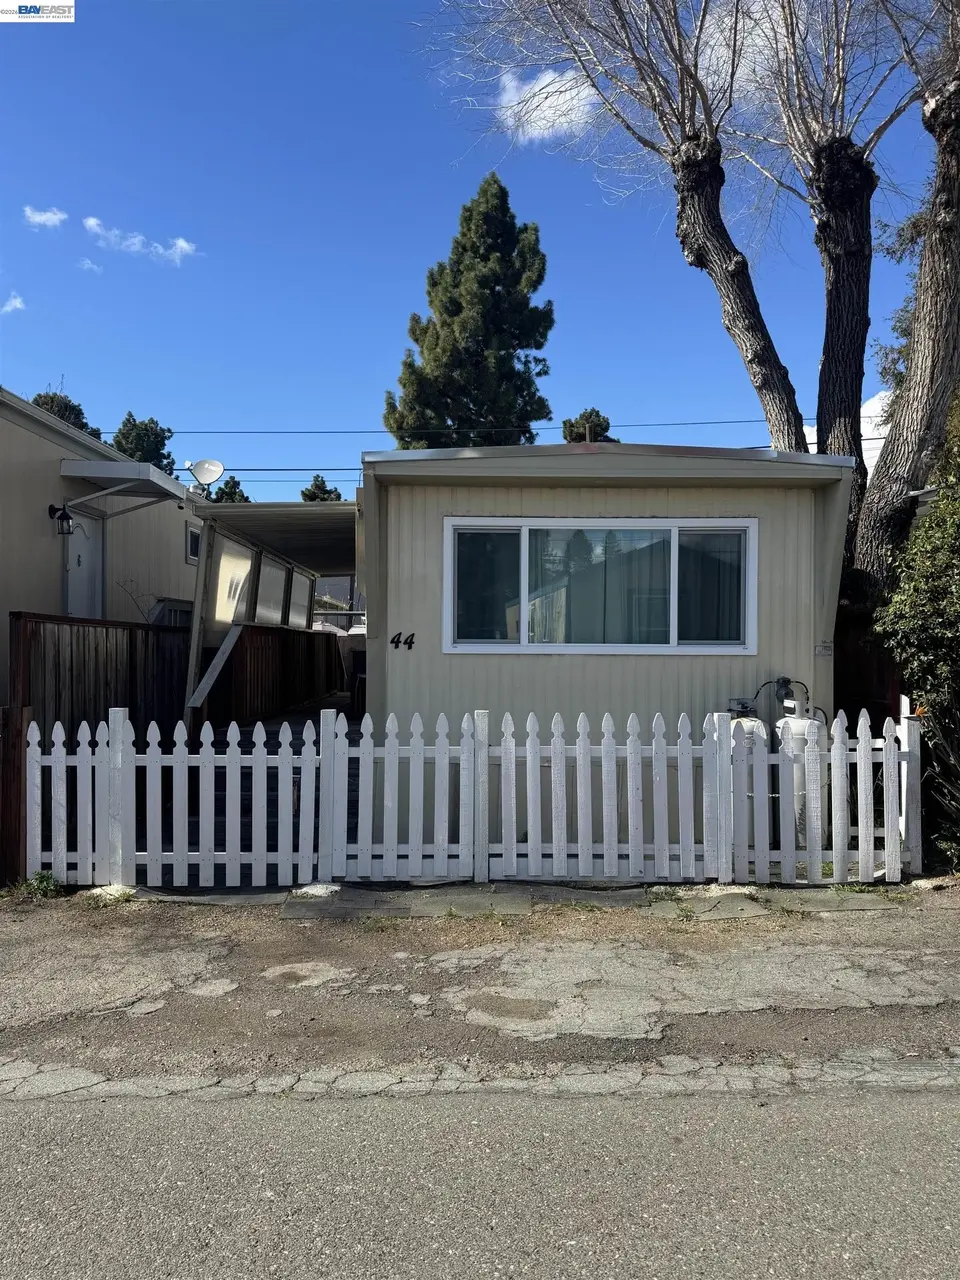
2399 E 14th #44 · San Leandro, CA
Flood risk 1/10 · Minimal
- FEMA flood zone
- X (unshaded)
- Chance of flooding over 30 yrs
- 0.0%
- Est. flood insurance / yr
- $507 – $1,088
Fire risk 4/10 · Minor
- Est. fire insurance / yr
- $659 – $1,223
Heat risk 4/10 · Minor
- Hot days now (above 84°F)
- 7 days/yr
- Hot days in 30 yrs
- 15 days/yr
Wind risk 1/10 · Minimal
- Chance of severe wind over 30 yrs
- —
Air-quality risk 7/10 · Major
- Unhealthy air days now
- 12 days/yr
- Unhealthy air days in 30 yrs
- 12 days/yr
Risk factors via First Street. Map © Google.
Why this score? — see what drove the B- grade
The composite is a weighted blend of 9 inputs, each scored 0–100. Each bar is that input's sub-score; the figure is the points it added to the 100-point composite (weight × sub-score).
- Cash flow +30.0/30.0
- 1% rule +10.0/10.0
- DSCR +10.0/10.0
- ARV discount +3.6/15.0
- Schools +3.4/10.0
- Livability +3.4/5.0
- Rent growth +2.9/5.0
- Condition / age +2.5/5.0
- Appreciation +0.0/10.0
$49,999
🖨 Deal sheet 📄 Offer letter ✓ Due diligence
Listing remarks MLS
Think you can’t afford to own in the Bay Area? Plot twist: you can. This 1-bedroom mobile home in San Leandro is just $59,000. Yes, you read that right. That’s not rent — that’s ownership. Perfect for first-time buyers, savvy downsizers, or anyone tired of making their landlord rich. Smart layout, easy living, and a price point that actually makes sense. Move in, make it yours, and start building equity instead of excuses. Affordable. Attainable. Absolutely worth a look.
Key facts
- Listed 107 days
Neighborhood map
What this means for you Summary
Snapshot
- This is a 1-bed/1.0-bath manufactured listed at $50k.
Deal economics
- At list price, monthly cash flow is $1k ($13k/yr) — positive.
- The deal already cash-flows at list — no discount required.
- Meets the 1% rule at list price ($2k rent vs $50k).
- Recommended offer: $45k (9.0% below list) — sets the bar for market timing.
- Cap rate 32.7% vs local median 2.0% in San Leandro — top-decile yield for the area; either an underpriced asset or a hidden risk that comps aren't pricing in. Stress-test before assuming the spread holds.
Location & tenants
- Location reads 68/100 on livability (#289 in CA) — a middle-class / working-renter tenant base. Strengths: commute A+, employment A+, health & safety A+; Watch: amenities C-, schools D, crime F.
- San Leandro Unified (urban): math 28% / reading 42% proficiency, ranked #831 of 1,400 in CA (top 59%) — families likely to look elsewhere, expect single-tenant / working-renter base with shorter leases.
- Market conditions: Rents rising (+1.7%/yr); 106 active listings in the ZIP; solid renter incomes; 1,742 units permitted in Alameda County in 2024 (856 in 5+ unit buildings).
Forward outlook
- Local home prices are declining (-3.0%/yr); year-one equity from $345 of loan paydown is wiped out by about $2k of value loss. Plan a longer hold.
- Alameda County population projected at +34% by 2050 — long-run rental-demand tailwind backs the buy-and-hold thesis.
- At projected returns (-3.0% appreciation + 1.7% rent growth), your $14k cash investment doubles in ~2 years — after that, you're playing with house money.
Negotiation context
- It's been on market 107 days — a 9% lower offer ($45k) is reasonable based on typical stale-listing flexibility.
- 4 sale attempts since 26y ago; this cycle's ask has dropped $9k (15%) from the opening price — seller is motivated, your offer sets the floor, not the list.
Questions for the listing agent
- It's been on market 107 days. Have you received any prior offers? Is the seller open to a 9% concession, seller financing, or rate buy-down credit?
- Why hasn't it sold? Are there any deal-killer items the seller is aware of (foundation, flood, title, zoning, code violations)?
- Is there a deadline driving the sale (1031 exchange, divorce, estate, relocation)? That informs how much negotiation room exists.
- Schools are D-rated, which usually means shorter tenancies and higher turnover. Who's the typical renter profile here, and what's been the actual vacancy rate?
- Crime grade is F in this area — have there been break-ins, vandalism, or insurance claims at this property in the last 3 years? What carrier currently insures it and at what premium?
- What's the average days-on-market for RENTAL listings here right now (not sales)? A rising rental-DOM trend means longer vacancies and softer asking-rent achievability than the comps imply.
- What's the recent tenant-quality profile in this submarket — average credit score on applications, eviction rate, late-payment / NSF rate, and stable-employment percentage? A property-management company in the area should have these aggregated.
- How much new for-sale + rental construction is in the pipeline within 1–3 miles? Heavy new supply typically softens prices + rents 12–24 months out; constrained supply supports both.
Investment metrics
- 1% rule
- 3.66% ✓
- Cap rate
- 32.70%
- Cash-on-cash
- 94.29%
- DSCR
- 5.20
- GRM
- 2.3
CMA / ARV
- ARV (median comp)
- $46,000
- List price
- $49,999
- Delta
- 8.69%
- Verdict
- FAIR
- Comps
- 3 within 1.0 mi
Show comp detail 4 sales within ~0.75 mi
| Address | Dist | Beds/Ba | Sqft | Sold | Price | $/sf | Match |
|---|---|---|---|---|---|---|---|
| 2399 E 14th St #105 | 0.12mi | 1/1.0 | 420 (-3%) | 1mo | $46,000 | $110 | 89 |
| 2399 E 14th St #66 | 0.06mi | 1/1.0 | 480 (+11%) | 3mo | $46,000 | $96 | 76 |
| 2399 E 14th St #71 | 0.00mi | 1/1.0 | 480 (+11%) | 21mo | $55,000 | $115 | 64 |
| 2399 E 14th St #56 | 0.06mi | 1/1.0 | 480 (+11%) | 23mo | $33,000 | $69 | 60 |
Match score weights: distance 35% · size 25% · config 20% · recency 20%. Top-matched comps best support the ARV.
Projected returns pro-forma
-3.0% appreciation · 1.74% rent growth · sell at horizon
- IRR
- 93.7%
- Equity multiple
- 5.26×
- Total profit
- $59,699
- Equity at exit
- $7,455
- IRR
- 96.3%
- Equity multiple
- 10.51×
- Total profit
- $133,150
- Equity at exit
- $4,323
Cash invested: $14,000 (down + closing). Projections, not guarantees.
Landlord ↔ Tenant lean methodology
- Overall (STATE)
- 18 Strongly Tenant-Friendly
- State California
- 18 Strongly Tenant-Friendly · D+13
- County
- — inherits STATE
- City
- — inherits STATE
ZIP-level market 94577
- Rents YoY
- 1.7%
- Active inventory
- 106
- Price-to-rent
- 2.3×
Monthly cashflow live
- Estimated rent
- $1,830 medium interval (Pro) →
- Mortgage (P&I)
- −$262
- Tax est. 1.5%
- −$62 /mo · $750/yr
- Insurance
- −$21
- HOA
- −$0
- Vacancy / Maint / Mgmt
- −$384
- Net cashflow
- $1,100
Break-even live
UW: 25.0% down · 7.5% · 30yr · 1.5% tax · 5.0% vac · 8.0% maint · 8.0% mgmt
Financing live
Cash to close
- Down payment
- $12,500
- Closing costs
- $1,500
- Reserves months
- —
- Total cash needed
- —
Loan-product check · same deal, 3 products live
Conventional
25% down · 7.5% · 30yr
- Down + closing
- —
- Monthly P&I
- —
- Monthly cashflow
- —
- DSCR
- —
- Eligible?
- —
Personal DTI + credit; lowest rate.
DSCR
20% down · 8.5% · 30yr
- Down + closing
- —
- Monthly P&I
- —
- Monthly cashflow
- —
- DSCR
- —
- Eligible?
- —
No personal income docs; deal must DSCR.
Hard money
10% down · 12.0% · 12mo
- Down + closing
- —
- Monthly P&I
- —
- Monthly cashflow
- —
- DSCR
- —
- Eligible?
- —
Short-term bridge; refi at stabilization.
Listing history 22 events
-
2026-06-18days on market $49,999 Active 107 DOM
-
2026-06-17days on market $49,999 Active 106 DOM
-
2026-06-16days on market $49,999 Active 105 DOM
-
2026-06-15days on market $49,999 Active 104 DOM
-
2026-06-13days on market $49,999 Active 102 DOM
-
2026-06-09days on market $49,999 Active 98 DOM
-
2026-06-08days on market $49,999 Active 97 DOM
-
2026-06-07days on market $49,999 Active 96 DOM
-
2026-06-04days on market $49,999 Active 93 DOM
-
2026-06-03days on market $49,999 Active 92 DOM
-
2026-06-02pricedays on market $49,999 Active 91 DOM
-
2026-06-01days on market $56,990 Active 90 DOM
-
2026-05-31days on market $56,990 Active 89 DOM
-
2026-04-28price $56,990 502-char remark
Show marketing remark (502 chars)
Think you can’t afford to own in the Bay Area? Plot twist: you can. This 1-bedroom mobile home in San Leandro is just $59,000. Yes, you read that right. That’s not rent — that’s ownership. Perfect for first-time buyers, savvy downsizers, or anyone tired of making their landlord rich. Smart layout, easy living, and a price point that actually makes sense. Move in, make it yours, and start building equity instead of excuses. Affordable. Attainable. Absolutely worth a look.
-
2026-03-03$59,000 Active 502-char remark
Show marketing remark (502 chars)
Think you can’t afford to own in the Bay Area? Plot twist: you can. This 1-bedroom mobile home in San Leandro is just $59,000. Yes, you read that right. That’s not rent — that’s ownership. Perfect for first-time buyers, savvy downsizers, or anyone tired of making their landlord rich. Smart layout, easy living, and a price point that actually makes sense. Move in, make it yours, and start building equity instead of excuses. Affordable. Attainable. Absolutely worth a look.
-
2024-06-04soldstatus $51,000
-
2024-06-04soldstatus $51,000 Closed
-
2024-05-17status Pending
-
2024-04-01$53,000
-
2024-04-01$53,000 Active
-
2000-08-02soldstatus $12,000
-
2000-07-07$15,000
ⓘ Source: listings_history table (triggers on properties + properties_extension) + one-shot
backfill from property_details.listing_events for pre-trigger history.
Climate risk First Street
- Flood 1/10 Low FEMA zone X (unshaded) · 0% chance over 30 yrs
- Wildfire 4/10 Moderate
- Heat 4/10 Moderate 7 d/yr ≥84°F today · 15 d/yr by 30 yrs out
- Wind 1/10 Low
- Air quality 7/10 Severe 12 unhealthy d/yr today · 12 by 30 yrs out
Nearby sold comps map
Loading sold comps map…
Walkable amenities ~0.75 mi
Loading nearby amenities…
Taxation est. · year 1
- Rental income
- $21,959
- − Mortgage interest
- −$2,801
- − Property taxes
- −$750
- − Insurance
- −$250
- − Repairs & maintenance
- −$1,757
- − Management
- −$1,757
- − Depreciation
- −$1,455
- Taxable income
- $13,190
- Est. tax owed @ 24.0%
- −$3,166
- After-tax cash flow
- $10,035/yr
For passive investors: Depreciation is non-cash, so a rental often shows a tax loss while cash-flowing — sheltering income. Rental losses are passive: they offset passive income freely, and up to $25,000/yr can offset ordinary (W-2) income if you actively participate and your MAGI is under $100k (phasing out to $0 by $150k); unused losses carry forward. On sale, claimed depreciation is recaptured at up to 25%, and gains may owe capital-gains tax (a 1031 exchange can defer both). Figures are a year-1 estimate at your 24.0% rate — not tax advice; consult a CPA.
Schools (NCES district)
- District
- San Leandro Unified
- NCES district ID
- 0634680
- Math proficiency
- 28% ▲ 3.00%
- Reading proficiency
- 42% ▲ 5.00%
- Median HH income
- $63,377
- Composite
- 34.23/100
- National rank
- #10252
- State rank
- #831 of 1400 in CA
Livability — San Leandro
- Score
- 68/100
- State rank
- #289
- US rank
- #9768
Category grades
Schools grade is shown separately in the Schools card above.
Census & demographics
- Census place
- San Leandro, CA
- County
- Alameda County · 1,614,355 people
- City population
- 88,086
- Metro
- San Francisco-Oakland-Berkeley, CA
- Population (ZIP)
- 46,317
- Household income
- $108,772
- Rent vs Own
- Severe rent burden
- 2005.0
Population outlook (Alameda County) Hauer SSP2
- Today (2025)
- 1,928,884 people
- By 2030
- 2,069,146 · +7.3%
- By 2040
- 2,338,405 · +21.2%
- By 2050
- 2,586,608 · +34.1%
- By 2075
- 3,061,911 · +58.7%
- By 2100
- 3,234,133 · +67.7%
Race, ethnicity, and origin ACS 2023
- Neighborhood character
- Highly diverse neighborhood (Simpson 0.76)
- Race & ethnicity
- Hispanic / Latino 31% Asian 28% White 23% Two or more races 14% Black 12% Native American 2% Pacific Islander 1%
- Hispanic origin (detail)
- Mexican 23%
- Common ancestry
- Russian 2% Italian 1% Lithuanian 1%
- Foreign-born
- 34% · Canada, China, Vietnam
- Languages at home
- 51% English-only · Spanish 23% Chinese 10% Tagalog/Filipino 7%
Political lean MEDSL · Alameda
- 2024 margin
- Solid D (+53.6) · D 74.6% · R 21.0% · Other 4.4%
- 2008→2024 swing
- -5.9pp toward R · 2008: 59.5pp · 2024: 53.6pp
- All cycles
- 2024: D+53.6 2020: D+62.5 2016: D+64.4 2012: D+59.8 2008: D+59.5
Not yet ingested
- Civics
- —
Market trends
- HPI YoY
- ▼ -867.55%
- Current HPI
- 265.2446
- Rent YoY
- ▲ 1.74%
- Metro
- San Francisco-Oakland-Berkeley, CA
- State GDP YoY
- ▲ 3.21%
- F500 in state
- 116
Industry mix (Fortune 500 HQ in CA)
| Industry | F500 HQs | Revenue |
|---|---|---|
| Technology | 27 | $1,492B |
|
||
| Financial Services | 3 | $174B |
|
||
| Retail | 3 | $44B |
|
||
| Insurance | 3 | $26B |
|
||
| Media / Entertainment | 2 | $115B |
|
||
| Pharmaceuticals / Biotech | 2 | $62B |
|
||
Price history
+279.9% since first listed9 events — show timeline
- 2026-04-28 Price Changed $56,990 bridgeMLS, Bay East AOR, or Contra Costa AOR
- 2026-03-03 Listed $59,000 bridgeMLS, Bay East AOR, or Contra Costa AOR
- 2024-06-04 Sold (MLS) $51,000 bridgeMLS, Bay East AOR, or Contra Costa AOR
- 2024-06-04 Sold (MLS) $51,000 San Francisco MLS
- 2024-05-17 Pending — bridgeMLS, Bay East AOR, or Contra Costa AOR
- 2024-04-01 Listed $53,000 bridgeMLS, Bay East AOR, or Contra Costa AOR
- 2024-04-01 Listed $53,000 San Francisco MLS
- 2000-08-02 Sold (MLS) $12,000 bridgeMLS, Bay East AOR, or Contra Costa AOR
- 2000-07-07 Listed $15,000 bridgeMLS, Bay East AOR, or Contra Costa AOR
Cash-flow waterfall
monthlySold comps — $/sqft
last 12 mo · ≤1 miLoading sold comps…