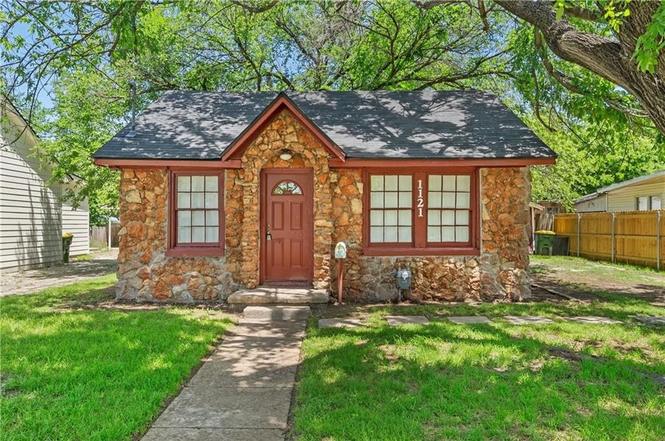
1121 Ashleman St · Bellmead, TX
Flood risk 1/10 · Minimal
- FEMA flood zone
- X (unshaded)
- Chance of flooding over 30 yrs
- 0.0%
- Est. flood insurance / yr
- $507 – $1,088
Fire risk 4/10 · Minor
- Est. fire insurance / yr
- $1,222 – $2,270
Heat risk 7/10 · Major
- Hot days now (above 109°F)
- 7 days/yr
- Hot days in 30 yrs
- 23 days/yr
Wind risk 6/10 · Moderate
- Chance of severe wind over 30 yrs
- 60.0%
Air-quality risk 2/10 · Minimal
- Unhealthy air days now
- 0 days/yr
- Unhealthy air days in 30 yrs
- 1 days/yr
Risk factors via First Street. Map © Google.
Why this score? — see what drove the D+ grade
The composite is a weighted blend of 9 inputs, each scored 0–100. Each bar is that input's sub-score; the figure is the points it added to the 100-point composite (weight × sub-score).
- Cash flow +22.0/30.0
- DSCR +7.0/10.0
- 1% rule +6.0/10.0
- Livability +3.2/5.0
- Rent growth +3.1/5.0
- Condition / age +2.5/5.0
- Schools +2.3/10.0
- ARV discount +0.0/15.0
- Appreciation +0.0/10.0
$99,900
🖨 Deal sheet 📄 Offer letter ✓ Due diligence
Listing remarks MLS
This 2 bedroom, 1 bath home in a nice quiet neighborhood is ready for immediate move-in. Light remodel-New Paint, new roof, nice size back yard, detached garage, and so much more. Shopping (H-E-B, Walmart, Sam’s Club, etc.) and just minutes from Baylor, so many restaurants and other services are available within just a few minutes.
Key facts
- 6,839 sq ft lot
- Built 1940
- Listed 252 days
Neighborhood map
What this means for you Summary
Snapshot
- This is a 2-bed/1.0-bath single-family listed at $100k.
Deal economics
- At list price, monthly cash flow is $159 ($2k/yr) — positive.
- The deal already cash-flows at list — no discount required.
- Meets the 1% rule at list price ($1k rent vs $100k).
- Recommended offer: $88k (12.0% below list) — sets the bar for market timing.
- Cap rate 8.2% vs local median 5.1% in Bellmead — top-decile yield for the area; either an underpriced asset or a hidden risk that comps aren't pricing in. Stress-test before assuming the spread holds.
Location & tenants
- Location reads 63/100 on livability (#893 in TX) — a middle-class / working-renter tenant base. Strengths: cost of living A+, housing A+; Watch: employment D+, crime F, amenities F.
- La Vega ISD (suburban): math 24% / reading 32% proficiency, ranked #680 of 826 in TX (top 82%) — low school quality limits family demand, transient renter base, plan for 1-2y turnover; 79% free/reduced lunch — lower-income household profile, screen leases tightly.
- Zoned schools: La Vega El (math 14% / reading 31%, grade F, #3,311 of 4,322 statewide, top 77%, 659 students, 94% FRL) — zoned schools average 94% FRL vs 79% district-wide (15 pts higher); higher-poverty schools than district average — tighter screening recommended.
- Market conditions: Rents rising (+2.2%/yr); 297 active listings in the ZIP; 2 comparable units currently listed for rent nearby; 1,014 units permitted in McLennan County in 2024 (200 in 5+ unit buildings).
Forward outlook
- Local home prices are declining (-3.0%/yr); year-one equity from $691 of loan paydown is wiped out by about $3k of value loss. Plan a longer hold.
- McLennan County population projected at +17% by 2050 — long-run rental-demand tailwind backs the buy-and-hold thesis.
Negotiation context
- It's been on market 252 days — a 12% lower offer ($88k) is reasonable based on typical stale-listing flexibility.
- 2 sale attempts since 3y ago; this cycle's ask has dropped $12k (11%) from the opening price — seller is motivated, your offer sets the floor, not the list.
Risks & watch-outs
- Watch-outs: built in 1940 — expect roof / HVAC / electrical / plumbing capex.
- Climate carrying-cost: major wind risk, 60% chance of damaging wind over 30y; extreme-heat days projected 7→23/yr by 2055 (HVAC capex compounding) — expect insurance premiums to compound above CPI over the hold.
Questions for the listing agent
- It's been on market 252 days. Have you received any prior offers? Is the seller open to a 12% concession, seller financing, or rate buy-down credit?
- Built in 1940 — when were the roof, HVAC, electrical panel, plumbing, and water heater last replaced?
- Why hasn't it sold? Are there any deal-killer items the seller is aware of (foundation, flood, title, zoning, code violations)?
- Is there a deadline driving the sale (1031 exchange, divorce, estate, relocation)? That informs how much negotiation room exists.
- Schools are F-rated, which usually means shorter tenancies and higher turnover. Who's the typical renter profile here, and what's been the actual vacancy rate?
- Crime grade is F in this area — have there been break-ins, vandalism, or insurance claims at this property in the last 3 years? What carrier currently insures it and at what premium?
- The area grade is low — what's the realistic commute time and amenity access for the typical tenant pool here? Any planned neighborhood developments (good or bad) we should know about?
- What's the average days-on-market for RENTAL listings here right now (not sales)? A rising rental-DOM trend means longer vacancies and softer asking-rent achievability than the comps imply.
- What's the recent tenant-quality profile in this submarket — average credit score on applications, eviction rate, late-payment / NSF rate, and stable-employment percentage? A property-management company in the area should have these aggregated.
- How much new for-sale + rental construction is in the pipeline within 1–3 miles? Heavy new supply typically softens prices + rents 12–24 months out; constrained supply supports both.
Investment metrics
- 1% rule
- 1.10% ✓
- Cap rate
- 8.21%
- Cash-on-cash
- 6.84%
- DSCR
- 1.30
- GRM
- 7.6
CMA / ARV
- ARV (on-the-fly)
- $78,480
- Comps found
- 5
Show comp detail 5 sales within ~0.75 mi
| Address | Dist | Beds/Ba | Sqft | Sold | Price | $/sf | Match |
|---|---|---|---|---|---|---|---|
| 1121 Ashleman St | 0.00mi | 2/1.0 | 720 (0%) | 1mo | $99,900 | $139 | 99 |
| 1224 Ashleman St | 0.16mi | 2/1.0 | 768 (+7%) | 2mo | $145,000 | $189 | 80 |
| 1109 Campbelton St | 0.56mi | 2/1.0 | 642 (-11%) | 13mo | $65,000 | $101 | 45 |
| 2207 Behrens Cir | 0.69mi | 1/1.0 (-1) | 780 (+8%) | 13mo | $74,900 | $96 | 38 |
| 1405 Strickland St | 0.72mi | 2/1.0 | 660 (-8%) | 21mo | $71,900 | $109 | 35 |
Match score weights: distance 35% · size 25% · config 20% · recency 20%. Top-matched comps best support the ARV.
Projected returns pro-forma
-3.0% appreciation · 2.2% rent growth · sell at horizon
- IRR
- -6.7%
- Equity multiple
- 0.75×
- Total profit
- $-6,881
- Equity at exit
- $14,895
- IRR
- 1.9%
- Equity multiple
- 1.13×
- Total profit
- $3,654
- Equity at exit
- $8,638
Cash invested: $27,972 (down + closing). Projections, not guarantees.
Landlord ↔ Tenant lean methodology
- Overall (STATE)
- 87 Strongly Landlord-Friendly
- State Texas
- 87 Strongly Landlord-Friendly · R+5
- County
- — inherits STATE
- City
- — inherits STATE
ZIP-level market 76705
- Home prices YoY
- -29.6%
- Rents YoY
- 2.2%
- Active inventory
- 297
- Price-to-rent
- 7.6×
Monthly cashflow live
- Estimated rent
- $1,102 medium interval (Pro) →
- Mortgage (P&I)
- −$524
- Tax from tax record
- −$146 /mo · $1,750/yr
- Insurance
- −$42
- HOA
- −$0
- Vacancy / Maint / Mgmt
- −$231
- Net cashflow
- $159
Break-even live
UW: 25.0% down · 7.5% · 30yr · 1.5% tax · 5.0% vac · 8.0% maint · 8.0% mgmt
Financing live
Cash to close
- Down payment
- $24,975
- Closing costs
- $2,997
- Reserves months
- —
- Total cash needed
- —
Loan-product check · same deal, 3 products live
Conventional
25% down · 7.5% · 30yr
- Down + closing
- —
- Monthly P&I
- —
- Monthly cashflow
- —
- DSCR
- —
- Eligible?
- —
Personal DTI + credit; lowest rate.
DSCR
20% down · 8.5% · 30yr
- Down + closing
- —
- Monthly P&I
- —
- Monthly cashflow
- —
- DSCR
- —
- Eligible?
- —
No personal income docs; deal must DSCR.
Hard money
10% down · 12.0% · 12mo
- Down + closing
- —
- Monthly P&I
- —
- Monthly cashflow
- —
- DSCR
- —
- Eligible?
- —
Short-term bridge; refi at stabilization.
Rent comps 2 comps
| Address | Beds | Baths | Sqft | Rent | $/sqft | DOM | Units | Dist |
|---|---|---|---|---|---|---|---|---|
| 3600 Scroggins Dr Waco, TX | 1.0 | 1.0 | 681 | $920 | $1.35 | 43d | 4 | 0.46mi |
| 3500 Meyers Ln Waco, TX | 1.0–2.0 | 1.0–2.0 | 684 | $1,125 | $1.64 | 13d | 1 | 1.32mi |
Listing history 14 events
-
2026-04-25status Pending
-
2026-04-14historical Active Option Contract
-
2026-04-14status Pending
-
2025-11-25price $99,900
-
2025-11-25price $99,000
-
2025-10-31price $106,500
-
2025-10-06price $107,000
-
2025-09-22price $110,000
-
2025-09-17price $111,500
-
2025-08-16$112,000 Active
-
2023-06-16soldstatus 339-char remark
Show marketing remark (339 chars)
This 2 bedroom, 1 bath home in a nice quiet neighborhood is ready for immediate move-in. Light remodel-New Paint, new roof, nice size back yard, detached garage, and so much more. Shopping (H-E-B, Walmart, Sam’s Club, etc.) and just minutes from Baylor, so many restaurants and other services are available within just a few minutes.
-
2023-06-16soldstatus
Show marketing remark (339 chars)
This 2 bedroom, 1 bath home in a nice quiet neighborhood is ready for immediate move-in. Light remodel-New Paint, new roof, nice size back yard, detached garage, and so much more. Shopping (H-E-B, Walmart, Sam’s Club, etc.) and just minutes from Baylor, so many restaurants and other services are available within just a few minutes.
-
2023-05-05$119,500 339-char remark
Show marketing remark (339 chars)
This 2 bedroom, 1 bath home in a nice quiet neighborhood is ready for immediate move-in. Light remodel-New Paint, new roof, nice size back yard, detached garage, and so much more. Shopping (H-E-B, Walmart, Sam’s Club, etc.) and just minutes from Baylor, so many restaurants and other services are available within just a few minutes.
-
1990-01-01soldstatus
ⓘ Source: listings_history table (triggers on properties + properties_extension) + one-shot
backfill from property_details.listing_events for pre-trigger history.
Tax reassessment forecast TX · Resets to sale price
- Current annual tax
- $1,750 · $146/mo
- Projected year-2 tax
- $1,828 · $152/mo
- Expected delta
- +$79/yr (+$7/mo · 4.5%)
ⓘ Screening estimate from a state-policy table — verify with the county assessor before closing.
Climate risk First Street
- Flood 1/10 Low FEMA zone X (unshaded) · 0% chance over 30 yrs
- Wildfire 4/10 Moderate
- Heat 7/10 Severe 7 d/yr ≥109°F today · 23 d/yr by 30 yrs out
- Wind 6/10 Major 60% chance of damaging wind over 30 yrs
- Air quality 2/10 Low 0 unhealthy d/yr today · 1 by 30 yrs out
Nearby sold comps map
Loading sold comps map…
Walkable amenities ~0.75 mi
Loading nearby amenities…
Taxation est. · year 1
- Rental income
- $13,227
- − Mortgage interest
- −$5,596
- − Property taxes
- −$1,750
- − Insurance
- −$500
- − Repairs & maintenance
- −$1,058
- − Management
- −$1,058
- − Depreciation
- −$2,906
- Taxable income
- $360
- Est. tax owed @ 24.0%
- −$86
- After-tax cash flow
- $1,828/yr
For passive investors: Depreciation is non-cash, so a rental often shows a tax loss while cash-flowing — sheltering income. Rental losses are passive: they offset passive income freely, and up to $25,000/yr can offset ordinary (W-2) income if you actively participate and your MAGI is under $100k (phasing out to $0 by $150k); unused losses carry forward. On sale, claimed depreciation is recaptured at up to 25%, and gains may owe capital-gains tax (a 1031 exchange can defer both). Figures are a year-1 estimate at your 24.0% rate — not tax advice; consult a CPA.
Schools (NCES district)
- District
- La Vega ISD
- NCES district ID
- 4826280
- Math proficiency
- 24% ▼ -13.00%
- Reading proficiency
- 32% ▼ -4.00%
- Median HH income
- $38,539
- Composite
- 23.42/100
- National rank
- #7892
- State rank
- #680 of 826 in TX
Livability — Bellmead
- Score
- 63/100
- State rank
- #893
- US rank
- #16031
Category grades
Schools grade is shown separately in the Schools card above.
Census & demographics
- Census place
- Bellmead, TX
- County
- McLennan County · 213,088 people
- City population
- 31,750
- Metro
- Waco, TX
- Population (ZIP)
- 31,616
- Household income
- $58,236
- Rent vs Own
- Severe rent burden
- 668.0
Population outlook (McLennan County) Hauer SSP2
- Today (2025)
- 264,191 people
- By 2030
- 273,578 · +3.6%
- By 2040
- 291,506 · +10.3%
- By 2050
- 308,044 · +16.6%
- By 2075
- 349,648 · +32.3%
- By 2100
- 364,779 · +38.1%
Race, ethnicity, and origin ACS 2023
- Neighborhood character
- Diverse neighborhood (Simpson 0.68)
- Race & ethnicity
- White 43% Hispanic / Latino 32% Two or more races 20% Black 18% Native American 1% Asian 1%
- Hispanic origin (detail)
- Mexican 31%
- Common ancestry
- Slovak 2% Lithuanian 1% Serbian 1%
- Foreign-born
- 13% · Canada, Vietnam
- Languages at home
- 73% English-only · Spanish 24% Other Indo-European 1% German/W. Germanic 1%
Political lean MEDSL · McLennan
- 2024 margin
- Solid R (+30.9) · D 34.0% · R 64.9% · Other 1.0%
- 2008→2024 swing
- -7.0pp toward R · 2008: -23.9pp · 2024: -30.9pp
- All cycles
- 2024: R+30.9 2020: R+23.4 2016: R+27.1 2012: R+29.8 2008: R+23.9
Not yet ingested
- Civics
- —
Market trends
- HPI YoY
- ▼ -91.45%
- Current HPI
- 217.9429
- Rent YoY
- ▲ 2.20%
- Metro
- Waco, TX
- State GDP YoY
- ▲ 3.95%
- F500 in state
- 110
Industry mix (Fortune 500 HQ in TX)
| Industry | F500 HQs | Revenue |
|---|---|---|
| Energy | 16 | $1,198B |
|
||
| Technology | 5 | $198B |
|
||
| Engineering / Construction | 4 | $72B |
|
||
| Energy Services | 3 | $60B |
|
||
| Utilities | 3 | $41B |
|
||
| Healthcare | 2 | $330B |
|
||
Price history
-16.4% since first listed14 events — show timeline
- 2026-04-25 Pending — NTREIS
- 2026-04-14 Contingent — NTREIS
- 2026-04-14 Pending — NTREIS
- 2025-11-25 Price Changed $99,900 NTREIS
- 2025-11-25 Price Changed $99,000 NTREIS
- 2025-10-31 Price Changed $106,500 NTREIS
- 2025-10-06 Price Changed $107,000 NTREIS
- 2025-09-22 Price Changed $110,000 NTREIS
- 2025-09-17 Price Changed $111,500 NTREIS
- 2025-08-16 Listed $112,000 NTREIS
- 2023-06-16 Sold (Public Records) — Public Records
- 2023-06-16 Sold (MLS) — NTREIS
- 2023-05-05 Listed $119,500 NTREIS
- 1990-01-01 Sold (Public Records) — Public Records
Property tax history
+10.8%/yrLatest (2025): $1,750 · +15.3% YoY. Source: county tax records.
Cash-flow waterfall
monthlySold comps — $/sqft
last 12 mo · ≤1 miLoading sold comps…