209 Bellevue Dr · Round Lake Park, IL
Flood risk 1/10 · Minimal
- FEMA flood zone
- X (unshaded)
- Chance of flooding over 30 yrs
- 0.0%
- Est. flood insurance / yr
- $473 – $860
Fire risk 1/10 · Minimal
- Est. fire insurance / yr
- $804 – $1,492
Heat risk 2/10 · Minimal
- Hot days now (above 100°F)
- 7 days/yr
- Hot days in 30 yrs
- 14 days/yr
Wind risk 2/10 · Minimal
- Chance of severe wind over 30 yrs
- —
Air-quality risk 3/10 · Minor
- Unhealthy air days now
- 2 days/yr
- Unhealthy air days in 30 yrs
- 3 days/yr
Risk factors via First Street. Map © Google.
Why this score? — see what drove the D+ grade
The composite is a weighted blend of 9 inputs, each scored 0–100. Each bar is that input's sub-score; the figure is the points it added to the 100-point composite (weight × sub-score).
- Cash flow +15.5/30.0
- ARV discount +11.5/15.0
- 1% rule +5.5/10.0
- DSCR +4.8/10.0
- Livability +3.5/5.0
- Rent growth +3.2/5.0
- Condition / age +2.5/5.0
- Schools +1.0/10.0
- Appreciation +0.0/10.0
$245,000
🖨 Deal sheet (PDF) 📄 Offer letter ✓ Due diligence
Listing remarks
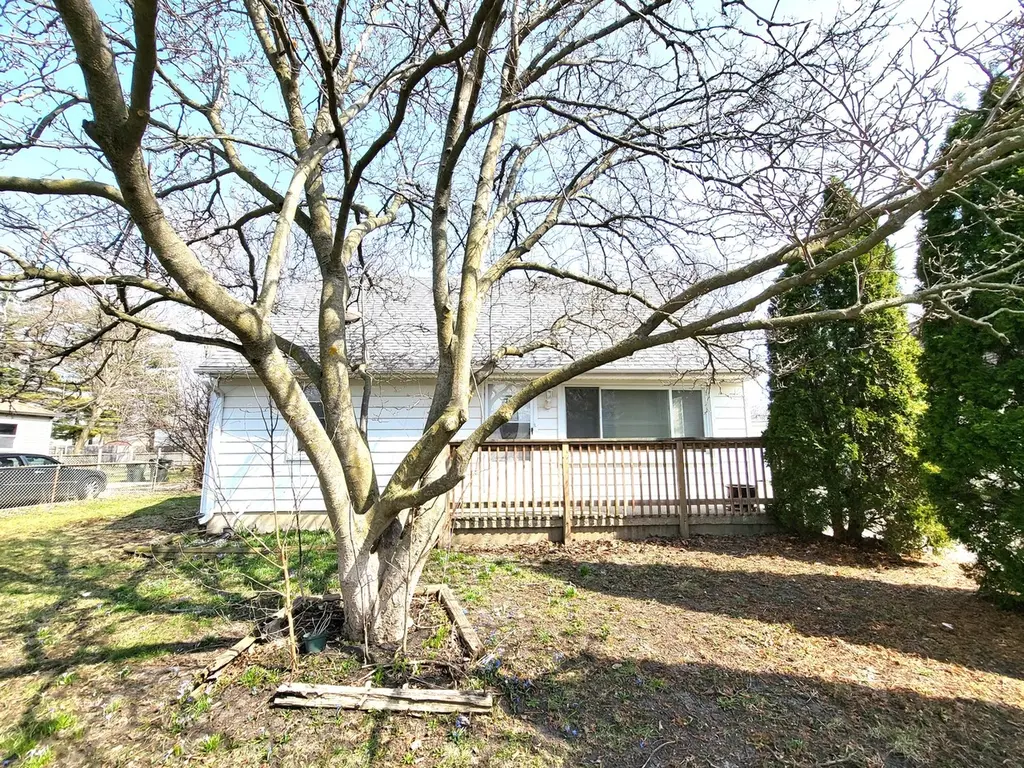
This 3-bedroom, 2-bath single-family home offers a spacious and comfortable layout with a fully finished basement. Freshly painted throughout with brand-new carpet, the home is filled with natural light and features a thoughtfully designed floor plan. The oversized primary bedroom and two generously sized additional bedrooms provide plenty of space, along with a versatile bonus room and full bathroom in the basement. The kitchen and dining room combination is perfect for everyday living and entertaining. Step outside to a raised deck overlooking a large backyard-ideal for relaxing or hosting year-round. An extra-large driveway with a 2-car garage provides ample parking for multiple vehicles
Key facts
- Extra-large driveway
- Large backyard
- Raised deck
Tags
Neighborhood map
What this means for you Summary
Snapshot
- This is a 3-bed/1.0-bath single-family listed at $245k.
Deal economics
- At list price, monthly cash flow is $100 ($1k/yr) — positive.
- The deal already cash-flows at list — no discount required.
- Meets the 1% rule at list price ($3k rent vs $245k).
- Cap rate 6.8% vs local median 4.5% in Round Lake Park — top-decile yield for the area; either an underpriced asset or a hidden risk that comps aren't pricing in. Stress-test before assuming the spread holds.
Location & tenants
- Location reads 69/100 on livability (#422 in IL) — a middle-class / working-renter tenant base. Strengths: crime A+, cost of living A+, housing A+; Watch: amenities F, employment D-.
- Round Lake CUSD 116 (suburban): math 7% / reading 14% proficiency, ranked #560 of 620 in IL (top 90%) — low school quality limits family demand, transient renter base, plan for 1-2y turnover; 67% free/reduced lunch — lower-income household profile, screen leases tightly.
- Zoned schools: W J Murphy Elem School (math 8% / reading 17%, grade F, #1,371 of 2,056 statewide, top 68%, 454 students, 0% FRL); Magee Middle School (math 8% / reading 21%, grade F, #517 of 665 statewide, top 79%, 673 students, 0% FRL); Round Lake Senior High School (math 9% / reading 13%, grade F, #522 of 693 statewide, top 76%, 2,258 students, 0% FRL) — zoned schools average 0% FRL vs 67% district-wide (67 pts lower); this property's tenant base skews higher-income than the district average.
- Market conditions: Rents rising (+2.9%/yr); 97 active listings in the ZIP; 8 comparable units currently listed for rent nearby; rentals leasing fast (median 13d on market — plan ~1-2 weeks tenant-placement turnaround); solid renter incomes; 948 units permitted in Lake County in 2024 (424 in 5+ unit buildings).
- This rent runs 31% of the median local income ($99k/yr) — at the standard rent-burdened threshold; future hikes will face affordability resistance.
Forward outlook
- Local home prices are declining (-3.0%/yr); year-one equity from $2k of loan paydown is wiped out by about $7k of value loss. Plan a longer hold.
- Lake County population projected to shrink 8% by 2050 — rents likely to lag national; underwrite the cash flow, not the appreciation.
Negotiation context
- Only 6 days on market — expect competitive offers; lowballing is unlikely to land.
- 7 sale attempts since 19y ago with the ask held roughly flat each time — persistent listings suggest the price (not the market) is what's stuck; bring a comps-based counter.
- Current owner paid $167k; 47% above their basis — modest negotiation headroom, anchor on the comps not their cost.
Risks & watch-outs
- Watch-outs: property tax is 2.6% of price; built in 1958 — expect roof / HVAC / electrical / plumbing capex.
Questions for the listing agent
- Built in 1958 — when were the roof, HVAC, electrical panel, plumbing, and water heater last replaced?
- Property tax is high relative to price — has the assessment been appealed recently, and will the sale trigger a re-assessment?
- Is there a deadline driving the sale (1031 exchange, divorce, estate, relocation)? That informs how much negotiation room exists.
- Schools are F-rated, which usually means shorter tenancies and higher turnover. Who's the typical renter profile here, and what's been the actual vacancy rate?
- The area grade is low — what's the realistic commute time and amenity access for the typical tenant pool here? Any planned neighborhood developments (good or bad) we should know about?
- What's the average days-on-market for RENTAL listings here right now (not sales)? A rising rental-DOM trend means longer vacancies and softer asking-rent achievability than the comps imply.
- What's the recent tenant-quality profile in this submarket — average credit score on applications, eviction rate, late-payment / NSF rate, and stable-employment percentage? A property-management company in the area should have these aggregated.
- How much new for-sale + rental construction is in the pipeline within 1–3 miles? Heavy new supply typically softens prices + rents 12–24 months out; constrained supply supports both.
Investment metrics
- 1% rule
- 1.05% ✓
- Cap rate
- 6.78%
- Cash-on-cash
- 1.75%
- DSCR
- 1.08
- GRM
- 8.0
CMA / ARV
- ARV (on-the-fly)
- $268,656
- Comps found
- 12
Show comp detail 12 sales within ~0.75 mi
| Address | Dist | Beds/Ba | Sqft | Sold | Price | $/sf | Match |
|---|---|---|---|---|---|---|---|
| 205 N Prospect Dr | 0.15mi | 3/1.0 | 1,494 (+7%) | 2mo | $210,000 | $141 | 79 |
| 128 Bellevue Dr | 0.08mi | 4/1.0 (+1) | 1,288 (-8%) | 0mo | $248,000 | $193 | 78 |
| 229 E Pineview Dr | 0.22mi | 3/2.0 | 1,350 (-3%) | 5mo | $100,000 | $74 | 77 |
| 224 Bellevue Dr | 0.06mi | 3/1.0 | 1,240 (-11%) | 5mo | $235,000 | $190 | 75 |
| 318 Elder Dr | 0.15mi | 3/1.5 | 1,200 (-14%) | 3mo | $239,000 | $199 | 66 |
| 352 Linden Dr | 0.44mi | 3/1.5 | 1,474 (+6%) | 6mo | $335,000 | $227 | 62 |
| 34050 N Lilac Ave | 0.71mi | 3/1.5 | 1,390 (-0%) | 5mo | $232,000 | $167 | 61 |
| 414 E Washington St | 0.42mi | 3/2.0 | 1,524 (+10%) | 1mo | $242,000 | $159 | 60 |
| 314 Maple Ln | 0.63mi | 3/1.5 | 1,454 (+4%) | 3mo | $317,000 | $218 | 59 |
| 113 Orchard St | 0.67mi | 4/2.0 (+1) | 1,400 (+1%) | 3mo | $305,000 | $218 | 56 |
| 423 Windridge Dr | 0.53mi | 3/2.0 | 1,248 (-10%) | 4mo | $340,000 | $272 | 51 |
| 509 Catalpa Dr | 0.52mi | 4/2.0 (+1) | 1,556 (+12%) | 6mo | $246,500 | $158 | 42 |
Match score weights: distance 35% · size 25% · config 20% · recency 20%. Top-matched comps best support the ARV.
Projected returns pro-forma
-3.0% appreciation · 2.87% rent growth · sell at horizon
- IRR
- -13.6%
- Equity multiple
- 0.51×
- Total profit
- $-33,465
- Equity at exit
- $36,530
- IRR
- -4.8%
- Equity multiple
- 0.69×
- Total profit
- $-21,548
- Equity at exit
- $21,183
Cash invested: $68,600 (down + closing). Projections, not guarantees.
Landlord ↔ Tenant lean methodology
- Overall (STATE)
- 43 Moderately Tenant-Leaning
- State Illinois
- 43 Moderately Tenant-Leaning · D+7
- County
- — inherits STATE
- City
- — inherits STATE
ZIP-level market 60073
- Rents YoY
- 2.9%
- Active inventory
- 97
- Price-to-rent
- 8.0×
Monthly cashflow live
- Estimated rent
- $2,565 high interval (Pro) →
- Mortgage (P&I)
- −$1,285
- Tax from tax record
- −$539 /mo · $6,472/yr
- Insurance
- −$102
- HOA
- −$0
- Vacancy / Maint / Mgmt
- −$539
- Net cashflow
- $100
Break-even live
Sensitivity live
| Price | -10% $239 | -5% $170 | +0% $100 | +5% $31 | +10% $-38 |
|---|---|---|---|---|---|
| Rent | -10% $-102 | -5% $-1 | +0% $100 | +5% $202 | +10% $303 |
| Rate | -1.0pp $224 | -0.5pp $163 | base $100 | +0.5pp $37 | +1.0pp $-28 |
UW: 25.0% down · 7.5% · 30yr · 1.5% tax · 5.0% vac · 8.0% maint · 8.0% mgmt
Financing live
Cash to close
- Down payment
- $61,250
- Closing costs
- $7,350
- Reserves months
- —
- Total cash needed
- —
Loan-product check · same deal, 3 products live
Conventional
25% down · 7.5% · 30yr
- Down + closing
- —
- Monthly P&I
- —
- Monthly cashflow
- —
- DSCR
- —
- Eligible?
- —
Personal DTI + credit; lowest rate.
DSCR
20% down · 8.5% · 30yr
- Down + closing
- —
- Monthly P&I
- —
- Monthly cashflow
- —
- DSCR
- —
- Eligible?
- —
No personal income docs; deal must DSCR.
Hard money
10% down · 12.0% · 12mo
- Down + closing
- —
- Monthly P&I
- —
- Monthly cashflow
- —
- DSCR
- —
- Eligible?
- —
Short-term bridge; refi at stabilization.
Rent comps 8 comps
| Address | Beds | Baths | Sqft | Rent | $/sqft | DOM | Units | Dist |
|---|---|---|---|---|---|---|---|---|
| 341 Holiday Ln Hainesville, IL | 2.0 | 2.0 | 1700 | $2,300 | $1.35 | 26d | 1 | 0.23mi |
| 400 Clifton Dr Round Lake Park, IL | 4.0 | 2.5 | 1202 | $2,350 | $1.96 | 13d | 1 | 0.28mi |
| 295 Holiday Ln Unit 295 Hainesville, IL | 3.0 | 2.0 | 1244 | $2,250 | $1.81 | 22d | 1 | 0.28mi |
| 208 W Nippersink Rd Round Lake, IL | 4.0 | 2.0 | 1376 | $2,695 | $1.96 | 12d | 1 | 0.59mi |
| 378 Tower Dr #378 Hainesville, IL | 3.0 | 2.5 | 1488 | $2,600 | $1.75 | 13d | 1 | 0.61mi |
| 108 E Big Horn Dr Hainesville, IL | 3.0 | 1.5 | 1228 | $2,600 | $2.12 | 0d | 1 | 0.65mi |
| 426 Alpine Dr Round Lake, IL | 3.0 | 1.0 | 957 | $2,000 | $2.09 | 6d | 1 | 0.71mi |
| 59 S Treehouse Ln #59 Round Lake, IL | 3.0 | 1.5 | 1408 | $2,300 | $1.63 | 13d | 1 | 0.80mi |
Listing history 33 events
-
2026-03-31status Pending
-
2026-03-24$245,000 Active
-
2013-11-26historical
-
2013-10-24New
-
2013-07-09historical
-
2013-02-22historical Contingent
-
2012-12-06status Reactivated
-
2012-07-12historical Contingent
-
2012-06-26price Price Change
-
2012-06-19price Price Change
-
2012-06-07price Price Change
-
2012-05-21price Price Change
-
2012-05-09price Price Change
-
2012-04-23price Price Change
-
2012-04-09price Price Change
-
2012-03-23price Price Change
-
2012-03-12price Price Change
-
2012-03-05price Price Change
-
2012-02-21price Price Change
-
2012-02-11price Price Change
-
2012-02-02price Price Change
-
2012-01-03New
-
2008-07-16soldstatus $166,900
-
2008-05-27soldstatus $166,900
-
2008-04-22historical
-
2008-04-11$164,900
-
2008-01-31soldstatus $105,000
-
2007-11-22historical
-
2007-09-04$110,500
-
2007-08-30historical
-
2007-07-25
-
2005-05-17soldstatus $155,000
-
2000-04-12soldstatus $112,500
ⓘ Source: listings_history table (triggers on properties + properties_extension) + one-shot
backfill from property_details.listing_events for pre-trigger history.
Tax reassessment forecast IL · Partial reset (capped growth)
- Current annual tax
- $6,472 · $539/mo
- Projected year-2 tax
- $6,472 · $539/mo
- Expected delta
- $0/yr ($0/mo · 0.0%)
ⓘ Screening estimate from a state-policy table — verify with the county assessor before closing.
Climate risk First Street
- Flood 1/10 Low FEMA zone X (unshaded) · 0% chance over 30 yrs
- Wildfire 1/10 Low
- Heat 2/10 Low 7 d/yr ≥100°F today · 14 d/yr by 30 yrs out
- Wind 2/10 Low
- Air quality 3/10 Moderate 2 unhealthy d/yr today · 3 by 30 yrs out
Nearby sold comps map
Loading sold comps map…
Walkable amenities ~0.75 mi
Loading nearby amenities…
Taxation est. · year 1
- Rental income
- $30,782
- − Mortgage interest
- −$13,724
- − Property taxes
- −$6,472
- − Insurance
- −$1,225
- − Repairs & maintenance
- −$2,463
- − Management
- −$2,463
- − Depreciation
- −$7,127
- Taxable loss
- −$2,691
- Est. tax savings @ 24.0%
- +$646
- After-tax cash flow
- $1,849/yr
For passive investors: Depreciation is non-cash, so a rental often shows a tax loss while cash-flowing — sheltering income. Rental losses are passive: they offset passive income freely, and up to $25,000/yr can offset ordinary (W-2) income if you actively participate and your MAGI is under $100k (phasing out to $0 by $150k); unused losses carry forward. On sale, claimed depreciation is recaptured at up to 25%, and gains may owe capital-gains tax (a 1031 exchange can defer both). Figures are a year-1 estimate at your 24.0% rate — not tax advice; consult a CPA.
Schools (NCES district)
- District
- Round Lake CUSD 116
- NCES district ID
- 1734990
- Math proficiency
- 7% ▼ -6.00%
- Reading proficiency
- 14% ▼ -2.00%
- Median HH income
- $53,477
- Composite
- 10.35/100
- National rank
- #9789
- State rank
- #560 of 620 in IL
Livability — Round Lake Park
- Score
- 69/100
- State rank
- #422
- US rank
- #8626
Category grades
Schools grade is shown separately in the Schools card above.
Census & demographics
- Census place
- Round Lake Park, IL
- County
- Lake County · 591,991 people
- Metro
- Chicago-Naperville-Elgin, IL-IN-WI
- Population (ZIP)
- 62,868
- Household income
- $98,514
- Rent vs Own
- Severe rent burden
- 1225.0
Population outlook (Lake County) Hauer SSP2
- Today (2025)
- 700,217 people
- By 2030
- 693,290 · -1.0%
- By 2040
- 673,588 · -3.8%
- By 2050
- 643,556 · -8.1%
- By 2075
- 562,792 · -19.6%
- By 2100
- 457,715 · -34.6%
Race, ethnicity, and origin ACS 2023
- Neighborhood character
- Diverse neighborhood (Simpson 0.63)
- Race & ethnicity
- Hispanic / Latino 45% White 40% Two or more races 20% Asian 7% Black 4% Native American 2%
- Hispanic origin (detail)
- Mexican 37% Puerto Rican 3%
- Common ancestry
- Romanian 8% Portuguese 1% Lithuanian 1%
- Foreign-born
- 25% · Canada, South Korea, Vietnam
- Languages at home
- 56% English-only · Spanish 35% Russian/Polish/Slavic 2% Other Indo-European 2%
Political lean MEDSL · Lake
- 2024 margin
- Strong D (+20.8) · D 59.7% · R 38.9% · Other 1.4%
- 2008→2024 swing
- +1.1pp toward D · 2008: 19.6pp · 2024: 20.8pp
- All cycles
- 2024: D+20.8 2020: D+24.1 2016: D+20.3 2012: D+8.1 2008: D+19.6
Not yet ingested
- Civics
- —
Market trends
- HPI YoY
- ▼ -140.95%
- Current HPI
- 229.1762
- Rent YoY
- ▲ 2.87%
- Metro
- Chicago-Naperville-Elgin, IL-IN-WI
- State GDP YoY
- ▲ 1.59%
- F500 in state
- 60
Industry mix (Fortune 500 HQ in IL)
| Industry | F500 HQs | Revenue |
|---|---|---|
| Insurance | 4 | $201B |
|
||
| Consumer Goods | 4 | $87B |
|
||
| Industrial Machinery | 3 | $64B |
|
||
| Healthcare | 2 | $55B |
|
||
| Retail / Pharmacy | 1 | $148B |
|
||
| Agriculture / Food | 1 | $86B |
|
||
Price history
+117.8% since first listed33 events — show timeline
- 2026-03-31 Pending — MRED as Distributed by MLS Grid
- 2026-03-24 Listed $245,000 MRED as Distributed by MLS Grid
- 2013-11-26 Listing Removed — MRED as Distributed by MLS Grid
- 2013-10-24 Listed — MRED as Distributed by MLS Grid
- 2013-07-09 Listing Removed — MRED as Distributed by MLS Grid
- 2013-02-22 Contingent — MRED as Distributed by MLS Grid
- 2012-12-06 Relisted — MRED as Distributed by MLS Grid
- 2012-07-12 Contingent — MRED as Distributed by MLS Grid
- 2012-06-26 Price Changed — MRED as Distributed by MLS Grid
- 2012-06-19 Price Changed — MRED as Distributed by MLS Grid
- 2012-06-07 Price Changed — MRED as Distributed by MLS Grid
- 2012-05-21 Price Changed — MRED as Distributed by MLS Grid
- 2012-05-09 Price Changed — MRED as Distributed by MLS Grid
- 2012-04-23 Price Changed — MRED as Distributed by MLS Grid
- 2012-04-09 Price Changed — MRED as Distributed by MLS Grid
- 2012-03-23 Price Changed — MRED as Distributed by MLS Grid
- 2012-03-12 Price Changed — MRED as Distributed by MLS Grid
- 2012-03-05 Price Changed — MRED as Distributed by MLS Grid
- 2012-02-21 Price Changed — MRED as Distributed by MLS Grid
- 2012-02-11 Price Changed — MRED as Distributed by MLS Grid
- 2012-02-02 Price Changed — MRED as Distributed by MLS Grid
- 2012-01-03 Listed — MRED as Distributed by MLS Grid
- 2008-07-16 Sold (Public Records) $166,900 Public Records
- 2008-05-27 Sold (MLS) $166,900 MRED as Distributed by MLS Grid
- 2008-04-22 Listing Removed — MRED as Distributed by MLS Grid
- 2008-04-11 Listed $164,900 MRED as Distributed by MLS Grid
- 2008-01-31 Sold (MLS) $105,000 MRED as Distributed by MLS Grid
- 2007-11-22 Listing Removed — MRED as Distributed by MLS Grid
- 2007-09-04 Listed $110,500 MRED as Distributed by MLS Grid
- 2007-08-30 Listing Removed — MRED as Distributed by MLS Grid
- 2007-07-25 Listed — MRED as Distributed by MLS Grid
- 2005-05-17 Sold (Public Records) $155,000 Public Records
- 2000-04-12 Sold (Public Records) $112,500 Public Records
Property tax history
+2.5%/yrLatest (2024): $6,472 · +12.4% YoY. Source: county tax records.
Cash-flow waterfall
monthlySold comps — $/sqft
last 12 mo · ≤1 miLoading sold comps…