700 S Shafter #20 · Shafter, CA
Flood risk 3/10 · Minor
- FEMA flood zone
- X (unshaded)
- Chance of flooding over 30 yrs
- 0.16%
- Est. flood insurance / yr
- $507 – $1,088
Fire risk 5/10 · Moderate
- Est. fire insurance / yr
- $659 – $1,223
Heat risk 8/10 · Major
- Hot days now (above 105°F)
- 7 days/yr
- Hot days in 30 yrs
- 19 days/yr
Wind risk 1/10 · Minimal
- Chance of severe wind over 30 yrs
- —
Air-quality risk 10/10 · Severe
- Unhealthy air days now
- 23 days/yr
- Unhealthy air days in 30 yrs
- 28 days/yr
Risk factors via First Street. Map © Google.
Why this score? — see what drove the B- grade
The composite is a weighted blend of 9 inputs, each scored 0–100. Each bar is that input's sub-score; the figure is the points it added to the 100-point composite (weight × sub-score).
- Cash flow +30.0/30.0
- DSCR +10.0/10.0
- 1% rule +8.3/10.0
- ARV discount +7.5/15.0
- Livability +3.6/5.0
- Rent growth +2.5/5.0
- Condition / age +2.5/5.0
- Schools +1.5/10.0
- Appreciation +0.0/10.0
$115,000
🖨 Deal sheet 📄 Offer letter ✓ Due diligence
Listing remarks MLS
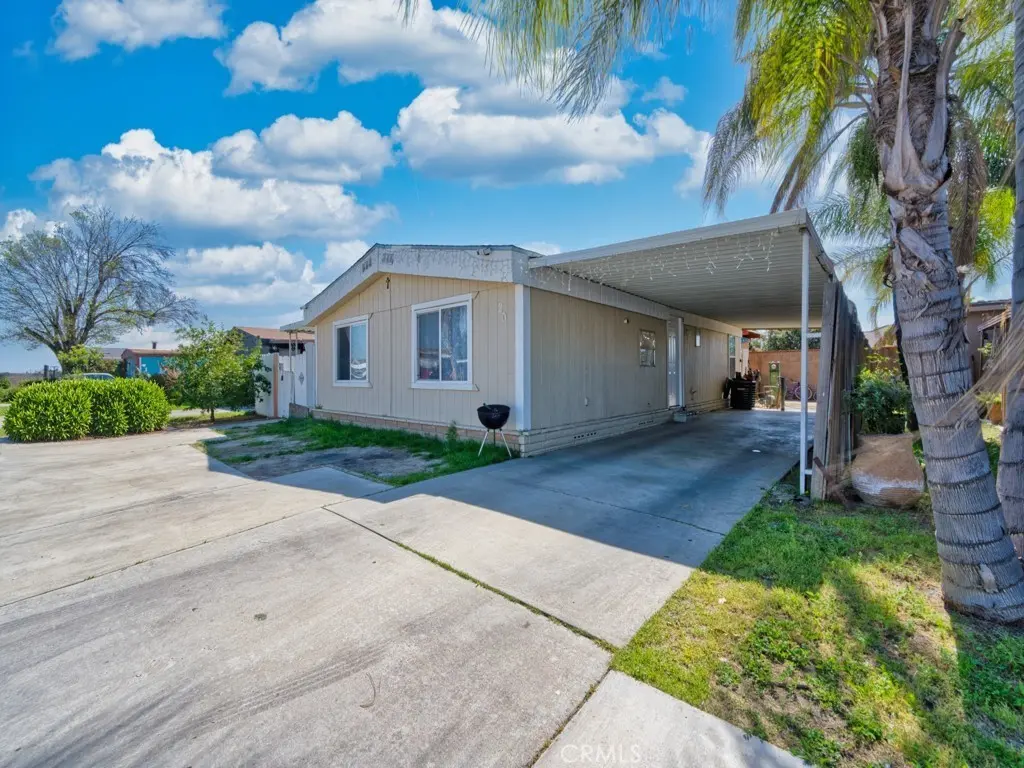
Pride of ownership shines throughout this well-maintained home at 700 S Shafter Ave #20. The property features updated flooring, newer windows, and fresh interior paint, creating a comfortable and inviting space for its next owners. The current family has lovingly cared for the home for several years and is ready to pass it on to another family to enjoy. The primary bedroom walk-in closet was removed to create a third room, offering additional flexible living space. Third room is unpermitted.
Key facts
- Community pool
- Built 1981
- Listed 73 days
Neighborhood map
What this means for you Summary
Snapshot
- This is a 2-bed/1.0-bath manufactured listed at $115k.
Deal economics
- At list price, monthly cash flow is $520 ($6k/yr) — positive.
- The deal already cash-flows at list — no discount required.
- Meets the 1% rule at list price ($2k rent vs $115k).
- Recommended offer: $108k (6.0% below list) — sets the bar for market timing.
- Cap rate 11.7% vs local median 2.7% in Shafter — top-decile yield for the area; either an underpriced asset or a hidden risk that comps aren't pricing in. Stress-test before assuming the spread holds.
Location & tenants
- Location reads 72/100 on livability (#185 in CA) — a middle-class / working-renter tenant base. Strengths: amenities A+, housing A+; Watch: health & safety C-, commute D+, cost of living D+.
- Richland Union Elementary (town): math 11% / reading 24% proficiency, ranked #480 of 517 in CA (top 93%) — low school quality limits family demand, transient renter base, plan for 1-2y turnover; 79% free/reduced lunch — lower-income household profile, screen leases tightly.
- Market conditions: 176 active listings in the ZIP; 4 comparable units currently listed for rent nearby; rentals lingering (median 44d on market — plan ~5-8 weeks vacancy on turnover, expect pricing pressure); 100% of comp listings sitting > 30 days — soft ceiling on asking rent; 3,244 units permitted in Kern County in 2024 (73 in 5+ unit buildings).
Forward outlook
- Local home prices are declining (-3.0%/yr); year-one equity from $795 of loan paydown is wiped out by about $3k of value loss. Plan a longer hold.
- Kern County population projected at +17% by 2050 — long-run rental-demand tailwind backs the buy-and-hold thesis.
- At projected returns (-3.0% appreciation + 3.0% rent growth), your $32k cash investment doubles in ~7 years — after that, you're playing with house money.
Negotiation context
- It's been on market 73 days — a 6% lower offer ($108k) is reasonable based on typical stale-listing flexibility.
- 2 sale attempts with the ask held roughly flat each time — persistent listings suggest the price (not the market) is what's stuck; bring a comps-based counter.
Risks & watch-outs
- Climate carrying-cost: moderate wildfire risk; extreme-heat days projected 7→19/yr by 2055 (HVAC capex compounding) — expect insurance premiums to compound above CPI over the hold.
Questions for the listing agent
- It's been on market 73 days. Have you received any prior offers? Is the seller open to a 6% concession, seller financing, or rate buy-down credit?
- Why hasn't it sold? Are there any deal-killer items the seller is aware of (foundation, flood, title, zoning, code violations)?
- Is there a deadline driving the sale (1031 exchange, divorce, estate, relocation)? That informs how much negotiation room exists.
- Schools are F-rated, which usually means shorter tenancies and higher turnover. Who's the typical renter profile here, and what's been the actual vacancy rate?
- What's the average days-on-market for RENTAL listings here right now (not sales)? A rising rental-DOM trend means longer vacancies and softer asking-rent achievability than the comps imply.
- What's the recent tenant-quality profile in this submarket — average credit score on applications, eviction rate, late-payment / NSF rate, and stable-employment percentage? A property-management company in the area should have these aggregated.
- How much new for-sale + rental construction is in the pipeline within 1–3 miles? Heavy new supply typically softens prices + rents 12–24 months out; constrained supply supports both.
Investment metrics
- 1% rule
- 1.33% ✓
- Cap rate
- 11.72%
- Cash-on-cash
- 19.38%
- DSCR
- 1.86
- GRM
- 6.2
CMA / ARV
No comps found within radius.
Projected returns pro-forma
-3.0% appreciation · 3.0% rent growth · sell at horizon
- IRR
- 11.3%
- Equity multiple
- 1.45×
- Total profit
- $14,446
- Equity at exit
- $17,147
- IRR
- 20.3%
- Equity multiple
- 2.71×
- Total profit
- $55,064
- Equity at exit
- $9,943
Cash invested: $32,200 (down + closing). Projections, not guarantees.
Landlord ↔ Tenant lean methodology
- Overall (STATE)
- 18 Strongly Tenant-Friendly
- State California
- 18 Strongly Tenant-Friendly · D+13
- County
- — inherits STATE
- City
- — inherits STATE
ZIP-level market 93263
- Home prices YoY
- -13.1%
- Active inventory
- 176
- Price-to-rent
- 6.2×
Monthly cashflow live
- Estimated rent
- $1,534 medium interval (Pro) →
- Mortgage (P&I)
- −$603
- Tax from tax record
- −$41 /mo · $488/yr
- Insurance
- −$48
- HOA
- −$0
- Vacancy / Maint / Mgmt
- −$322
- Net cashflow
- $520
Break-even live
UW: 25.0% down · 7.5% · 30yr · 1.5% tax · 5.0% vac · 8.0% maint · 8.0% mgmt
Financing live
Cash to close
- Down payment
- $28,750
- Closing costs
- $3,450
- Reserves months
- —
- Total cash needed
- —
Loan-product check · same deal, 3 products live
Conventional
25% down · 7.5% · 30yr
- Down + closing
- —
- Monthly P&I
- —
- Monthly cashflow
- —
- DSCR
- —
- Eligible?
- —
Personal DTI + credit; lowest rate.
DSCR
20% down · 8.5% · 30yr
- Down + closing
- —
- Monthly P&I
- —
- Monthly cashflow
- —
- DSCR
- —
- Eligible?
- —
No personal income docs; deal must DSCR.
Hard money
10% down · 12.0% · 12mo
- Down + closing
- —
- Monthly P&I
- —
- Monthly cashflow
- —
- DSCR
- —
- Eligible?
- —
Short-term bridge; refi at stabilization.
Rent comps 4 comps
| Address | Beds | Baths | Sqft | Rent | $/sqft | DOM | Units | Dist |
|---|---|---|---|---|---|---|---|---|
| 232 E Marengo Ave Unit Na Shafter, CA | 2.0 | 1.0 | 823 | $1,700 | $2.07 | 43d | 1 | 0.36mi |
| 354 E Euclid Ave Unit 356 Shafter, CA | 2.0 | 1.0 | 781 | $1,350 | $1.73 | 43d | 1 | 0.40mi |
| 489 W Marengo Ave Unit Na Shafter, CA | 2.0 | 1.0 | 1000 | $1,800 | $1.80 | 43d | 1 | 0.66mi |
| 615 Kern St Apt 16 Shafter, CA | 1.0 | 1.0 | 700 | $1,125 | $1.61 | 43d | 1 | 0.73mi |
Listing history 17 events
-
2026-06-18days on market $115,000 Active 73 DOM
-
2026-06-17days on market $115,000 Active 72 DOM
-
2026-06-16days on market $115,000 Active 71 DOM
-
2026-06-15days on market $115,000 Active 70 DOM
-
2026-06-14days on market $115,000 Active 68 DOM
-
2026-06-13days on market $115,000 Active 67 DOM
-
2026-06-10days on market $115,000 Active 65 DOM
-
2026-06-09days on market $115,000 Active 64 DOM
-
2026-06-08days on market $115,000 Active 63 DOM
-
2026-06-07days on market $115,000 Active 62 DOM
-
2026-06-05days on market $115,000 Active 59 DOM
-
2026-06-03days on market $115,000 Active 58 DOM
-
2026-06-03days on market $115,000 Active 57 DOM
-
2026-06-01days on market $115,000 Active 56 DOM
-
2026-05-31days on market $115,000 Active 55 DOM
-
2026-04-06$115,000 Active 497-char remark
Show marketing remark (497 chars)
Pride of ownership shines throughout this well-maintained home at 700 S Shafter Ave #20. The property features updated flooring, newer windows, and fresh interior paint, creating a comfortable and inviting space for its next owners. The current family has lovingly cared for the home for several years and is ready to pass it on to another family to enjoy. The primary bedroom walk-in closet was removed to create a third room, offering additional flexible living space. Third room is unpermitted.
-
2026-03-15$115,000 Active 497-char remark
Show marketing remark (497 chars)
Pride of ownership shines throughout this well-maintained home at 700 S Shafter Ave #20. The property features updated flooring, newer windows, and fresh interior paint, creating a comfortable and inviting space for its next owners. The current family has lovingly cared for the home for several years and is ready to pass it on to another family to enjoy. The primary bedroom walk-in closet was removed to create a third room, offering additional flexible living space. Third room is unpermitted.
ⓘ Source: listings_history table (triggers on properties + properties_extension) + one-shot
backfill from property_details.listing_events for pre-trigger history.
Tax reassessment forecast CA · Resets to sale price
- Current annual tax
- $488 · $41/mo
- Projected year-2 tax
- $874 · $73/mo
- Expected delta
- +$386/yr (+$32/mo · 79.0%)
ⓘ Screening estimate from a state-policy table — verify with the county assessor before closing.
Climate risk First Street
- Flood 3/10 Moderate FEMA zone X (unshaded) · 16% chance over 30 yrs
- Wildfire 5/10 Major
- Heat 8/10 Severe 7 d/yr ≥105°F today · 19 d/yr by 30 yrs out
- Wind 1/10 Low
- Air quality 10/10 Extreme 23 unhealthy d/yr today · 28 by 30 yrs out
Nearby sold comps map
Loading sold comps map…
Walkable amenities ~0.75 mi
Loading nearby amenities…
Taxation est. · year 1
- Rental income
- $18,406
- − Mortgage interest
- −$6,442
- − Property taxes
- −$488
- − Insurance
- −$575
- − Repairs & maintenance
- −$1,472
- − Management
- −$1,472
- − Depreciation
- −$3,345
- Taxable income
- $4,610
- Est. tax owed @ 24.0%
- −$1,106
- After-tax cash flow
- $5,134/yr
For passive investors: Depreciation is non-cash, so a rental often shows a tax loss while cash-flowing — sheltering income. Rental losses are passive: they offset passive income freely, and up to $25,000/yr can offset ordinary (W-2) income if you actively participate and your MAGI is under $100k (phasing out to $0 by $150k); unused losses carry forward. On sale, claimed depreciation is recaptured at up to 25%, and gains may owe capital-gains tax (a 1031 exchange can defer both). Figures are a year-1 estimate at your 24.0% rate — not tax advice; consult a CPA.
Schools (NCES district)
- District
- Richland Union Elementary
- NCES district ID
- 0621450
- Math proficiency
- 11% ▼ -15.00%
- Reading proficiency
- 24% ▼ -10.00%
- Median HH income
- $39,624
- Composite
- 14.8/100
- National rank
- #9386
- State rank
- #480 of 517 in CA
Livability — Shafter
- Score
- 72/100
- State rank
- #185
- US rank
- #6066
Category grades
Schools grade is shown separately in the Schools card above.
Census & demographics
- Census place
- Shafter, CA
- City population
- 23,423
- Population (ZIP)
- 23,423
Population outlook (Kern County) Hauer SSP2
- Today (2025)
- 947,286 people
- By 2030
- 978,984 · +3.3%
- By 2040
- 1,045,018 · +10.3%
- By 2050
- 1,105,232 · +16.7%
- By 2075
- 1,229,538 · +29.8%
- By 2100
- 1,238,059 · +30.7%
Race, ethnicity, and origin ACS 2023
- Neighborhood character
- Predominantly Hispanic (80%)
- Race & ethnicity
- Hispanic / Latino 80% Two or more races 35% White 17% Native American 1% Black 1% Asian 1%
- Hispanic origin (detail)
- Mexican 75% Puerto Rican 1%
- Common ancestry
- Italian 0%
- Foreign-born
- 25% · Canada
- Languages at home
- 42% English-only · Spanish 56% Arabic 1%
Political lean MEDSL · Kern
- 2024 margin
- Strong R (+21.1) · D 38.2% · R 59.3% · Other 2.5%
- 2008→2024 swing
- -3.3pp toward R · 2008: -17.8pp · 2024: -21.1pp
- All cycles
- 2024: R+21.1 2020: R+10.2 2016: R+15.0 2012: R+20.9 2008: R+17.8
Not yet ingested
- Civics
- —
Market trends
- HPI YoY
- ▼ -53.09%
- Current HPI
- 352.9878
- Rent YoY
- —
- Metro
- —
- State GDP YoY
- ▲ 3.21%
- F500 in state
- 116
Industry mix (Fortune 500 HQ in CA)
| Industry | F500 HQs | Revenue |
|---|---|---|
| Technology | 27 | $1,492B |
|
||
| Financial Services | 3 | $174B |
|
||
| Retail | 3 | $44B |
|
||
| Insurance | 3 | $26B |
|
||
| Media / Entertainment | 2 | $115B |
|
||
| Pharmaceuticals / Biotech | 2 | $62B |
|
||
Price history
+0.0% since first listed2 events — show timeline
- 2026-04-06 Listed $115,000 CRMLS
- 2026-03-15 Listed $115,000 GEMLS
Property tax history
+14.4%/yrLatest (2025): $488 · +5.0% YoY. Source: county tax records.
Cash-flow waterfall
monthlySold comps — $/sqft
last 12 mo · ≤1 miLoading sold comps…