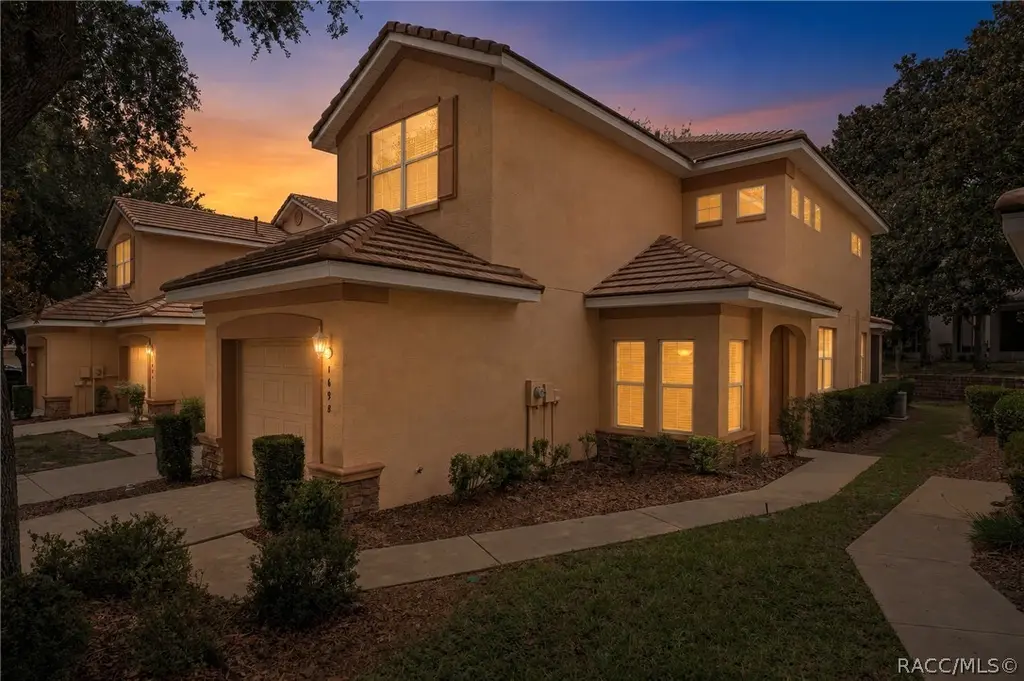
1698 W Spring Meadow Loop · Pine Ridge, FL
Flood risk 1/10 · Minimal
- FEMA flood zone
- X (unshaded)
- Chance of flooding over 30 yrs
- 0.0%
- Est. flood insurance / yr
- $507 – $1,088
Fire risk 3/10 · Minor
- Est. fire insurance / yr
- $947 – $1,759
Heat risk 9/10 · Severe
- Hot days now (above 108°F)
- 7 days/yr
- Hot days in 30 yrs
- 24 days/yr
Wind risk 9/10 · Severe
- Chance of severe wind over 30 yrs
- 99.0%
Air-quality risk 1/10 · Minimal
- Unhealthy air days now
- 0 days/yr
- Unhealthy air days in 30 yrs
- 0 days/yr
Risk factors via First Street. Map © Google.
Why this score? — see what drove the D+ grade
The composite is a weighted blend of 9 inputs, each scored 0–100. Each bar is that input's sub-score; the figure is the points it added to the 100-point composite (weight × sub-score).
- Cash flow +14.7/30.0
- ARV discount +10.2/15.0
- 1% rule +6.0/10.0
- DSCR +4.5/10.0
- Schools +4.1/10.0
- Livability +3.4/5.0
- Rent growth +2.5/5.0
- Condition / age +2.5/5.0
- Appreciation +0.0/10.0
$219,000
🖨 Deal sheet (PDF) 📄 Offer letter ✓ Due diligence
Listing remarks MLS
Bank owned foreclosure Brentwood Townhome for sale featuring 2 bedrooms, 2.5 bathrooms and a 1 car attached garage; 1655 sq ft living space; 8x20 screened porch; laundry closet upstairs; breakfast bar; kitchen eat-in nook; kitchen has microwave and dishwasher; gas hot water heater; master bathroom with dual sinks and large tiled shower. Priced to sell!
Key facts
- Gated community
- Natural light
- Screened porch
Tags
Property features AI
Finance
- Other: Subdivision: Citrus Hills - Brentwood
- HOA & community: Homeowners association with monthly fee of $182; Quarterly fee of $548.64; HOA includes cable TV, grounds maintenance, structure maintenance, and security
Exterior
- Parking: Attached garage with garage door opener; Concrete driveway; 1 total parking space (1 garage space)
- Security: Gated community; Smoke detector(s)
- Utilities: Public water; Public sewer
- Home design: Townhouse; Faces northeast
- Construction: Stucco construction; Block and slab foundation; Concrete and tile roof
- Exterior features: Sliding doors; Community pool; Gated community; Zero lot line; Paved private road (private maintained)
Interior
- Kitchen: Dishwasher; Electric oven; Microwave; Refrigerator
- Flooring: Carpet; Tile
- Bathrooms: 2 full bathrooms; 1 half bathroom
- Heating & cooling: Heat pump; Central air conditioning
- Interior features: Breakfast bar; Laminate countertops; Walk-in closet(s); Blinds and window coverings; Window treatments
- Laundry & utility: Washer; Dryer; Water heater
Neighborhood map
What this means for you Summary
Snapshot
- This is a 3-bed/2.5-bath townhouse listed at $219k.
Deal economics
- At list price, monthly cash flow is $56 ($675/yr) — positive.
- The deal already cash-flows at list — no discount required.
- Meets the 1% rule at list price ($2k rent vs $219k).
- Cap rate 6.6% vs local median 3.4% in Pine Ridge — top-decile yield for the area; either an underpriced asset or a hidden risk that comps aren't pricing in. Stress-test before assuming the spread holds.
Location & tenants
- Location reads 67/100 on livability (#565 in FL) — a middle-class / working-renter tenant base. Strengths: crime A+, housing A+, cost of living A-; Watch: health & safety C-, amenities F, commute F.
- Citrus (rural): math 49% / reading 50% proficiency, ranked #44 of 73 in FL (top 60%) — families likely to look elsewhere, expect single-tenant / working-renter base with shorter leases.
- Zoned schools: Forest Ridge Elementary School (math 55% / reading 59%, grade C+, #781 of 2,144 statewide, top 38%, 708 students, 67% FRL); Lecanto Middle School (math 49% / reading 49%, grade C-, #265 of 571 statewide, top 48%, 809 students, 55% FRL); Lecanto High School (math 46% / reading 53%, grade D, #179 of 667 statewide, top 29%, 1,630 students, 46% FRL) — zoned schools at 56% FRL track the district average.
- Market conditions: 199 active listings in the ZIP; 21 comparable units currently listed for rent nearby; rentals at typical pace (median 23d on market — plan ~3-4 weeks tenant-placement turnaround); 2,443 units permitted in Citrus County in 2024 (0 in 5+ unit buildings).
- At $2,408/mo this rent would consume 46% of the median local household income ($63k/yr) (locally 41% of renters already pay >50% of income on rent) — very limited rent-growth headroom before tenants either downsize or default.
Forward outlook
- Local home prices are declining (-3.0%/yr); year-one equity from $2k of loan paydown is wiped out by about $7k of value loss. Plan a longer hold.
- Citrus County population projected to shrink 10% by 2050 — rents likely to lag national; underwrite the cash flow, not the appreciation.
Negotiation context
- Only 9 days on market — expect competitive offers; lowballing is unlikely to land.
- 3 sale attempts since 19y ago with the ask held roughly flat each time — persistent listings suggest the price (not the market) is what's stuck; bring a comps-based counter.
- Current owner paid $78k; list at $219k implies a 181% gain — meaningful room to come down on a strong offer.
Risks & watch-outs
- Climate carrying-cost: severe wind risk, 99% chance of damaging wind over 30y; extreme-heat days projected 7→24/yr by 2055 (HVAC capex compounding) — expect insurance premiums to compound above CPI over the hold.
Questions for the listing agent
- What does the HOA fee cover, when was the last increase, and are there any pending special assessments or reserve-fund shortfalls?
- Is there a deadline driving the sale (1031 exchange, divorce, estate, relocation)? That informs how much negotiation room exists.
- Schools are F-rated, which usually means shorter tenancies and higher turnover. Who's the typical renter profile here, and what's been the actual vacancy rate?
- The area grade is low — what's the realistic commute time and amenity access for the typical tenant pool here? Any planned neighborhood developments (good or bad) we should know about?
- What's the average days-on-market for RENTAL listings here right now (not sales)? A rising rental-DOM trend means longer vacancies and softer asking-rent achievability than the comps imply.
- What's the recent tenant-quality profile in this submarket — average credit score on applications, eviction rate, late-payment / NSF rate, and stable-employment percentage? A property-management company in the area should have these aggregated.
- How much new for-sale + rental construction is in the pipeline within 1–3 miles? Heavy new supply typically softens prices + rents 12–24 months out; constrained supply supports both.
Investment metrics
- 1% rule
- 1.10% ✓
- Cap rate
- 6.60%
- Cash-on-cash
- 1.10%
- DSCR
- 1.05
- GRM
- 7.6
CMA / ARV
- ARV (on-the-fly)
- $232,820
- Comps found
- 4
Show comp detail 4 sales within ~0.75 mi
| Address | Dist | Beds/Ba | Sqft | Sold | Price | $/sf | Match |
|---|---|---|---|---|---|---|---|
| 1685 W Spring Meadow Loop | 0.04mi | 2/2.5 (-1) | 1,663 (0%) | 0mo | $227,000 | $137 | 93 |
| 1692 W Spring Meadow Loop | 0.01mi | 3/2.5 | 1,663 (0%) | 8mo | $230,000 | $138 | 92 |
| 1590 W Spring Meadow Loop | 0.08mi | 2/2.5 (-1) | 1,664 (+0%) | 8mo | $250,000 | $150 | 84 |
| 1560 W Sweet Oaks Ct | 0.18mi | 3/2.5 | 1,676 (+1%) | 17mo | $235,000 | $140 | 76 |
Match score weights: distance 35% · size 25% · config 20% · recency 20%. Top-matched comps best support the ARV.
Projected returns pro-forma
-3.0% appreciation · 3.0% rent growth · sell at horizon
- IRR
- -14.4%
- Equity multiple
- 0.48×
- Total profit
- $-31,665
- Equity at exit
- $32,654
- IRR
- -5.5%
- Equity multiple
- 0.64×
- Total profit
- $-21,983
- Equity at exit
- $18,935
Cash invested: $61,320 (down + closing). Projections, not guarantees.
Landlord ↔ Tenant lean methodology
- Overall (STATE)
- 87 Strongly Landlord-Friendly
- State Florida
- 87 Strongly Landlord-Friendly · R+3
- County
- — inherits STATE
- City
- — inherits STATE
ZIP-level market 34461
- Home prices YoY
- -10.2%
- Active inventory
- 199
- Price-to-rent
- 7.6×
Monthly cashflow live
- Estimated rent
- $2,408 high interval (Pro) →
- Mortgage (P&I)
- −$1,148
- Tax from tax record
- −$242 /mo · $2,907/yr
- Insurance
- −$91
- HOA
- −$364
- Vacancy / Maint / Mgmt
- −$506
- Net cashflow
- $56
Break-even live
Sensitivity live
| Price | -10% $180 | -5% $118 | +0% $56 | +5% $-6 | +10% $-68 |
|---|---|---|---|---|---|
| Rent | -10% $-134 | -5% $-39 | +0% $56 | +5% $151 | +10% $246 |
| Rate | -1.0pp $167 | -0.5pp $112 | base $56 | +0.5pp $-1 | +1.0pp $-58 |
UW: 25.0% down · 7.5% · 30yr · 1.5% tax · 5.0% vac · 8.0% maint · 8.0% mgmt
Financing live
Cash to close
- Down payment
- $54,750
- Closing costs
- $6,570
- Reserves months
- —
- Total cash needed
- —
Loan-product check · same deal, 3 products live
Conventional
25% down · 7.5% · 30yr
- Down + closing
- —
- Monthly P&I
- —
- Monthly cashflow
- —
- DSCR
- —
- Eligible?
- —
Personal DTI + credit; lowest rate.
DSCR
20% down · 8.5% · 30yr
- Down + closing
- —
- Monthly P&I
- —
- Monthly cashflow
- —
- DSCR
- —
- Eligible?
- —
No personal income docs; deal must DSCR.
Hard money
10% down · 12.0% · 12mo
- Down + closing
- —
- Monthly P&I
- —
- Monthly cashflow
- —
- DSCR
- —
- Eligible?
- —
Short-term bridge; refi at stabilization.
Rent comps 21 comps
| Address | Beds | Baths | Sqft | Rent | $/sqft | DOM | Units | Dist |
|---|---|---|---|---|---|---|---|---|
| 1658 W Spring Meadow Loop Lecanto, FL | 2.0 | 2.5 | 1359 | $1,775 | $1.31 | 23d | 1 | 0.05mi |
| 1610 W Spring Meadow Loop Lecanto, FL | 2.0 | 2.5 | 1359 | $2,700 | $1.99 | 23d | 1 | 0.09mi |
| 1973 N Ember Path Hernando, FL | 2.0 | 2.0 | 1786 | $2,800 | $1.57 | 23d | 1 | 0.22mi |
| 2443 N Andrea Pt Lecanto, FL | 3.0 | 2.5 | 1988 | $2,500 | $1.26 | 23d | 1 | 0.26mi |
| 1876 W Shanelle Path Lecanto, FL | 3.0 | 2.0 | 1675 | $2,100 | $1.25 | 23d | 1 | 0.42mi |
| 1933 W Shanelle Path Lecanto, FL | 3.0 | 2.0 | 1690 | $2,300 | $1.36 | 23d | 1 | 0.47mi |
| 1281 W Diamond Shore Loop Hernando, FL | 2.0 | 2.0 | 1686 | $3,000 | $1.78 | 23d | 1 | 0.57mi |
| 2131 N Pinecone Ave Lecanto, FL | 2.0 | 2.0 | 1438 | $2,000 | $1.39 | 23d | 1 | 0.63mi |
| 1240 W Diamond Shore Loop Hernando, FL | 2.0 | 2.0 | 1770 | $2,900 | $1.64 | 23d | 1 | 0.66mi |
| 1882 W Angelica Loop Lecanto, FL | 3.0 | 2.0 | 1706 | $1,900 | $1.11 | 23d | 1 | 0.70mi |
| 1020 W Rollingwood Ct Hernando, FL | 3.0 | 2.5 | 2146 | $3,400 | $1.58 | 23d | 1 | 0.78mi |
| 877 W Silver Meadow Loop Hernando, FL | 3.0 | 2.0 | 1637 | $2,500 | $1.53 | 23d | 1 | 0.84mi |
| 1984 W Marsten Ct Lecanto, FL | 3.0 | 2.0 | 1854 | $2,000 | $1.08 | 23d | 1 | 0.86mi |
| 12 Montana St Beverly Hills, FL | 2.0 | 1.0 | 1088 | $1,700 | $1.56 | 23d | 1 | 1.03mi |
| 1024 W Beagle Run Loop Hernando, FL | 3.0 | 2.5 | 2177 | $3,500 | $1.61 | 23d | 1 | 1.08mi |
| 209 S Tyler St Beverly Hills, FL | 2.0 | 2.0 | 1604 | $1,500 | $0.94 | 23d | 1 | 1.21mi |
| 95 S Desoto St Beverly Hills, FL | 2.0 | 2.0 | 1152 | $1,435 | $1.25 | 23d | 1 | 1.24mi |
| 3263 N Maidencane Dr Beverly Hills, FL | 2.0 | 1.0 | 1380 | $1,350 | $0.98 | 23d | 1 | 1.27mi |
| 703 W Sunbird Path Hernando, FL | 2.0 | 2.0 | 1298 | $1,700 | $1.31 | 23d | 1 | 1.29mi |
| 95 S Fillmore St Beverly Hills, FL | 2.0 | 1.0 | 1056 | $1,300 | $1.23 | 23d | 1 | 1.33mi |
| 1559 N Killebrew Pt Unit NA Hernando, FL | 3.0 | 2.0 | 1771 | $2,900 | $1.64 | 23d | 1 | 1.46mi |
HOA detail
- Monthly dues
- $364 · $4,368/yr
- Likely covers
- watergas
Listing history 8 events
-
2026-06-21days on market $219,000 Active 9 DOM
-
2026-06-19days on market $219,000 Active 7 DOM
-
2026-06-18days on market $219,000 Active 6 DOM
-
2026-06-17days on market $219,000 Active 5 DOM
-
2026-06-16days on market $219,000 Active 4 DOM
-
2026-06-15days on market $219,000 Active 3 DOM
-
2026-06-13remarks 687-char remark
-
2026-06-13$219,000 Active 1 DOM
ⓘ Source: listings_history table (triggers on properties + properties_extension) + one-shot
backfill from property_details.listing_events for pre-trigger history.
Tax reassessment forecast FL · Resets to sale price
- Current annual tax
- $2,907 · $242/mo
- Projected year-2 tax
- $2,907 · $242/mo
- Expected delta
- $0/yr ($0/mo · 0.0%)
ⓘ Screening estimate from a state-policy table — verify with the county assessor before closing.
Climate risk First Street
- Flood 1/10 Low FEMA zone X (unshaded) · 0% chance over 30 yrs
- Wildfire 3/10 Moderate
- Heat 9/10 Extreme 7 d/yr ≥108°F today · 24 d/yr by 30 yrs out
- Wind 9/10 Extreme 99% chance of damaging wind over 30 yrs
- Air quality 1/10 Low 0 unhealthy d/yr today · 0 by 30 yrs out
Nearby sold comps map
Loading sold comps map…
Walkable amenities ~0.75 mi
Loading nearby amenities…
Taxation est. · year 1
- Rental income
- $28,895
- − Mortgage interest
- −$12,267
- − Property taxes
- −$2,907
- − Insurance
- −$1,095
- − Repairs & maintenance
- −$2,312
- − Management
- −$2,312
- − HOA
- −$4,368
- − Depreciation
- −$6,371
- Taxable loss
- −$2,737
- Est. tax savings @ 24.0%
- +$657
- After-tax cash flow
- $1,332/yr
For passive investors: Depreciation is non-cash, so a rental often shows a tax loss while cash-flowing — sheltering income. Rental losses are passive: they offset passive income freely, and up to $25,000/yr can offset ordinary (W-2) income if you actively participate and your MAGI is under $100k (phasing out to $0 by $150k); unused losses carry forward. On sale, claimed depreciation is recaptured at up to 25%, and gains may owe capital-gains tax (a 1031 exchange can defer both). Figures are a year-1 estimate at your 24.0% rate — not tax advice; consult a CPA.
Schools (NCES district)
- District
- Citrus
- NCES district ID
- 1200270
- Math proficiency
- 49% ▼ -10.00%
- Reading proficiency
- 50% ▼ -6.00%
- Median HH income
- $38,618
- Composite
- 41.28/100
- National rank
- #3519
- State rank
- #44 of 73 in FL
Livability — Pine Ridge
- Score
- 67/100
- State rank
- #565
- US rank
- #10798
Category grades
Schools grade is shown separately in the Schools card above.
Census & demographics
- Census place
- Pine Ridge, FL
- County
- Citrus County · 111,314 people
- City population
- 18,514
- Metro
- Homosassa Springs, FL
- Population (ZIP)
- 13,377
- Household income
- $63,418
- Rent vs Own
- Severe rent burden
- 41.0
Population outlook (Citrus County) Hauer SSP2
- Today (2025)
- 138,622 people
- By 2030
- 136,886 · -1.3%
- By 2040
- 132,009 · -4.8%
- By 2050
- 125,196 · -9.7%
- By 2075
- 108,570 · -21.7%
- By 2100
- 84,454 · -39.1%
Race, ethnicity, and origin ACS 2023
- Neighborhood character
- Predominantly White (87%)
- Race & ethnicity
- White 87% Hispanic / Latino 8% Two or more races 7% Black 2%
- Hispanic origin (detail)
- Puerto Rican 3%
- Common ancestry
- Romanian 3% Lithuanian 3% Slovak 3%
- Foreign-born
- 8% · Canada, Jamaica
- Languages at home
- 95% English-only · Spanish 3%
Political lean MEDSL · Citrus
- 2024 margin
- Solid R (+45.9) · D 26.8% · R 72.6%
- 2008→2024 swing
- -29.8pp toward R · 2008: -16.1pp · 2024: -45.9pp
- All cycles
- 2024: R+45.9 2020: R+41.0 2016: R+39.7 2012: R+21.9 2008: R+16.1
Not yet ingested
- Civics
- —
Market trends
- HPI YoY
- ▼ -29.48%
- Current HPI
- 258.0866
- Rent YoY
- —
- Metro
- Homosassa Springs, FL
- State GDP YoY
- ▲ 3.28%
- F500 in state
- 36
Industry mix (Fortune 500 HQ in FL)
| Industry | F500 HQs | Revenue |
|---|---|---|
| Industrial Technology | 2 | $29B |
|
||
| Insurance | 2 | $17B |
|
||
| Retail | 1 | $60B |
|
||
| Technology Distribution | 1 | $58B |
|
||
| Homebuilding | 1 | $35B |
|
||
| Technology Manufacturing | 1 | $35B |
|
||
Price history
+32.8% since first listed6 events — show timeline
- 2026-06-12 Listed $219,000 RACC
- 2013-01-17 Sold (MLS) $78,000 RACC
- 2012-12-07 Listed $79,900 RACC
- 2008-04-14 Sold (MLS) $154,000 RACC
- 2008-03-01 Sold (Public Records) $154,000 Public Records
- 2007-05-17 Listed $164,900 RACC
Property tax history
+6.4%/yrLatest (2025): $2,907 · +6.2% YoY. Source: county tax records.
Cash-flow waterfall
monthlySold comps — $/sqft
last 12 mo · ≤1 miLoading sold comps…