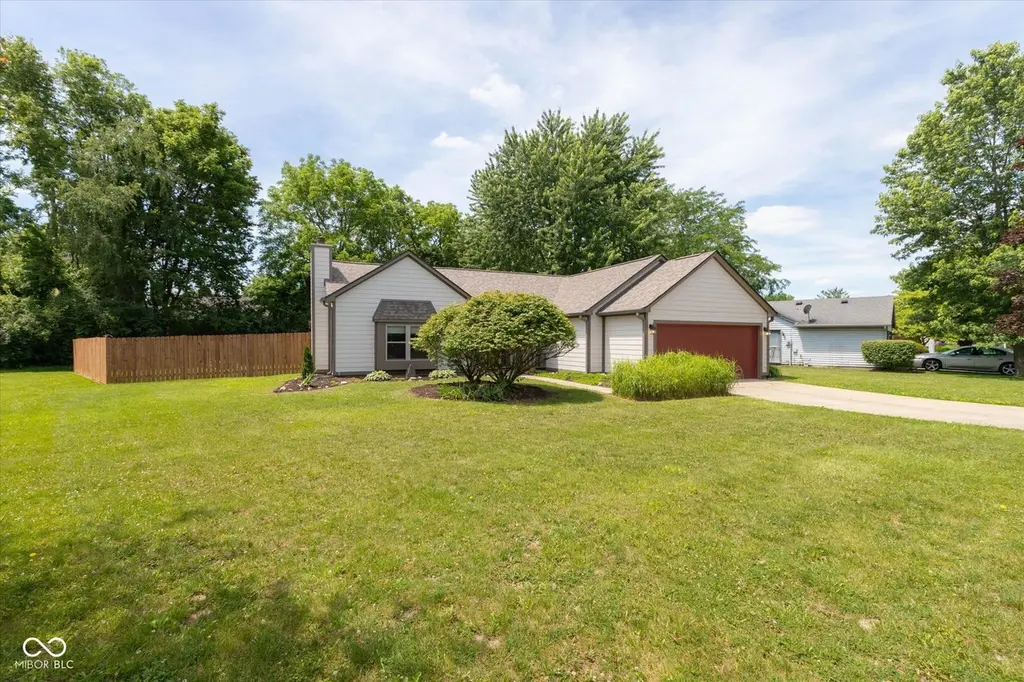
6445 Muirfield Way · Indianapolis city (balance), IN
Flood risk 1/10 · Minimal
- FEMA flood zone
- X (unshaded)
- Chance of flooding over 30 yrs
- 0.0%
- Est. flood insurance / yr
- $507 – $1,088
Fire risk 1/10 · Minimal
- Est. fire insurance / yr
- $717 – $1,331
Heat risk 3/10 · Minor
- Hot days now (above 102°F)
- 7 days/yr
- Hot days in 30 yrs
- 19 days/yr
Wind risk 2/10 · Minimal
- Chance of severe wind over 30 yrs
- 1.0%
Air-quality risk 3/10 · Minor
- Unhealthy air days now
- 2 days/yr
- Unhealthy air days in 30 yrs
- 3 days/yr
Risk factors via First Street. Map © Google.
Why this score? — see what drove the D grade
The composite is a weighted blend of 9 inputs, each scored 0–100. Each bar is that input's sub-score; the figure is the points it added to the 100-point composite (weight × sub-score).
- Cash flow +13.3/30.0
- ARV discount +8.4/15.0
- DSCR +4.0/10.0
- Schools +4.0/10.0
- Rent growth +3.4/5.0
- 1% rule +3.2/10.0
- Livability +2.5/5.0
- Condition / age +2.5/5.0
- Appreciation +0.0/10.0
$285,000
🖨 Deal sheet 📄 Offer letter ✓ Due diligence
Listing remarks MLS
WOW-WHAT A NICE HOME! FORMER MODEL RANCH ON LG CORNER LOT W LOTS OF LANDSCAPING! 1979 SQ. FT.-GREAT RM 24X20 ADDED IN '93. BEAMED CATH CEILINGS RECESSED LIGHTING & OPENING INTO LG KITCHEN 16X13 WHICH AJOINS LIVING RM W/ FIREPLACE. SOUTHWEST DECOR VERY NICELY DONE W/NEUTRAL COLORS. LARGE ENTRY W/CERAMIC TILE. MSTR BDR HAS SEP. DRESSING TABLE AREA. EXCLUDE SHELVING IN MSTR BDR + 3RD BDR + BASKETBALL GOAL. 3 TIER DECK W/PRIVACY FENCE & GAR DEN.
Key facts
- New flooring
- New appliances
- Corner lot
Tags
Property features AI
Exterior
- Parking: Attached 2-car garage
- Utilities: Public water; Municipal sewer connected; Solid waste service available
- Home design: Single-family residence; One story
- Construction: Cement siding; Crawl space foundation
- Exterior features: Covered patio/porch; Mini barn; Complete privacy fencing; Corner lot with small trees
Interior
- Kitchen: Electric cooktop; Dishwasher; Microwave with hood; Refrigerator
- Bedrooms: Three main-level bedrooms; Primary bedroom with walk-in closet
- Bathrooms: Two full bathrooms; Primary bathroom with double sinks
- Heating & cooling: Electric heating; Forced air; Heat pump; Central air conditioning
- Interior features: Vaulted ceilings; Eat-in kitchen; Walk-in closets
- Laundry & utility: Dedicated laundry room
Neighborhood map
What this means for you Summary
Snapshot
- This is a 3-bed/1.0-bath single-family listed at $285k.
Deal economics
- At list price, monthly cash flow is $2 ($19/yr) — positive.
- The deal already cash-flows at list — no discount required.
- To meet the 1% rule (rent ≥ 1% of price), the offer needs to be $234k (17.9% below list).
- Recommended offer: $234k (17.9% below list) — sets the bar for 1% rule.
- Cap rate 6.3% vs local median 4.4% in Indianapolis city (balance) — top-decile yield for the area; either an underpriced asset or a hidden risk that comps aren't pricing in. Stress-test before assuming the spread holds.
Location & tenants
- Location reads: area grade D — affects rentability + tenant quality, not the cash-flow math above.
- Franklin Township Community School Corporation (urban): math 42% / reading 47% proficiency, ranked #87 of 301 in IN (top 29%) — families likely to look elsewhere, expect single-tenant / working-renter base with shorter leases.
- Zoned schools: Franklin Central High School (math 41% / reading 69%, grade C, #77 of 369 statewide, top 21%, 3,319 students, 46% FRL) — zoned schools average 46% FRL vs 29% district-wide (17 pts higher); higher-poverty schools than district average — tighter screening recommended.
- Market conditions: Rents rising (+3.8%/yr); 261 active listings in the ZIP; 9 comparable units currently listed for rent nearby; rentals leasing fast (median 4d on market — plan ~1-2 weeks tenant-placement turnaround); solid renter incomes; 1,906 units permitted in Marion County in 2024 (621 in 5+ unit buildings).
- This rent runs 36% of the median local income ($79k/yr) — at the standard rent-burdened threshold; future hikes will face affordability resistance.
Forward outlook
- Local home prices are declining (-3.0%/yr); year-one equity from $2k of loan paydown is wiped out by about $9k of value loss. Plan a longer hold.
- Marion County population projected at +18% by 2050 — long-run rental-demand tailwind backs the buy-and-hold thesis.
Negotiation context
- Only 6 days on market — expect competitive offers; lowballing is unlikely to land.
- 2 sale attempts since 26y ago with the ask held roughly flat each time — persistent listings suggest the price (not the market) is what's stuck; bring a comps-based counter.
- Current owner paid $133k; list at $285k implies a 114% gain — meaningful room to come down on a strong offer.
Questions for the listing agent
- Is there a deadline driving the sale (1031 exchange, divorce, estate, relocation)? That informs how much negotiation room exists.
- The area grade is low — what's the realistic commute time and amenity access for the typical tenant pool here? Any planned neighborhood developments (good or bad) we should know about?
- What's the average days-on-market for RENTAL listings here right now (not sales)? A rising rental-DOM trend means longer vacancies and softer asking-rent achievability than the comps imply.
- What's the recent tenant-quality profile in this submarket — average credit score on applications, eviction rate, late-payment / NSF rate, and stable-employment percentage? A property-management company in the area should have these aggregated.
- How much new for-sale + rental construction is in the pipeline within 1–3 miles? Heavy new supply typically softens prices + rents 12–24 months out; constrained supply supports both.
Investment metrics
- 1% rule
- 0.82% ✗
- Cap rate
- 6.30%
- Cash-on-cash
- 0.02%
- DSCR
- 1.00
- GRM
- 10.1
CMA / ARV
- ARV (on-the-fly)
- $290,913
- Comps found
- 12
Show comp detail 12 sales within ~0.75 mi
| Address | Dist | Beds/Ba | Sqft | Sold | Price | $/sf | Match |
|---|---|---|---|---|---|---|---|
| 7746 Inverness Dr | 0.31mi | 4/1.5 (+1) | 1,914 (-3%) | 3mo | $189,900 | $99 | 71 |
| 7841 Rosebush Dr | 0.28mi | 4/2.5 (+1) | 2,000 (+1%) | 6mo | $295,000 | $148 | 70 |
| 7843 Almond Dr | 0.18mi | 4/2.5 (+1) | 1,868 (-6%) | 3mo | $275,000 | $147 | 69 |
| 7724 Gordon Way | 0.37mi | 4/2.0 (+1) | 2,060 (+4%) | 5mo | $249,900 | $121 | 63 |
| 6543 Calla Lily Dr | 0.25mi | 4/2.5 (+1) | 2,111 (+7%) | 8mo | $325,000 | $154 | 60 |
| 6351 E Southport Rd | 0.73mi | 3/1.0 | 1,968 (-1%) | 7mo | $249,900 | $127 | 59 |
| 7822 Mullis Ln | 0.24mi | 4/2.5 (+1) | 2,232 (+13%) | 1mo | $315,000 | $141 | 56 |
| 6235 Bunting Dr | 0.56mi | 4/2.5 (+1) | 2,053 (+4%) | 3mo | $334,900 | $163 | 54 |
| 8126 Milender Blvd | 0.62mi | 3/2.0 | 1,822 (-8%) | 1mo | $310,000 | $170 | 53 |
| 8056 Milender Blvd | 0.55mi | 2/2.0 (-1) | 1,888 (-5%) | 7mo | $278,000 | $147 | 52 |
| 8122 Amarillo Dr | 0.40mi | 3/2.0 | 1,722 (-13%) | 5mo | $270,000 | $157 | 51 |
| 8437 Crosser Dr | 0.74mi | 4/2.5 (+1) | 1,964 (-1%) | 7mo | $283,000 | $144 | 48 |
Match score weights: distance 35% · size 25% · config 20% · recency 20%. Top-matched comps best support the ARV.
Projected returns pro-forma
-3.0% appreciation · 3.78% rent growth · sell at horizon
- IRR
- -15.5%
- Equity multiple
- 0.45×
- Total profit
- $-44,268
- Equity at exit
- $42,494
- IRR
- -5.8%
- Equity multiple
- 0.61×
- Total profit
- $-30,859
- Equity at exit
- $24,642
Cash invested: $79,800 (down + closing). Projections, not guarantees.
Landlord ↔ Tenant lean methodology
- Overall (STATE)
- 90 Strongly Landlord-Friendly
- State Indiana
- 90 Strongly Landlord-Friendly · R+11
- County
- — inherits STATE
- City
- — inherits STATE
ZIP-level market 46237
- Rents YoY
- 3.8%
- Active inventory
- 261
- Price-to-rent
- 10.1×
Monthly cashflow live
- Estimated rent
- $2,341 high interval (Pro) →
- Mortgage (P&I)
- −$1,495
- Tax from tax record
- −$234 /mo · $2,809/yr
- Insurance
- −$119
- HOA
- −$0
- Vacancy / Maint / Mgmt
- −$492
- Net cashflow
- $2
Break-even live
UW: 25.0% down · 7.5% · 30yr · 1.5% tax · 5.0% vac · 8.0% maint · 8.0% mgmt
Financing live
Cash to close
- Down payment
- $71,250
- Closing costs
- $8,550
- Reserves months
- —
- Total cash needed
- —
Loan-product check · same deal, 3 products live
Conventional
25% down · 7.5% · 30yr
- Down + closing
- —
- Monthly P&I
- —
- Monthly cashflow
- —
- DSCR
- —
- Eligible?
- —
Personal DTI + credit; lowest rate.
DSCR
20% down · 8.5% · 30yr
- Down + closing
- —
- Monthly P&I
- —
- Monthly cashflow
- —
- DSCR
- —
- Eligible?
- —
No personal income docs; deal must DSCR.
Hard money
10% down · 12.0% · 12mo
- Down + closing
- —
- Monthly P&I
- —
- Monthly cashflow
- —
- DSCR
- —
- Eligible?
- —
Short-term bridge; refi at stabilization.
Rent comps 9 comps
| Address | Beds | Baths | Sqft | Rent | $/sqft | DOM | Units | Dist |
|---|---|---|---|---|---|---|---|---|
| 7825 Jaclyn Dr Indianapolis, IN | 3.0 | 2.0 | 1244 | $1,875 | $1.51 | 4d | 1 | 0.34mi |
| 6404 Amarillo Way Indianapolis, IN | 3.0 | 2.0 | 1494 | $1,845 | $1.23 | 4d | 1 | 0.34mi |
| 8107 Southern Trails Pl Indianapolis, IN | 4.0 | 2.0 | 1746 | $2,000 | $1.15 | 4d | 1 | 0.40mi |
| 7703 Janel Ct Indianapolis, IN | 4.0 | 2.5 | 1824 | $4,950 | $2.71 | 23d | 1 | 0.43mi |
| 6210 Carrie Cir Indianapolis, IN | 3.0 | 2.0 | 1226 | $1,890 | $1.54 | 4d | 1 | 0.44mi |
| 8130 Amble Way Indianapolis, IN | 3.0 | 2.5 | 2144 | $1,955 | $0.91 | 4d | 1 | 0.48mi |
| 7925 Carlington Rd Indianapolis, IN | 2.0 | 2.0 | 1455 | $2,079 | $1.43 | 1d | 17 | 1.07mi |
| 5945 Arlo Dr Indianapolis, IN | 1.0–3.0 | 1.0–2.0 | 1092 | $2,020 | $1.85 | 1d | 12 | 1.12mi |
| 7251 Windsor Lakes Dr Indianapolis, IN | 1.0–3.0 | 1.0–2.0 | 1103 | $1,800 | $1.63 | 1d | 36 | 1.28mi |
Listing history 6 events
-
2026-06-13statusdays on market $285,000 Pending 6 DOM
-
2026-06-10price $285,000 Active 4 DOM
-
2026-06-09days on market $295,000 Active 4 DOM
-
2026-06-08days on market $295,000 Active 3 DOM
-
2026-06-07remarks 699-char remark
-
2026-06-07$295,000 Active 2 DOM
ⓘ Source: listings_history table (triggers on properties + properties_extension) + one-shot
backfill from property_details.listing_events for pre-trigger history.
Tax reassessment forecast IN · Partial reset (capped growth)
- Current annual tax
- $2,809 · $234/mo
- Projected year-2 tax
- $2,809 · $234/mo
- Expected delta
- $0/yr ($0/mo · 0.0%)
ⓘ Screening estimate from a state-policy table — verify with the county assessor before closing.
Climate risk First Street
- Flood 1/10 Low FEMA zone X (unshaded) · 0% chance over 30 yrs
- Wildfire 1/10 Low
- Heat 3/10 Moderate 7 d/yr ≥102°F today · 19 d/yr by 30 yrs out
- Wind 2/10 Low 100% chance of damaging wind over 30 yrs
- Air quality 3/10 Moderate 2 unhealthy d/yr today · 3 by 30 yrs out
Nearby sold comps map
Loading sold comps map…
Walkable amenities ~0.75 mi
Loading nearby amenities…
Taxation est. · year 1
- Rental income
- $28,087
- − Mortgage interest
- −$15,964
- − Property taxes
- −$2,809
- − Insurance
- −$1,425
- − Repairs & maintenance
- −$2,247
- − Management
- −$2,247
- − Depreciation
- −$8,291
- Taxable loss
- −$4,897
- Est. tax savings @ 24.0%
- +$1,175
- After-tax cash flow
- $1,195/yr
For passive investors: Depreciation is non-cash, so a rental often shows a tax loss while cash-flowing — sheltering income. Rental losses are passive: they offset passive income freely, and up to $25,000/yr can offset ordinary (W-2) income if you actively participate and your MAGI is under $100k (phasing out to $0 by $150k); unused losses carry forward. On sale, claimed depreciation is recaptured at up to 25%, and gains may owe capital-gains tax (a 1031 exchange can defer both). Figures are a year-1 estimate at your 24.0% rate — not tax advice; consult a CPA.
Schools (NCES district)
- District
- Franklin Township Community School Corporation
- NCES district ID
- 1803750
- Math proficiency
- 42% ▼ -12.00%
- Reading proficiency
- 47% ▼ -6.00%
- Median HH income
- $67,825
- Composite
- 39.91/100
- National rank
- #3852
- State rank
- #87 of 301 in IN
Livability — Indianapolis city (balance)
No livability data for this city. (Only ~50 U.S. cities are tracked.)
Census & demographics
- Census place
- Indianapolis city (balance), IN
- County
- Marion County · 998,460 people
- City population
- 881,119
- Metro
- Indianapolis-Carmel-Anderson, IN
- Population (ZIP)
- 43,473
- Household income
- $79,078
- Rent vs Own
- Severe rent burden
- 1245.0
Population outlook (Marion County) Hauer SSP2
- Today (2025)
- 1,025,572 people
- By 2030
- 1,065,727 · +3.9%
- By 2040
- 1,141,577 · +11.3%
- By 2050
- 1,208,920 · +17.9%
- By 2075
- 1,367,288 · +33.3%
- By 2100
- 1,438,201 · +40.2%
Race, ethnicity, and origin ACS 2023
- Neighborhood character
- Predominantly White (71%)
- Race & ethnicity
- White 71% Asian 13% Hispanic / Latino 7% Two or more races 6% Black 5%
- Hispanic origin (detail)
- Mexican 6%
- Common ancestry
- Italian 2% Lithuanian 2% Romanian 2%
- Foreign-born
- 12% · Canada, Philippines
- Languages at home
- 84% English-only · Other Asian/Pacific 5% Spanish 5% Other Indo-European 4%
Political lean MEDSL · Marion
- 2024 margin
- Strong D (+27.7) · D 63.0% · R 35.3% · Other 1.7%
- 2008→2024 swing
- -0.7pp no change · 2008: 28.4pp · 2024: 27.7pp
- All cycles
- 2024: D+27.7 2020: D+29.1 2016: D+22.8 2012: D+22.2 2008: D+28.4
Not yet ingested
- Civics
- —
Market trends
- HPI YoY
- ▼ -180.33%
- Current HPI
- 238.9661
- Rent YoY
- ▲ 3.78%
- Metro
- Indianapolis-Carmel-Anderson, IN
- State GDP YoY
- ▲ 2.90%
- F500 in state
- 18
Industry mix (Fortune 500 HQ in IN)
| Industry | F500 HQs | Revenue |
|---|---|---|
| Industrial Machinery | 2 | $37B |
|
||
| Healthcare | 1 | $177B |
|
||
| Pharmaceuticals | 1 | $45B |
|
||
| Metals / Steel | 1 | $18B |
|
||
| Agriculture | 1 | $17B |
|
||
| Packaging | 1 | $12B |
|
||
Price history
+136.2% since first listed4 events — show timeline
- 2026-06-05 Listed $295,000 MIBOR as Distributed by MLS Grid
- 2001-01-02 Sold (Public Records) $132,893 Public Records
- 2000-11-30 Sold (MLS) $124,900 MIBOR as Distributed by MLS Grid
- 2000-09-22 Listed $124,900 MIBOR as Distributed by MLS Grid
Property tax history
+6.8%/yrLatest (2025): $2,809 · -4.4% YoY. Source: county tax records.
Cash-flow waterfall
monthlySold comps — $/sqft
last 12 mo · ≤1 miLoading sold comps…