 107-Plex
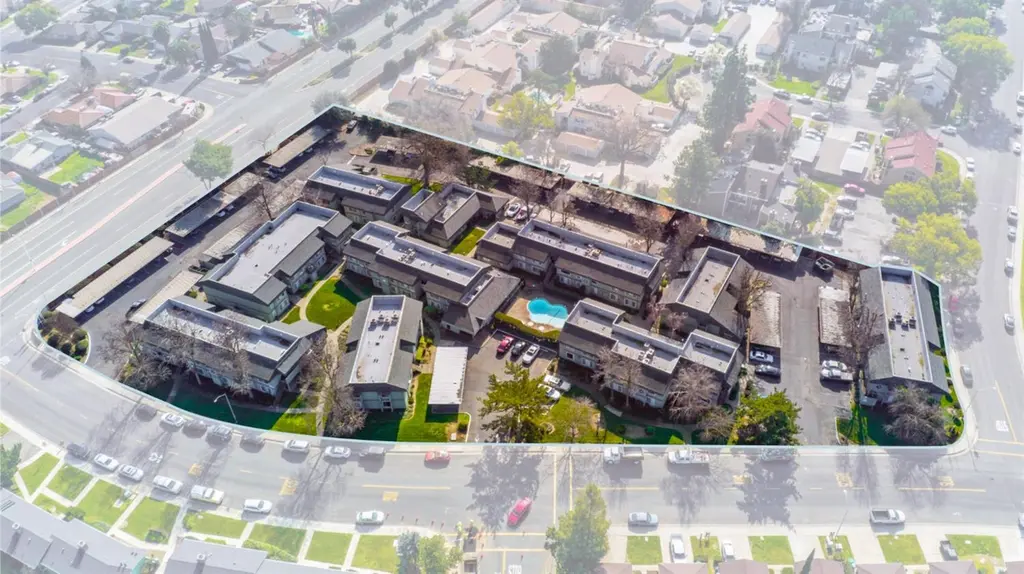
602 - 710 Wimbledon Dr · Lodi, CA
Flood risk 1/10 · Minimal
- FEMA flood zone
- X (shaded)
- Chance of flooding over 30 yrs
- 0.0%
- Est. flood insurance / yr
- $507 – $1,088
Fire risk 4/10 · Minor
- Est. fire insurance / yr
- $659 – $1,223
Heat risk 7/10 · Major
- Hot days now (above 102°F)
- 7 days/yr
- Hot days in 30 yrs
- 15 days/yr
Wind risk 1/10 · Minimal
- Chance of severe wind over 30 yrs
- —
Air-quality risk 10/10 · Severe
- Unhealthy air days now
- 27 days/yr
- Unhealthy air days in 30 yrs
- 29 days/yr
Risk factors via First Street. Map © Google.
Why this score? — see what drove the D- grade
The composite is a weighted blend of 9 inputs, each scored 0–100. Each bar is that input's sub-score; the figure is the points it added to the 100-point composite (weight × sub-score).
- Cash flow +14.1/30.0
- ARV discount +7.5/15.0
- DSCR +4.3/10.0
- Rent growth +3.0/5.0
- Livability +2.9/5.0
- 1% rule +2.7/10.0
- Schools +2.7/10.0
- Condition / age +2.5/5.0
- Appreciation +0.0/10.0
$18,000,000
🖨 Deal sheet 📄 Offer letter ✓ Due diligence
Multi-family units
County records classify this as Multi-Family (5+ Unit). Listing-text estimate: 107 units. confirmed
5+ unit building — per-unit beds/baths from public records are typically unavailable; the breakdown below (if shown) is an estimate from the listing text.
Listing remarks
The Wimbledon Square Apartments is a 107-unit multifamily community located at 602-710 Wimbledon Drive in Lodi, California. Built between 1978 and 1979, the property consists of 10 buildings situated on approximately 3.52 acres totaling approximately 68,311 SF. Unit sizes range from 560 to 774 square feet, catering to strong workforce housing demand in a market characterized by steady population growth and relative affordability. The property is strategically located near the Reynolds Ranch master-planned retail development, one of Lodi's most significant commercial hubs. Reynolds Ranch is anchored by national retailers including Costco Wholesale, The Home Depot, Sprouts Farmers Market, Dic
Key facts
- Renovated units
- 2.01 acre lot
- 151 parking spots
Tags
Neighborhood map
What this means for you Summary
Snapshot
- This is a 107 × 1-bed/1-bath units multifamily listed at $18.00M.
Deal economics
- At list price, monthly cash flow is $3k ($34k/yr) — positive. Per door: $26/mo.
- The deal already cash-flows at list — no discount required.
- To meet the 1% rule (rent ≥ 1% of price), the offer needs to be $13.79M (23.4% below list).
- Recommended offer: $13.79M (23.4% below list) — sets the bar for 1% rule.
- Cap rate 6.5% vs local median 3.0% in Lodi — top-decile yield for the area; either an underpriced asset or a hidden risk that comps aren't pricing in. Stress-test before assuming the spread holds.
Location & tenants
- Location reads 58/100 on livability (#730 in CA) — a working-class tenant base; expect higher turnover. Strengths: housing A; Watch: schools C-, crime F, amenities F.
- Lodi Unified (urban): math 24% / reading 36% proficiency, ranked #325 of 517 in CA (top 63%) — families likely to look elsewhere, expect single-tenant / working-renter base with shorter leases.
- Market conditions: Rents rising (+2.1%/yr); 163 active listings in the ZIP; solid renter incomes; 3,779 units permitted in San Joaquin County in 2024 (0 in 5+ unit buildings).
- At $137,929/mo this rent would consume 2015% of the median local household income ($82k/yr) (locally 1918% of renters already pay >50% of income on rent) — very limited rent-growth headroom before tenants either downsize or default.
Forward outlook
- Local home prices are declining (-3.0%/yr); year-one equity from $124k of loan paydown is wiped out by about $540k of value loss. Plan a longer hold.
- San Joaquin County population projected at +17% by 2050 — long-run rental-demand tailwind backs the buy-and-hold thesis.
Negotiation context
- It's been on market 62 days — a 6% lower offer ($16.92M) is reasonable based on typical stale-listing flexibility.
- Current owner paid $7.45M; list at $18.00M implies a 142% gain — meaningful room to come down on a strong offer.
Risks & watch-outs
- Climate carrying-cost: extreme-heat days projected 7→15/yr by 2055 (HVAC capex compounding) — expect insurance premiums to compound above CPI over the hold.
Questions for the listing agent
- It's been on market 62 days. Have you received any prior offers? Is the seller open to a 23% concession, seller financing, or rate buy-down credit?
- Can we see the unit-by-unit rent roll, current vacancy, and any below-market leases? What's the average tenancy length?
- What capital expenditures (roof, boiler, parking lot, exteriors) have been made in the last 5 years, and what's planned in the next 2?
- Built in 1978 — when were the roof, HVAC, electrical panel, plumbing, and water heater last replaced?
- Why hasn't it sold? Are there any deal-killer items the seller is aware of (foundation, flood, title, zoning, code violations)?
- Is there a deadline driving the sale (1031 exchange, divorce, estate, relocation)? That informs how much negotiation room exists.
- Crime grade is F in this area — have there been break-ins, vandalism, or insurance claims at this property in the last 3 years? What carrier currently insures it and at what premium?
- The area grade is low — what's the realistic commute time and amenity access for the typical tenant pool here? Any planned neighborhood developments (good or bad) we should know about?
- What's the average days-on-market for RENTAL listings here right now (not sales)? A rising rental-DOM trend means longer vacancies and softer asking-rent achievability than the comps imply.
- What's the recent tenant-quality profile in this submarket — average credit score on applications, eviction rate, late-payment / NSF rate, and stable-employment percentage? A property-management company in the area should have these aggregated.
- How much new apartment / multifamily construction is in the pipeline within 1–3 miles? Heavy new supply (>2% of stock underway) typically softens rents 12–24 months out; light construction supports rent growth.
Investment metrics
- 1% rule
- 0.77% ✗
- Cap rate
- 6.48%
- Cash-on-cash
- 0.67%
- DSCR
- 1.03
- GRM
- 10.9
CMA / ARV
No comps found within radius.
Projected returns pro-forma
-3.0% appreciation · 2.08% rent growth · sell at horizon
- IRR
- -16.2%
- Equity multiple
- 0.43×
- Total profit
- $-2,874,402
- Equity at exit
- $2,683,859
- IRR
- -9.4%
- Equity multiple
- 0.44×
- Total profit
- $-2,820,440
- Equity at exit
- $1,556,311
Cash invested: $5,040,000 (down + closing). Projections, not guarantees.
Landlord ↔ Tenant lean methodology
- Overall (STATE)
- 18 Strongly Tenant-Friendly
- State California
- 18 Strongly Tenant-Friendly · D+13
- County
- — inherits STATE
- City
- — inherits STATE
ZIP-level market 95240
- Rents YoY
- 2.1%
- Active inventory
- 163
- Price-to-rent
- 1163.6×
Monthly cashflow live
- Estimated rent
- $137,929 medium interval (Pro) →
- Mortgage (P&I)
- −$94,394
- Tax from tax record
- −$4,275 /mo · $51,299/yr
- Insurance
- −$7,500
- HOA
- −$0
- Vacancy / Maint / Mgmt
- −$28,965
- Net cashflow
- $2,795
Break-even live
107-unit breakdown (identical units grouped — click to expand)
| Units | Beds | Baths | Est. rent |
|---|---|---|---|
| 107× units | 1 | 1 | $137,923 |
| #1 | 1 | 1 | $1,289 |
| #2 | 1 | 1 | $1,289 |
| #3 | 1 | 1 | $1,289 |
| #4 | 1 | 1 | $1,289 |
| #5 | 1 | 1 | $1,289 |
| #6 | 1 | 1 | $1,289 |
| #7 | 1 | 1 | $1,289 |
| #8 | 1 | 1 | $1,289 |
| #9 | 1 | 1 | $1,289 |
| #10 | 1 | 1 | $1,289 |
| #11 | 1 | 1 | $1,289 |
| #12 | 1 | 1 | $1,289 |
| #13 | 1 | 1 | $1,289 |
| #14 | 1 | 1 | $1,289 |
| #15 | 1 | 1 | $1,289 |
| #16 | 1 | 1 | $1,289 |
| #17 | 1 | 1 | $1,289 |
| #18 | 1 | 1 | $1,289 |
| #19 | 1 | 1 | $1,289 |
| #20 | 1 | 1 | $1,289 |
| #21 | 1 | 1 | $1,289 |
| #22 | 1 | 1 | $1,289 |
| #23 | 1 | 1 | $1,289 |
| #24 | 1 | 1 | $1,289 |
| #25 | 1 | 1 | $1,289 |
| #26 | 1 | 1 | $1,289 |
| #27 | 1 | 1 | $1,289 |
| #28 | 1 | 1 | $1,289 |
| #29 | 1 | 1 | $1,289 |
| #30 | 1 | 1 | $1,289 |
| #31 | 1 | 1 | $1,289 |
| #32 | 1 | 1 | $1,289 |
| #33 | 1 | 1 | $1,289 |
| #34 | 1 | 1 | $1,289 |
| #35 | 1 | 1 | $1,289 |
| #36 | 1 | 1 | $1,289 |
| #37 | 1 | 1 | $1,289 |
| #38 | 1 | 1 | $1,289 |
| #39 | 1 | 1 | $1,289 |
| #40 | 1 | 1 | $1,289 |
| #41 | 1 | 1 | $1,289 |
| #42 | 1 | 1 | $1,289 |
| #43 | 1 | 1 | $1,289 |
| #44 | 1 | 1 | $1,289 |
| #45 | 1 | 1 | $1,289 |
| #46 | 1 | 1 | $1,289 |
| #47 | 1 | 1 | $1,289 |
| #48 | 1 | 1 | $1,289 |
| #49 | 1 | 1 | $1,289 |
| #50 | 1 | 1 | $1,289 |
| #51 | 1 | 1 | $1,289 |
| #52 | 1 | 1 | $1,289 |
| #53 | 1 | 1 | $1,289 |
| #54 | 1 | 1 | $1,289 |
| #55 | 1 | 1 | $1,289 |
| #56 | 1 | 1 | $1,289 |
| #57 | 1 | 1 | $1,289 |
| #58 | 1 | 1 | $1,289 |
| #59 | 1 | 1 | $1,289 |
| #60 | 1 | 1 | $1,289 |
| #61 | 1 | 1 | $1,289 |
| #62 | 1 | 1 | $1,289 |
| #63 | 1 | 1 | $1,289 |
| #64 | 1 | 1 | $1,289 |
| #65 | 1 | 1 | $1,289 |
| #66 | 1 | 1 | $1,289 |
| #67 | 1 | 1 | $1,289 |
| #68 | 1 | 1 | $1,289 |
| #69 | 1 | 1 | $1,289 |
| #70 | 1 | 1 | $1,289 |
| #71 | 1 | 1 | $1,289 |
| #72 | 1 | 1 | $1,289 |
| #73 | 1 | 1 | $1,289 |
| #74 | 1 | 1 | $1,289 |
| #75 | 1 | 1 | $1,289 |
| #76 | 1 | 1 | $1,289 |
| #77 | 1 | 1 | $1,289 |
| #78 | 1 | 1 | $1,289 |
| #79 | 1 | 1 | $1,289 |
| #80 | 1 | 1 | $1,289 |
| #81 | 1 | 1 | $1,289 |
| #82 | 1 | 1 | $1,289 |
| #83 | 1 | 1 | $1,289 |
| #84 | 1 | 1 | $1,289 |
| #85 | 1 | 1 | $1,289 |
| #86 | 1 | 1 | $1,289 |
| #87 | 1 | 1 | $1,289 |
| #88 | 1 | 1 | $1,289 |
| #89 | 1 | 1 | $1,289 |
| #90 | 1 | 1 | $1,289 |
| #91 | 1 | 1 | $1,289 |
| #92 | 1 | 1 | $1,289 |
| #93 | 1 | 1 | $1,289 |
| #94 | 1 | 1 | $1,289 |
| #95 | 1 | 1 | $1,289 |
| #96 | 1 | 1 | $1,289 |
| #97 | 1 | 1 | $1,289 |
| #98 | 1 | 1 | $1,289 |
| #99 | 1 | 1 | $1,289 |
| #100 | 1 | 1 | $1,289 |
| #101 | 1 | 1 | $1,289 |
| #102 | 1 | 1 | $1,289 |
| #103 | 1 | 1 | $1,289 |
| #104 | 1 | 1 | $1,289 |
| #105 | 1 | 1 | $1,289 |
| #106 | 1 | 1 | $1,289 |
| #107 | 1 | 1 | $1,289 |
| Total (107 units) | $137,929 | ||
UW: 25.0% down · 7.5% · 30yr · 1.5% tax · 5.0% vac · 8.0% maint · 8.0% mgmt
Financing live
Cash to close
- Down payment
- $4,500,000
- Closing costs
- $540,000
- Reserves months
- —
- Total cash needed
- —
Loan-product check · same deal, 3 products live
Conventional
25% down · 7.5% · 30yr
- Down + closing
- —
- Monthly P&I
- —
- Monthly cashflow
- —
- DSCR
- —
- Eligible?
- —
Personal DTI + credit; lowest rate.
DSCR
20% down · 8.5% · 30yr
- Down + closing
- —
- Monthly P&I
- —
- Monthly cashflow
- —
- DSCR
- —
- Eligible?
- —
No personal income docs; deal must DSCR.
Hard money
10% down · 12.0% · 12mo
- Down + closing
- —
- Monthly P&I
- —
- Monthly cashflow
- —
- DSCR
- —
- Eligible?
- —
Short-term bridge; refi at stabilization.
Listing history 1 events
-
2014-07-22soldstatus $7,450,000
ⓘ Source: listings_history table (triggers on properties + properties_extension) + one-shot
backfill from property_details.listing_events for pre-trigger history.
Tax reassessment forecast CA · Resets to sale price
- Current annual tax
- $51,299 · $4,275/mo
- Projected year-2 tax
- $136,800 · $11,400/mo
- Expected delta
- +$85,501/yr (+$7,125/mo · 166.7%)
ⓘ Screening estimate from a state-policy table — verify with the county assessor before closing.
Climate risk First Street
- Flood 1/10 Low FEMA zone X (shaded) · 0% chance over 30 yrs
- Wildfire 4/10 Moderate
- Heat 7/10 Severe 7 d/yr ≥102°F today · 15 d/yr by 30 yrs out
- Wind 1/10 Low
- Air quality 10/10 Extreme 27 unhealthy d/yr today · 29 by 30 yrs out
Nearby sold comps map
Loading sold comps map…
Walkable amenities ~0.75 mi
Loading nearby amenities…
Taxation est. · year 1
- Rental income
- $1,655,148
- − Mortgage interest
- −$1,008,280
- − Property taxes
- −$51,299
- − Insurance
- −$90,000
- − Repairs & maintenance
- −$132,412
- − Management
- −$132,412
- − Depreciation
- −$523,636
- Taxable loss
- −$282,891
- Est. tax savings @ 24.0%
- +$67,894
- After-tax cash flow
- $101,434/yr
For passive investors: Depreciation is non-cash, so a rental often shows a tax loss while cash-flowing — sheltering income. Rental losses are passive: they offset passive income freely, and up to $25,000/yr can offset ordinary (W-2) income if you actively participate and your MAGI is under $100k (phasing out to $0 by $150k); unused losses carry forward. On sale, claimed depreciation is recaptured at up to 25%, and gains may owe capital-gains tax (a 1031 exchange can defer both). Figures are a year-1 estimate at your 24.0% rate — not tax advice; consult a CPA.
Schools (NCES district)
- District
- Lodi Unified
- NCES district ID
- 0622230
- Math proficiency
- 24% ▼ -8.00%
- Reading proficiency
- 36% ▼ -8.00%
- Median HH income
- $57,165
- Composite
- 26.84/100
- National rank
- #7108
- State rank
- #325 of 517 in CA
Livability — Lodi
- Score
- 58/100
- State rank
- #730
- US rank
- #21523
Category grades
Schools grade is shown separately in the Schools card above.
Census & demographics
- Census place
- Lodi, CA
- County
- San Joaquin County · 729,570 people
- City population
- 78,944
- Metro
- Stockton, CA
- Population (ZIP)
- 50,517
- Household income
- $82,137
- Rent vs Own
- Severe rent burden
- 1918.0
Population outlook (San Joaquin County) Hauer SSP2
- Today (2025)
- 796,965 people
- By 2030
- 828,849 · +4.0%
- By 2040
- 885,611 · +11.1%
- By 2050
- 929,798 · +16.7%
- By 2075
- 994,578 · +24.8%
- By 2100
- 971,291 · +21.9%
Race, ethnicity, and origin ACS 2023
- Neighborhood character
- Diverse neighborhood (Simpson 0.63)
- Race & ethnicity
- Hispanic / Latino 48% White 35% Two or more races 26% Asian 12% Native American 1%
- Hispanic origin (detail)
- Mexican 44% Puerto Rican 1%
- Common ancestry
- Italian 3% Lithuanian 1% Russian 1%
- Foreign-born
- 25% · Canada
- Languages at home
- 55% English-only · Spanish 35% Other Indo-European 7% Tagalog/Filipino 1%
Political lean MEDSL · San Joaquin
- 2024 margin
- Toss-up / Even · D 48.0% · R 48.9% · Other 3.0%
- 2008→2024 swing
- -11.6pp toward R · 2008: 10.7pp · 2024: -0.9pp
- All cycles
- 2024: R+0.9 2020: D+13.9 2016: D+12.9 2012: D+8.9 2008: D+10.7
Not yet ingested
- Civics
- —
Market trends
- HPI YoY
- ▼ -469.68%
- Current HPI
- 320.685
- Rent YoY
- ▲ 2.08%
- Metro
- Stockton, CA
- State GDP YoY
- ▲ 3.21%
- F500 in state
- 116
Industry mix (Fortune 500 HQ in CA)
| Industry | F500 HQs | Revenue |
|---|---|---|
| Technology | 27 | $1,492B |
|
||
| Financial Services | 3 | $174B |
|
||
| Retail | 3 | $44B |
|
||
| Insurance | 3 | $26B |
|
||
| Media / Entertainment | 2 | $115B |
|
||
| Pharmaceuticals / Biotech | 2 | $62B |
|
||
Price history
1 event — show timeline
- 2014-07-22 Sold (Public Records) $7,450,000 Public Records
Property tax history
+0.2%/yrLatest (2025): $51,299 · +2.4% YoY. Source: county tax records.
Cash-flow waterfall
monthlySold comps — $/sqft
last 12 mo · ≤1 miLoading sold comps…