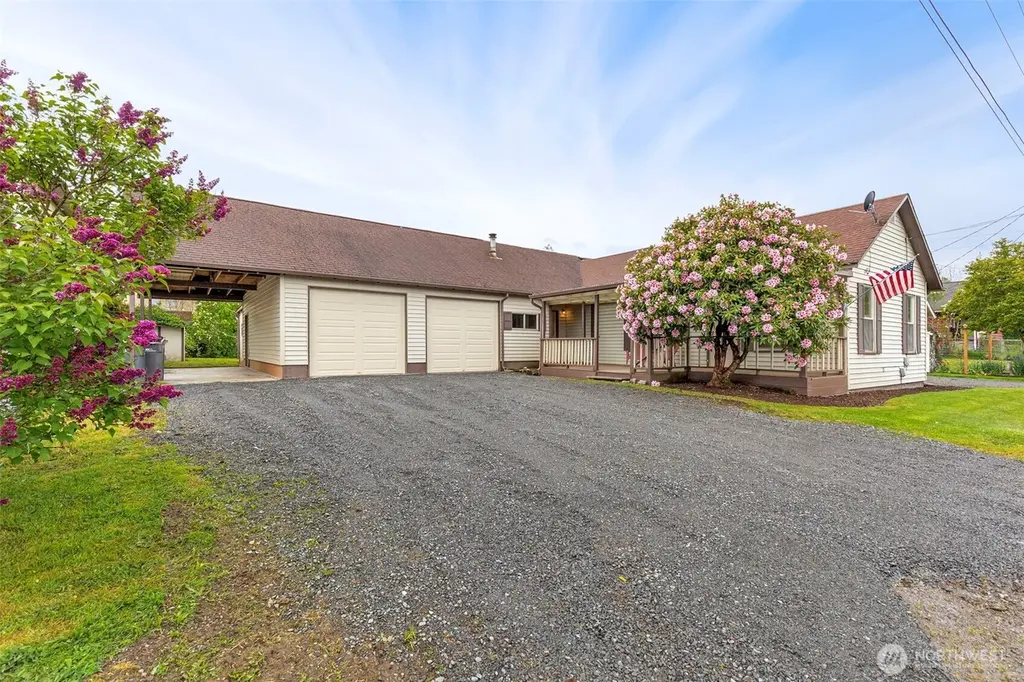
1851 NE Pacific Ave NE · Keyport, WA
Flood risk 1/10 · Minimal
- FEMA flood zone
- X (unshaded)
- Chance of flooding over 30 yrs
- 0.0%
- Est. flood insurance / yr
- $507 – $1,088
Fire risk 1/10 · Minimal
- Est. fire insurance / yr
- $604 – $1,122
Heat risk 3/10 · Minor
- Hot days now (above 86°F)
- 7 days/yr
- Hot days in 30 yrs
- 16 days/yr
Wind risk 1/10 · Minimal
- Chance of severe wind over 30 yrs
- —
Air-quality risk 6/10 · Moderate
- Unhealthy air days now
- 9 days/yr
- Unhealthy air days in 30 yrs
- 9 days/yr
Risk factors via First Street. Map © Google.
Why this score? — see what drove the C+ grade
The composite is a weighted blend of 9 inputs, each scored 0–100. Each bar is that input's sub-score; the figure is the points it added to the 100-point composite (weight × sub-score).
- Cash flow +17.2/30.0
- ARV discount +15.0/15.0
- Appreciation +7.3/10.0
- DSCR +5.4/10.0
- Schools +5.4/10.0
- 1% rule +4.0/10.0
- Livability +3.2/5.0
- Rent growth +2.5/5.0
- Condition / age +2.5/5.0
$499,000
🖨 Deal sheet 📄 Offer letter ✓ Due diligence
Listing remarks
Spacious and beautifully updated 4-bedroom home offering room to live, work, and entertain with ease. Fresh updates throughout give this home a clean, modern feel while maintaining its warmth and charm. Enjoy your morning coffee or unwind in the evening on the inviting covered porch—perfect for year-round relaxation. The expansive layout provides flexibility for larger households, home offices, or guest space. Outside, the property truly shines with a large garage, additional carport, and ample parking for your RV or boat—ideal for those who value both convenience and adventure. Located in the Waterfront community of Keyport, the dock and boat launch are just steps away! Easy c
Key facts
- Covered porch
- Large garage
- Dock
Tags
Property features AI
Finance
- Other: Located in county zoning jurisdiction
- Financial info: Acceptable financing: Cash, Conventional, FHA, VA
- HOA & community: Community features include a boat launch
Exterior
- Parking: Attached garage; Attached carport; Driveway parking; Uncovered parking for 3 vehicles; 3 covered spaces; RV parking available; Garage approximately 840 sq ft
- Security: Partially fenced
- Utilities: Public water (KPUD); Sewer connected (KPUD); Power by PSE; Energy sources: Electric and oil; Electric water heater
- Home design: Single family residence; 1.5-story house; Main-level entry; Built on lot; Average condition; Facing level topography
- Construction: Metal/vinyl exterior; Composition roof; Poured concrete foundation; Effective year built 1930
- Exterior features: Deck; Patio; Partially fenced yard; Outbuildings; Garden space; RV parking; Gas available; Paved site
Interior
- Kitchen: Dishwasher; Microwave; Refrigerator; Stove/Range
- Bedrooms: 4 bedrooms total — 1 on the main level, 3 on the upper level
- Flooring: Laminate flooring
- Bathrooms: 1 full bathroom (main level) with bathtub and shower
- Heating & cooling: Forced air heating; No central cooling
- Interior features: Dining room; Fireplace (gas); Water heater
- Laundry & utility: Utility room on main level; Water heater located in main floor laundry room
Neighborhood map
What this means for you Summary
Snapshot
- This is a 3-bed/3.0-bath single-family listed at $499k.
Deal economics
- At list price, monthly cash flow is $354 ($4k/yr) — positive.
- The deal already cash-flows at list — no discount required.
- To meet the 1% rule (rent ≥ 1% of price), the offer needs to be $450k (9.8% below list).
- Recommended offer: $450k (9.8% below list) — sets the bar for 1% rule.
Location & tenants
- Location reads 63/100 on livability (#398 in WA) — a middle-class / working-renter tenant base. Strengths: health & safety A+, crime A, housing B; Watch: employment C-, amenities F, commute F.
- North Kitsap School District (suburban): math 53% / reading 65% proficiency, ranked #54 of 291 in WA (top 19%) — acceptable for families but not a draw, mixed tenant base, ~2y average lease.
- Zoned schools: Hilder Pearson Elementary (286 students, 33% FRL); North Kitsap High School (1,063 students, 29% FRL).
- Market conditions: 3 active listings in the ZIP; 1 comparable units currently listed for rent nearby; 1,294 units permitted in Kitsap County in 2024 (302 in 5+ unit buildings).
Forward outlook
- In year one you build about $26k of equity ($3k loan paydown + $23k appreciation (4.5% local appreciation)).
- Kitsap County population projected at +8% by 2050 — modest demand growth; plan on rents tracking national, not racing it.
- At projected returns (4.5% appreciation + 3.0% rent growth), your $140k cash investment doubles in ~5 years — after that, you're playing with house money.
- By year 2, paydown + projected appreciation supports a ~$42k cash-out refi (75% LTV) — recoverable capital for the next deal without selling this one.
Negotiation context
- It's been on market 40 days — a 3% lower offer ($484k) is reasonable based on typical stale-listing flexibility.
Risks & watch-outs
- Watch-outs: built in 1930 — expect roof / HVAC / electrical / plumbing capex.
Questions for the listing agent
- It's been on market 40 days. Have you received any prior offers? Is the seller open to a 10% concession, seller financing, or rate buy-down credit?
- Built in 1930 — when were the roof, HVAC, electrical panel, plumbing, and water heater last replaced?
- Is there a deadline driving the sale (1031 exchange, divorce, estate, relocation)? That informs how much negotiation room exists.
- Schools are D-rated, which usually means shorter tenancies and higher turnover. Who's the typical renter profile here, and what's been the actual vacancy rate?
- What's the average days-on-market for RENTAL listings here right now (not sales)? A rising rental-DOM trend means longer vacancies and softer asking-rent achievability than the comps imply.
- What's the recent tenant-quality profile in this submarket — average credit score on applications, eviction rate, late-payment / NSF rate, and stable-employment percentage? A property-management company in the area should have these aggregated.
- How much new for-sale + rental construction is in the pipeline within 1–3 miles? Heavy new supply typically softens prices + rents 12–24 months out; constrained supply supports both.
Investment metrics
- 1% rule
- 0.90% ✗
- Cap rate
- 7.14%
- Cash-on-cash
- 3.04%
- DSCR
- 1.14
- GRM
- 9.2
CMA / ARV
- ARV (median comp)
- $685,045
- List price
- $499,000
- Delta
- -27.16%
- Verdict
- UNDERPRICED
- Comps
- 20 within 1.0 mi
Show comp detail 4 sales within ~0.75 mi
| Address | Dist | Beds/Ba | Sqft | Sold | Price | $/sf | Match |
|---|---|---|---|---|---|---|---|
| 15465 Elwha Ter NE | 0.12mi | 4/2.5 (+1) | 2,212 (-2%) | 22mo | $700,000 | $316 | 66 |
| 1274 NE State Hwy 308 | 0.49mi | 4/2.5 (+1) | 2,302 (+2%) | 12mo | $855,000 | $371 | 57 |
| 16068 Virginia Point Rd NE | 0.68mi | 4/2.5 (+1) | 2,390 (+6%) | 23mo | $900,000 | $377 | 32 |
| 15801 Virginia Point Rd NE | 0.71mi | 2/2.0 (-1) | 2,570 (+14%) | 21mo | $975,000 | $379 | 17 |
Match score weights: distance 35% · size 25% · config 20% · recency 20%. Top-matched comps best support the ARV.
Projected returns pro-forma
4.52% appreciation · 3.0% rent growth · sell at horizon
- IRR
- 14.3%
- Equity multiple
- 1.89×
- Total profit
- $123,896
- Equity at exit
- $268,331
- IRR
- 15.2%
- Equity multiple
- 3.59×
- Total profit
- $361,768
- Equity at exit
- $451,578
Cash invested: $139,720 (down + closing). Projections, not guarantees.
Landlord ↔ Tenant lean methodology
- Overall (STATE)
- 28 Tenant-Leaning
- State Washington
- 28 Tenant-Leaning · D+8
- County
- — inherits STATE
- City
- — inherits STATE
ZIP-level market 98345
- Home prices YoY
- 1.3%
- Active inventory
- 3
- Price-to-rent
- 9.2×
Monthly cashflow live
- Estimated rent
- $4,500 medium interval (Pro) →
- Mortgage (P&I)
- −$2,617
- Tax from tax record
- −$376 /mo · $4,515/yr
- Insurance
- −$208
- HOA
- −$0
- Vacancy / Maint / Mgmt
- −$945
- Net cashflow
- $354
Break-even live
UW: 25.0% down · 7.5% · 30yr · 1.5% tax · 5.0% vac · 8.0% maint · 8.0% mgmt
Financing live
Cash to close
- Down payment
- $124,750
- Closing costs
- $14,970
- Reserves months
- —
- Total cash needed
- —
Loan-product check · same deal, 3 products live
Conventional
25% down · 7.5% · 30yr
- Down + closing
- —
- Monthly P&I
- —
- Monthly cashflow
- —
- DSCR
- —
- Eligible?
- —
Personal DTI + credit; lowest rate.
DSCR
20% down · 8.5% · 30yr
- Down + closing
- —
- Monthly P&I
- —
- Monthly cashflow
- —
- DSCR
- —
- Eligible?
- —
No personal income docs; deal must DSCR.
Hard money
10% down · 12.0% · 12mo
- Down + closing
- —
- Monthly P&I
- —
- Monthly cashflow
- —
- DSCR
- —
- Eligible?
- —
Short-term bridge; refi at stabilization.
Rent comps 1 comps
| Address | Beds | Baths | Sqft | Rent | $/sqft | DOM | Units | Dist |
|---|---|---|---|---|---|---|---|---|
| 16725 Brauer Rd NE Poulsbo, WA | 4.0 | 2.5 | 2000 | $4,500 | $2.25 | 43d | 1 | 0.81mi |
Listing history 6 events
-
2026-06-07statusdays on market $499,000 Pending 40 DOM
-
2026-06-02days on market $499,000 Active Under Contract 39 DOM
-
2026-06-01days on market $499,000 Active Under Contract 38 DOM
-
2026-05-31days on market $499,000 Active Under Contract 37 DOM
-
2026-05-30days on market $499,000 Active Under Contract 36 DOM
-
2026-04-24$499,000 Active
ⓘ Source: listings_history table (triggers on properties + properties_extension) + one-shot
backfill from property_details.listing_events for pre-trigger history.
Tax reassessment forecast WA · Resets to sale price
- Current annual tax
- $4,515 · $376/mo
- Projected year-2 tax
- $4,890 · $408/mo
- Expected delta
- +$375/yr (+$31/mo · 8.3%)
ⓘ Screening estimate from a state-policy table — verify with the county assessor before closing.
Climate risk First Street
- Flood 1/10 Low FEMA zone X (unshaded) · 0% chance over 30 yrs
- Wildfire 1/10 Low
- Heat 3/10 Moderate 7 d/yr ≥86°F today · 16 d/yr by 30 yrs out
- Wind 1/10 Low
- Air quality 6/10 Major 9 unhealthy d/yr today · 9 by 30 yrs out
Nearby sold comps map
Loading sold comps map…
Walkable amenities ~0.75 mi
Loading nearby amenities…
Taxation est. · year 1
- Rental income
- $54,000
- − Mortgage interest
- −$27,952
- − Property taxes
- −$4,515
- − Insurance
- −$2,495
- − Repairs & maintenance
- −$4,320
- − Management
- −$4,320
- − Depreciation
- −$14,516
- Taxable loss
- −$4,118
- Est. tax savings @ 24.0%
- +$988
- After-tax cash flow
- $5,236/yr
For passive investors: Depreciation is non-cash, so a rental often shows a tax loss while cash-flowing — sheltering income. Rental losses are passive: they offset passive income freely, and up to $25,000/yr can offset ordinary (W-2) income if you actively participate and your MAGI is under $100k (phasing out to $0 by $150k); unused losses carry forward. On sale, claimed depreciation is recaptured at up to 25%, and gains may owe capital-gains tax (a 1031 exchange can defer both). Figures are a year-1 estimate at your 24.0% rate — not tax advice; consult a CPA.
Schools (NCES district)
- District
- North Kitsap School District
- NCES district ID
- 5305760
- Math proficiency
- 53% ▼ -1.00%
- Reading proficiency
- 65% ▲ 1.00%
- Median HH income
- $68,919
- Composite
- 53.68/100
- National rank
- #3092
- State rank
- #54 of 291 in WA
Livability — Keyport
- Score
- 63/100
- State rank
- #398
- US rank
- #15828
Category grades
Schools grade is shown separately in the Schools card above.
Census & demographics
- Census place
- Keyport, WA
- City population
- 272
- Population (ZIP)
- 272
Population outlook (Kitsap County) Hauer SSP2
- Today (2025)
- 277,525 people
- By 2030
- 285,040 · +2.7%
- By 2040
- 294,957 · +6.3%
- By 2050
- 300,622 · +8.3%
- By 2075
- 315,580 · +13.7%
- By 2100
- 304,340 · +9.7%
Race, ethnicity, and origin ACS 2023
- Neighborhood character
- Predominantly White (78%)
- Race & ethnicity
- White 78% Hispanic / Latino 11% Two or more races 9% Pacific Islander 5% Asian 3%
- Hispanic origin (detail)
- Mexican 11%
- Common ancestry
- Lithuanian 24% Portuguese 8% Iranian 6%
- Languages at home
- 86% English-only · Spanish 10% Tagalog/Filipino 3%
Political lean MEDSL · Kitsap
- 2024 margin
- Strong D (+20.9) · D 58.8% · R 37.9% · Other 3.3%
- 2008→2024 swing
- +8.6pp toward D · 2008: 12.3pp · 2024: 20.9pp
- All cycles
- 2024: D+20.9 2020: D+18.1 2016: D+11.6 2012: D+11.1 2008: D+12.3
Not yet ingested
- Civics
- —
Market trends
- HPI YoY
- ▲ 4.52%
- Current HPI
- 353.6216
- Rent YoY
- —
- Metro
- —
- State GDP YoY
- ▲ 4.65%
- F500 in state
- 22
Industry mix (Fortune 500 HQ in WA)
| Industry | F500 HQs | Revenue |
|---|---|---|
| Retail | 2 | $269B |
|
||
| Technology / Retail | 1 | $638B |
|
||
| Technology | 1 | $245B |
|
||
| Telecommunications | 1 | $38B |
|
||
| Food / Beverage | 1 | $36B |
|
||
| Automotive / Trucks | 1 | $34B |
|
||
Price history
2 events — show timeline
- 2026-06-04 Pending — NWMLS as Distributed by MLS Grid
- 2026-04-24 Listed $499,000 NWMLS as Distributed by MLS Grid
Property tax history
+3.7%/yrLatest (2026): $4,515 · -0.2% YoY. Source: county tax records.
Cash-flow waterfall
monthlySold comps — $/sqft
last 12 mo · ≤1 miLoading sold comps…