1210 Stephen Dr #2 · Panama City, FL
Flood risk 1/10 · Minimal
- FEMA flood zone
- X (unshaded)
- Chance of flooding over 30 yrs
- 0.0%
- Est. flood insurance / yr
- $507 – $1,088
Fire risk 2/10 · Minimal
- Est. fire insurance / yr
- $947 – $1,759
Heat risk 10/10 · Severe
- Hot days now (above 105°F)
- 7 days/yr
- Hot days in 30 yrs
- 21 days/yr
Wind risk 9/10 · Severe
- Chance of severe wind over 30 yrs
- 99.0%
Air-quality risk 1/10 · Minimal
- Unhealthy air days now
- 0 days/yr
- Unhealthy air days in 30 yrs
- 0 days/yr
Risk factors via First Street. Map © Google.
Why this score? — see what drove the C+ grade
The composite is a weighted blend of 9 inputs, each scored 0–100. Each bar is that input's sub-score; the figure is the points it added to the 100-point composite (weight × sub-score).
- Cash flow +21.7/30.0
- ARV discount +15.0/15.0
- DSCR +6.9/10.0
- 1% rule +4.9/10.0
- Schools +4.3/10.0
- Livability +3.6/5.0
- Rent growth +2.8/5.0
- Condition / age +2.5/5.0
- Appreciation +0.0/10.0
$184,000
🖨 Deal sheet 📄 Offer letter ✓ Due diligence
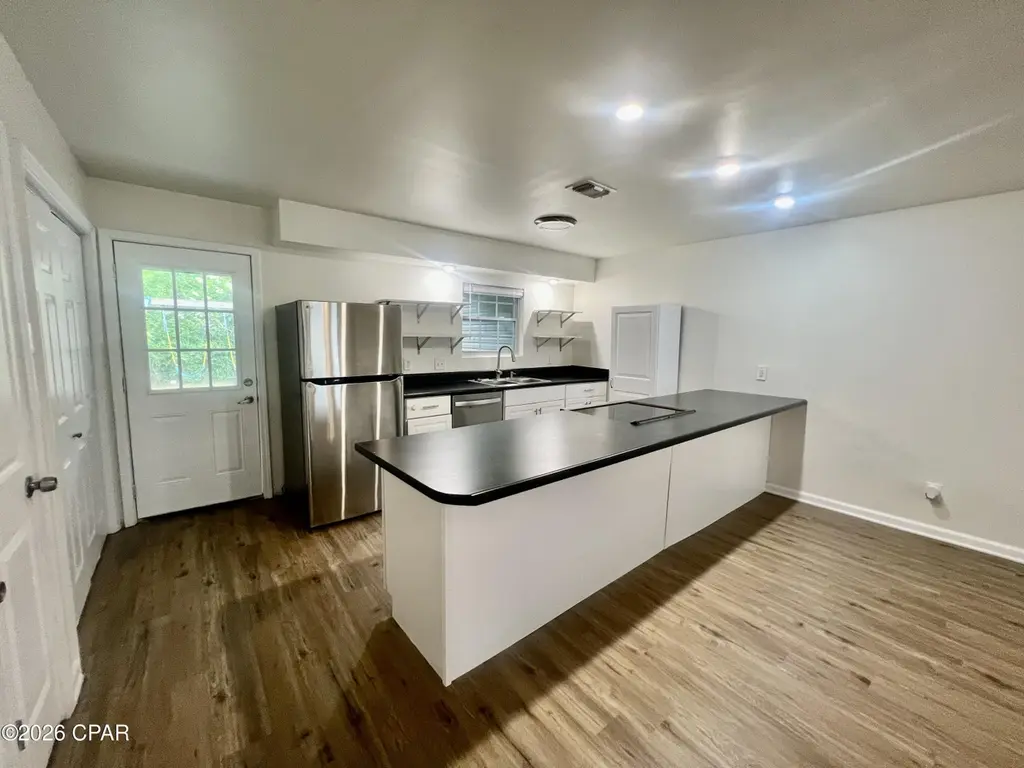
Listing remarks
Conveniently located in the heart of Panama City, this beautifully updated townhome offers affordable living with comfort and convenience. Ideal for first-time homebuyers, college students, or growing families, the property is just minutes from local hospitals, shopping, dining, and nearby college campuses. This move-in-ready home features 3 spacious bedrooms and 2.5 bathrooms, along with brand-new flooring and fresh interior and exterior paint that give the home a modern, refreshed feel. The functional layout offers comfortable everyday living, while the backyard provides the perfect space for weekend BBQs, outdoor entertaining, and family fun. A playset is already in place to keep the lit
Key facts
- Playset
- Central location
- Backyard
Tags
Property features AI
Finance
- HOA & community: Short-term rentals allowed
Exterior
- Utilities: Electricity available; Public sewer
- Home design: Multi-family property
- Construction: Brick and wood siding construction
- Exterior features: Fenced yard; City street frontage; Publicly maintained road access; Zoned for residential multi-family
Interior
- Kitchen: Electric cooktop; Electric oven; Electric range
- Bedrooms: Three bedrooms (all on the second level)
- Bathrooms: Two full bathrooms
- Heating & cooling: Central heating (electric); Central air conditioning
- Interior features: Central heating and central air conditioning
- Laundry & utility: Electric water heater
Neighborhood map
What this means for you Summary
Snapshot
- This is a 3-bed/2.0-bath single-family listed at $184k.
Deal economics
- At list price, monthly cash flow is $284 ($3k/yr) — positive.
- The deal already cash-flows at list — no discount required.
- To meet the 1% rule (rent ≥ 1% of price), the offer needs to be $182k (1.1% below list).
- Recommended offer: $178k (3.0% below list) — sets the bar for market timing.
- Cap rate 8.1% vs local median 4.7% in Panama City — top-decile yield for the area; either an underpriced asset or a hidden risk that comps aren't pricing in. Stress-test before assuming the spread holds.
Location & tenants
- Location reads 72/100 on livability (#350 in FL) — a middle-class / working-renter tenant base. Strengths: cost of living A+, housing A+, health & safety A+; Watch: crime F, amenities F, commute F.
- Bay (suburban): math 51% / reading 51% proficiency, ranked #29 of 73 in FL (top 40%) — acceptable for families but not a draw, mixed tenant base, ~2y average lease.
- Market conditions: Rents rising (+1.2%/yr); 381 active listings in the ZIP; 12 comparable units currently listed for rent nearby; rentals at typical pace (median 21d on market — plan ~3-4 weeks tenant-placement turnaround); 2,473 units permitted in Bay County in 2024 (559 in 5+ unit buildings).
Forward outlook
- Local home prices are declining (-3.0%/yr); year-one equity from $1k of loan paydown is wiped out by about $6k of value loss. Plan a longer hold.
- Bay County population projected at +24% by 2050 — long-run rental-demand tailwind backs the buy-and-hold thesis.
Negotiation context
- It's been on market 42 days — a 3% lower offer ($178k) is reasonable based on typical stale-listing flexibility.
- 5 sale attempts since 21y ago; this cycle's ask has dropped $11k (6%) from the opening price — seller is motivated, your offer sets the floor, not the list.
- Current owner paid $64k; list at $184k implies a 188% gain — meaningful room to come down on a strong offer.
Risks & watch-outs
- Climate carrying-cost: severe wind risk, 99% chance of damaging wind over 30y; extreme-heat days projected 7→21/yr by 2055 (HVAC capex compounding) — expect insurance premiums to compound above CPI over the hold.
Questions for the listing agent
- It's been on market 42 days. Have you received any prior offers? Is the seller open to a 3% concession, seller financing, or rate buy-down credit?
- Is there a deadline driving the sale (1031 exchange, divorce, estate, relocation)? That informs how much negotiation room exists.
- Schools are B-rated — typically a magnet for longer-tenancy family renters. What's the average tenant stay here, and is there a school-zone premium baked into asking?
- Crime grade is F in this area — have there been break-ins, vandalism, or insurance claims at this property in the last 3 years? What carrier currently insures it and at what premium?
- What's the average days-on-market for RENTAL listings here right now (not sales)? A rising rental-DOM trend means longer vacancies and softer asking-rent achievability than the comps imply.
- What's the recent tenant-quality profile in this submarket — average credit score on applications, eviction rate, late-payment / NSF rate, and stable-employment percentage? A property-management company in the area should have these aggregated.
- How much new for-sale + rental construction is in the pipeline within 1–3 miles? Heavy new supply typically softens prices + rents 12–24 months out; constrained supply supports both.
Investment metrics
- 1% rule
- 0.99% ✗
- Cap rate
- 8.14%
- Cash-on-cash
- 6.61%
- DSCR
- 1.29
- GRM
- 8.4
CMA / ARV
- ARV (median comp)
- $227,377
- List price
- $184,000
- Delta
- -19.08%
- Verdict
- UNDERPRICED
- Comps
- 20 within 1.0 mi
Show comp detail 7 sales within ~0.75 mi
| Address | Dist | Beds/Ba | Sqft | Sold | Price | $/sf | Match |
|---|---|---|---|---|---|---|---|
| 2008 Gail Ct | 0.18mi | 3/2.0 | 1,475 (+4%) | 15mo | $282,500 | $192 | 72 |
| 1219 Emory Dr | 0.37mi | 3/2.0 | 1,410 (-0%) | 18mo | $175,100 | $124 | 67 |
| 2409 Nicole Dr | 0.73mi | 3/2.0 | 1,487 (+5%) | 2mo | $310,000 | $208 | 56 |
| 1212 Emory Dr | 0.40mi | 3/2.0 | 1,320 (-7%) | 20mo | $210,000 | $159 | 54 |
| 2408 Stanford Rd | 0.67mi | 3/2.0 | 1,453 (+3%) | 22mo | $249,000 | $171 | 46 |
| 109 Springhill Cir | 0.46mi | 4/2.0 (+1) | 1,596 (+13%) | 18mo | $290,000 | $182 | 37 |
| 704 W 19th St | 0.63mi | 4/2.0 (+1) | 1,596 (+13%) | 11mo | $265,000 | $166 | 36 |
Match score weights: distance 35% · size 25% · config 20% · recency 20%. Top-matched comps best support the ARV.
Projected returns pro-forma
-3.0% appreciation · 1.24% rent growth · sell at horizon
- IRR
- -8.0%
- Equity multiple
- 0.71×
- Total profit
- $-14,957
- Equity at exit
- $27,435
- IRR
- -0.8%
- Equity multiple
- 0.95×
- Total profit
- $-2,483
- Equity at exit
- $15,909
Cash invested: $51,520 (down + closing). Projections, not guarantees.
Landlord ↔ Tenant lean methodology
- Overall (STATE)
- 87 Strongly Landlord-Friendly
- State Florida
- 87 Strongly Landlord-Friendly · R+3
- County
- — inherits STATE
- City
- — inherits STATE
ZIP-level market 32405
- Rents YoY
- 1.2%
- Active inventory
- 381
- Price-to-rent
- 8.4×
Monthly cashflow live
- Estimated rent
- $1,820 high interval (Pro) →
- Mortgage (P&I)
- −$965
- Tax from tax record
- −$112 /mo · $1,349/yr
- Insurance
- −$77
- HOA
- −$0
- Vacancy / Maint / Mgmt
- −$382
- Net cashflow
- $284
Break-even live
UW: 25.0% down · 7.5% · 30yr · 1.5% tax · 5.0% vac · 8.0% maint · 8.0% mgmt
Financing live
Cash to close
- Down payment
- $46,000
- Closing costs
- $5,520
- Reserves months
- —
- Total cash needed
- —
Loan-product check · same deal, 3 products live
Conventional
25% down · 7.5% · 30yr
- Down + closing
- —
- Monthly P&I
- —
- Monthly cashflow
- —
- DSCR
- —
- Eligible?
- —
Personal DTI + credit; lowest rate.
DSCR
20% down · 8.5% · 30yr
- Down + closing
- —
- Monthly P&I
- —
- Monthly cashflow
- —
- DSCR
- —
- Eligible?
- —
No personal income docs; deal must DSCR.
Hard money
10% down · 12.0% · 12mo
- Down + closing
- —
- Monthly P&I
- —
- Monthly cashflow
- —
- DSCR
- —
- Eligible?
- —
Short-term bridge; refi at stabilization.
Rent comps 12 comps
| Address | Beds | Baths | Sqft | Rent | $/sqft | DOM | Units | Dist |
|---|---|---|---|---|---|---|---|---|
| 1827 Balboa Ave Panama City, FL | 3.0 | 2.5 | 1440 | $1,800 | $1.25 | 13d | 1 | 0.36mi |
| 901 W 19th St Panama City, FL | 1.0–2.0 | 1.0–2.0 | 787 | $1,168 | $1.48 | 21d | 5 | 0.44mi |
| 723 W 19th St Panama City, FL | 2.0 | 2.0 | 1170 | $1,520 | $1.30 | 21d | 15 | 0.60mi |
| 1804 Arthur Ave Panama City, FL | 3.0 | 1.5 | 1044 | $1,795 | $1.72 | 21d | 1 | 0.91mi |
| 300 W 23rd Pl Unit 1491599P Panama City, FL | 2.0 | 1.5 | 1313 | $2,592 | $1.97 | 21d | 1 | 1.04mi |
| 1525 Oak Ave Panama City, FL | 3.0 | 1.5 | 1280 | $2,200 | $1.72 | 21d | 1 | 1.09mi |
| 1710 Drake Ave Panama City, FL | 3.0 | 2.0 | 1130 | $1,850 | $1.64 | 21d | 1 | 1.11mi |
| 265 15th St Panama City, FL | 1.0–3.0 | 1.0–2.0 | 967 | $1,462 | $1.51 | 13d | 4 | 1.13mi |
| 2121 Harrison Ave Panama City, FL | 1.0–2.0 | 1.0–2.0 | 800 | $1,550 | $1.94 | 21d | 13 | 1.20mi |
| 2602 W 12th St Panama City, FL | 3.0 | 2.0 | 1400 | $2,095 | $1.50 | 21d | 1 | 1.42mi |
| 3100 Sweetbay Ave Panama City, FL | 1.0–3.0 | 1.0–2.0 | 957 | $2,168 | $2.26 | 13d | 26 | 1.45mi |
| 2100 W Beach Dr Unit F102 Panama City, FL | 2.0 | 1.0 | 970 | $1,700 | $1.75 | 21d | 1 | 1.47mi |
Listing history 25 events
-
2026-06-19days on market $184,000 Active 42 DOM
-
2026-06-18days on market $184,000 Active 41 DOM
-
2026-06-17days on market $184,000 Active 40 DOM
-
2026-06-16days on market $184,000 Active 39 DOM
-
2026-06-15days on market $184,000 Active 38 DOM
-
2026-06-14pricedays on market $184,000 Active 36 DOM
-
2026-06-13days on market $188,000 Active 35 DOM
-
2026-06-10days on market $188,000 Active 33 DOM
-
2026-06-09days on market $188,000 Active 32 DOM
-
2026-06-08days on market $188,000 Active 31 DOM
-
2026-06-07days on market $188,000 Active 30 DOM
-
2026-06-05days on market $188,000 Active 27 DOM
-
2026-06-03days on market $188,000 Active 26 DOM
-
2026-06-02days on market $188,000 Active 25 DOM
-
2026-06-01days on market $188,000 Active 24 DOM
-
2026-05-31pricedays on market $188,000 Active 23 DOM
-
2026-05-30days on market $195,000 Active 22 DOM
-
2026-05-08$195,000 Active 858-char remark
-
2021-12-14historical
-
2009-09-04soldstatus $64,000
-
2009-02-12$69,900
-
2006-05-28historical
-
2005-11-28$136,500
-
2005-11-28$136,500
-
2005-11-28$136,500
ⓘ Source: listings_history table (triggers on properties + properties_extension) + one-shot
backfill from property_details.listing_events for pre-trigger history.
Tax reassessment forecast FL · Resets to sale price
- Current annual tax
- $1,349 · $112/mo
- Projected year-2 tax
- $1,527 · $127/mo
- Expected delta
- +$178/yr (+$15/mo · 13.2%)
ⓘ Screening estimate from a state-policy table — verify with the county assessor before closing.
Climate risk First Street
- Flood 1/10 Low FEMA zone X (unshaded) · 0% chance over 30 yrs
- Wildfire 2/10 Low
- Heat 10/10 Extreme 7 d/yr ≥105°F today · 21 d/yr by 30 yrs out
- Wind 9/10 Extreme 99% chance of damaging wind over 30 yrs
- Air quality 1/10 Low 0 unhealthy d/yr today · 0 by 30 yrs out
Nearby sold comps map
Loading sold comps map…
Walkable amenities ~0.75 mi
Loading nearby amenities…
Taxation est. · year 1
- Rental income
- $21,839
- − Mortgage interest
- −$10,307
- − Property taxes
- −$1,349
- − Insurance
- −$920
- − Repairs & maintenance
- −$1,747
- − Management
- −$1,747
- − Depreciation
- −$5,353
- Taxable income
- $416
- Est. tax owed @ 24.0%
- −$100
- After-tax cash flow
- $3,305/yr
For passive investors: Depreciation is non-cash, so a rental often shows a tax loss while cash-flowing — sheltering income. Rental losses are passive: they offset passive income freely, and up to $25,000/yr can offset ordinary (W-2) income if you actively participate and your MAGI is under $100k (phasing out to $0 by $150k); unused losses carry forward. On sale, claimed depreciation is recaptured at up to 25%, and gains may owe capital-gains tax (a 1031 exchange can defer both). Figures are a year-1 estimate at your 24.0% rate — not tax advice; consult a CPA.
Schools (NCES district)
- District
- Bay
- NCES district ID
- 1200090
- Math proficiency
- 51% ▼ -8.00%
- Reading proficiency
- 51% ▼ -7.00%
- Median HH income
- $47,740
- Composite
- 43.41/100
- National rank
- #3014
- State rank
- #29 of 73 in FL
Livability — Panama City
- Score
- 72/100
- State rank
- #350
- US rank
- #5823
Category grades
Schools grade is shown separately in the Schools card above.
Census & demographics
- Census place
- Panama City, FL
- County
- Bay County · 163,593 people
- City population
- 91,445
- Metro
- Panama City, FL
- Population (ZIP)
- 29,984
- Household income
- $73,373
- Rent vs Own
- Severe rent burden
- 1008.0
Population outlook (Bay County) Hauer SSP2
- Today (2025)
- 206,264 people
- By 2030
- 217,740 · +5.6%
- By 2040
- 238,738 · +15.7%
- By 2050
- 255,545 · +23.9%
- By 2075
- 288,295 · +39.8%
- By 2100
- 288,638 · +39.9%
Race, ethnicity, and origin ACS 2023
- Neighborhood character
- Predominantly White (67%)
- Race & ethnicity
- White 67% Black 17% Two or more races 8% Hispanic / Latino 7% Native American 1%
- Hispanic origin (detail)
- Mexican 2% Puerto Rican 3%
- Common ancestry
- Slovak 4% Lithuanian 2% Romanian 2%
- Foreign-born
- 7% · Canada
- Languages at home
- 89% English-only · Spanish 6% Arabic 1% French/Haitian/Cajun 1%
Political lean MEDSL · Bay
- 2024 margin
- Solid R (+47.4) · D 25.8% · R 73.1% · Other 1.1%
- 2008→2024 swing
- -6.6pp toward R · 2008: -40.7pp · 2024: -47.4pp
- All cycles
- 2024: R+47.4 2020: R+43.5 2016: R+46.3 2012: R+43.6 2008: R+40.7
Not yet ingested
- Civics
- —
Market trends
- HPI YoY
- ▼ -217.88%
- Current HPI
- 262.7854
- Rent YoY
- ▲ 1.24%
- Metro
- Panama City, FL
- State GDP YoY
- ▲ 3.28%
- F500 in state
- 36
Industry mix (Fortune 500 HQ in FL)
| Industry | F500 HQs | Revenue |
|---|---|---|
| Industrial Technology | 2 | $29B |
|
||
| Insurance | 2 | $17B |
|
||
| Retail | 1 | $60B |
|
||
| Technology Distribution | 1 | $58B |
|
||
| Homebuilding | 1 | $35B |
|
||
| Technology Manufacturing | 1 | $35B |
|
||
Price history
+34.8% since first listed10 events — show timeline
- 2026-06-13 Price Changed $184,000 CPARMLS
- 2026-05-30 Price Changed $188,000 CPARMLS
- 2026-05-08 Listed $195,000 CPARMLS
- 2021-12-14 Listing Removed — CPARMLS
- 2009-09-04 Sold (MLS) $64,000 CPARMLS
- 2009-02-12 Listed $69,900 CPARMLS
- 2006-05-28 Listing Removed — NAMLS
- 2005-11-28 Listed $136,500 NAMLS
- 2005-11-28 Listed $136,500 ECAR
- 2005-11-28 Listed $136,500 CPARMLS
Property tax history
+5.1%/yrLatest (2025): $1,349 · -7.1% YoY. Source: county tax records.
Cash-flow waterfall
monthlySold comps — $/sqft
last 12 mo · ≤1 miLoading sold comps…