 🏗️ New Construction
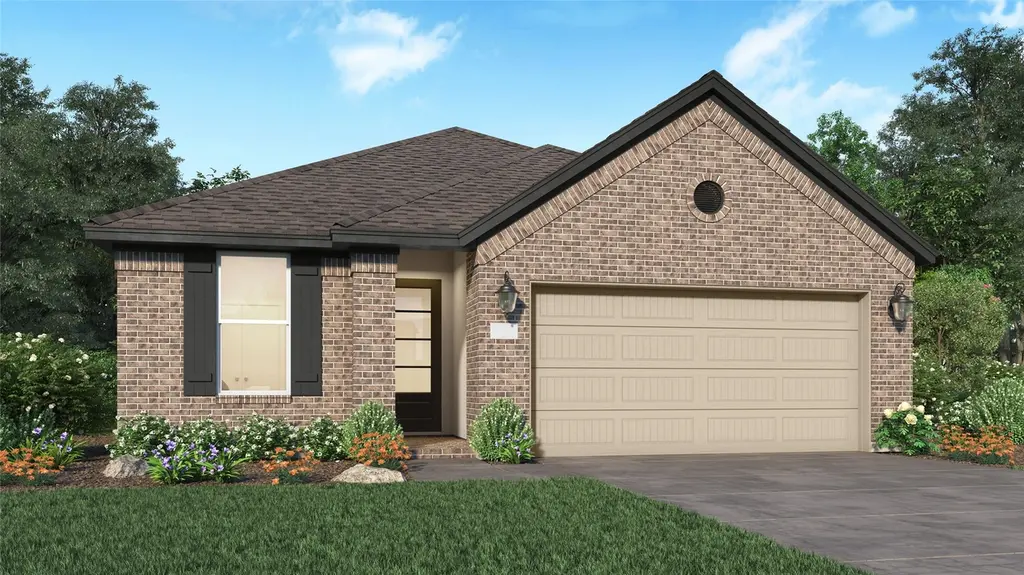
207 Yellow Rosewood Ln · Plum Grove, TX
Flood risk 6/10 · Moderate
- FEMA flood zone
- X (unshaded)
- Chance of flooding over 30 yrs
- 0.71%
- Est. flood insurance / yr
- $507 – $1,088
Fire risk 4/10 · Minor
- Est. fire insurance / yr
- $1,222 – $2,270
Heat risk 8/10 · Major
- Hot days now (above 111°F)
- 7 days/yr
- Hot days in 30 yrs
- 23 days/yr
Wind risk 8/10 · Major
- Chance of severe wind over 30 yrs
- 99.0%
Air-quality risk 2/10 · Minimal
- Unhealthy air days now
- 1 days/yr
- Unhealthy air days in 30 yrs
- 2 days/yr
Risk factors via First Street. Map © Google.
Why this score? — see what drove the F grade
The composite is a weighted blend of 9 inputs, each scored 0–100. Each bar is that input's sub-score; the figure is the points it added to the 100-point composite (weight × sub-score).
- ARV discount +7.5/15.0
- Cash flow +4.8/30.0
- Schools +3.1/10.0
- Livability +2.9/5.0
- Rent growth +2.6/5.0
- Condition / age +2.5/5.0
- 1% rule +0.9/10.0
- DSCR +0.0/10.0
- Appreciation +0.0/10.0
$246,240
🖨 Deal sheet 📄 Offer letter ✓ Due diligence
Listing remarks
The Beckham Floor Plan - This single-story home has everything growing families need with three bedrooms in total and an open concept living area. Two bedrooms share a hall bathroom at the front of the home, while down the hall is the family room, kitchen and dining room with access to the back porch. Tucked into the back corner is the owner’s suite, which has a private bathroom and walk-in closet. The completion date, prices and features may vary and are subject to change. Please verify with Lennar directly. Photos are for illustrative purposes only.
Key facts
- Walk-in closet
- Back porch
- Private bathroom
Tags
Property features AI
Finance
- HOA & community: Community association (CCMC) with annual fee of $900
Exterior
- Parking: Attached 2-car garage
- Utilities: Public water; Public sewer
- Home design: Residential property; Under construction (new construction); Entry level on slab foundation
- Construction: Built in 2026; Brick construction; Composition roof; Slab foundation
- Exterior features: Fenced backyard; Subdivision lot features
Interior
- Kitchen: Dishwasher; Electric oven; Electric range; Gas oven; Gas range
- Bedrooms: Primary bedroom on the first floor (15 x 14); Bedroom on the first floor (11 x 10); Bedroom on the first floor (9 x 11)
- Flooring: Carpet; Vinyl
- Bathrooms: 2 full bathrooms
- Heating & cooling: Central heating (electric and gas); Central air conditioning (electric and gas)
- Interior features: Breakfast bar; Double vanity; Kitchen/family room combo; Separate shower; Tub/shower
- Laundry & utility: Washer hookup; Electric dryer hookup; Gas dryer hookup
Neighborhood map
What this means for you Summary
Snapshot
- This is a 3-bed/2.0-bath single-family listed at $246k.
Deal economics
- At list price, monthly cash flow is $-807 ($-10k/yr) — negative.
- To cash-flow at today's rent, offer at most $211k (14.4% below list).
- To meet the 1% rule (rent ≥ 1% of price), the offer needs to be $194k (21.3% below list).
- Recommended offer: $194k (21.3% below list) — sets the bar for 1% rule.
- Cap rate 3.3% vs local median 5.0% in Plum Grove — below-typical yield; the buyer is paying a premium for something (appreciation thesis, condition, location) that the cap rate doesn't capture.
Location & tenants
- Location reads 58/100 on livability (#1,206 in TX) — a working-class tenant base; expect higher turnover. Strengths: crime A+, cost of living A+, housing A+; Watch: amenities F, commute F, health & safety F.
- Huffman ISD (rural): math 32% / reading 35% proficiency, ranked #500 of 826 in TX (top 60%) — families likely to look elsewhere, expect single-tenant / working-renter base with shorter leases.
- Zoned schools: Falcon Ridge El (math 30% / reading 35%, grade F, #2,234 of 4,322 statewide, top 52%, 689 students, 49% FRL); Huffman Middle (math 36% / reading 32%, grade F, #892 of 1,662 statewide, top 55%, 907 students, 42% FRL); Hargrave H S (math 31% / reading 46%, grade F, #866 of 1,632 statewide, top 54%, 1,125 students, 36% FRL).
- Market conditions: Rents flat; 979 active listings in the ZIP; 3 comparable units currently listed for rent nearby; rentals at typical pace (median 22d on market — plan ~3-4 weeks tenant-placement turnaround); solid renter incomes; 29,883 units permitted in Harris County in 2024 (8,621 in 5+ unit buildings).
- This rent runs 31% of the median local income ($76k/yr) — at the standard rent-burdened threshold; future hikes will face affordability resistance.
Forward outlook
- Local home prices are declining (-3.0%/yr); year-one equity from $2k of loan paydown is wiped out by about $10k of value loss. Plan a longer hold.
- Harris County population projected at +47% by 2050 — long-run rental-demand tailwind backs the buy-and-hold thesis.
Negotiation context
- Only 8 days on market — expect competitive offers; lowballing is unlikely to land.
- 2 sale attempts with the ask held roughly flat each time — persistent listings suggest the price (not the market) is what's stuck; bring a comps-based counter.
Risks & watch-outs
- Climate carrying-cost: major flood risk; severe wind risk, 99% chance of damaging wind over 30y; extreme-heat days projected 7→23/yr by 2055 (HVAC capex compounding) — expect insurance premiums to compound above CPI over the hold.
Questions for the listing agent
- What do current leases actually rent for vs. the listed asking? Can we see a recent rent roll and the last 12 months of T-12 income?
- What does the HOA fee cover, when was the last increase, and are there any pending special assessments or reserve-fund shortfalls?
- Is there a deadline driving the sale (1031 exchange, divorce, estate, relocation)? That informs how much negotiation room exists.
- Schools are F-rated, which usually means shorter tenancies and higher turnover. Who's the typical renter profile here, and what's been the actual vacancy rate?
- The area grade is low — what's the realistic commute time and amenity access for the typical tenant pool here? Any planned neighborhood developments (good or bad) we should know about?
- What's the average days-on-market for RENTAL listings here right now (not sales)? A rising rental-DOM trend means longer vacancies and softer asking-rent achievability than the comps imply.
- What's the recent tenant-quality profile in this submarket — average credit score on applications, eviction rate, late-payment / NSF rate, and stable-employment percentage? A property-management company in the area should have these aggregated.
- How much new for-sale + rental construction is in the pipeline within 1–3 miles? Heavy new supply typically softens prices + rents 12–24 months out; constrained supply supports both.
Investment metrics
- 1% rule
- 0.59% ✗
- Cap rate
- 3.34%
- Cash-on-cash
- -10.56%
- DSCR
- 0.53
- GRM
- 14.1
CMA / ARV
- ARV (median comp)
- $327,562
- List price
- $246,240
- Delta
- -24.83%
- Verdict
- UNDERPRICED
- Comps
- 20 within 1.0 mi
Show comp detail 12 sales within ~0.75 mi
| Address | Dist | Beds/Ba | Sqft | Sold | Price | $/sf | Match |
|---|---|---|---|---|---|---|---|
| 202 Yellow Rosewood Ln | 0.14mi | 3/2.0 | 1,792 (0%) | 1mo | $315,990 | $176 | 92 |
| 28831 Crockett Gardens Dr | 0.09mi | 3/2.0 | 1,901 (+6%) | 0mo | $345,090 | $182 | 86 |
| 306 Violet Crown Ln | 0.24mi | 3/2.0 | 1,700 (-5%) | 3mo | $264,990 | $156 | 78 |
| 204 Yellow Rosewood Ln | 0.14mi | 4/2.0 (+1) | 1,908 (+6%) | 2mo | $326,990 | $171 | 76 |
| 28803 Escarpment Trl | 0.15mi | 4/2.0 (+1) | 1,908 (+6%) | 2mo | $323,990 | $170 | 76 |
| 303 Haynes Ridge Dr | 0.26mi | 4/2.0 (+1) | 1,740 (-3%) | 4mo | $284,990 | $164 | 75 |
| 302 Violet Crown Ln | 0.26mi | 4/2.0 (+1) | 1,721 (-4%) | 3mo | $274,990 | $160 | 74 |
| 209 Yellow Rosewood Ln | 0.44mi | 3/2.0 | 1,880 (+5%) | 0mo | $325,990 | $173 | 71 |
| 28814 Dobra Trl | 0.22mi | 4/2.0 (+1) | 1,655 (-8%) | 1mo | $299,990 | $181 | 71 |
| 304 Dam Drop Dr | 0.25mi | 3/2.5 | 1,578 (-12%) | 0mo | $245,000 | $155 | 66 |
| 28823 Crockett Gardens Dr | 0.11mi | 4/3.0 (+1) | 2,051 (+14%) | 1mo | $366,265 | $179 | 61 |
| 286 County Road 5102 Unit F | 0.60mi | 3/3.5 | 1,692 (-6%) | 1mo | $224,000 | $132 | 56 |
Match score weights: distance 35% · size 25% · config 20% · recency 20%. Top-matched comps best support the ARV.
Projected returns pro-forma
-3.0% appreciation · 0.21% rent growth · sell at horizon
- IRR
- -38.6%
- Equity multiple
- -0.20×
- Total profit
- $-109,715
- Equity at exit
- $48,841
- IRR
- -80.6%
- Equity multiple
- -0.98×
- Total profit
- $-181,985
- Equity at exit
- $28,322
Cash invested: $91,717 (down + closing). Projections, not guarantees.
Landlord ↔ Tenant lean methodology
- Overall (STATE)
- 87 Strongly Landlord-Friendly
- State Texas
- 87 Strongly Landlord-Friendly · R+5
- County
- — inherits STATE
- City
- — inherits STATE
ZIP-level market 77357
- Home prices YoY
- -24.7%
- Rents YoY
- 0.2%
- Active inventory
- 979
- Price-to-rent
- 10.6×
Monthly cashflow live
- Estimated rent
- $1,938 medium interval (Pro) →
- Mortgage (P&I)
- −$1,718
- Tax est. 1.5%
- −$409 /mo · $4,913/yr
- Insurance
- −$136
- HOA
- −$75
- Vacancy / Maint / Mgmt
- −$407
- Net cashflow
- $-807
Break-even live
UW: 25.0% down · 7.5% · 30yr · 1.5% tax · 5.0% vac · 8.0% maint · 8.0% mgmt
Financing live
Cash to close
- Down payment
- $81,891
- Closing costs
- $9,827
- Reserves months
- —
- Total cash needed
- —
Loan-product check · same deal, 3 products live
Conventional
25% down · 7.5% · 30yr
- Down + closing
- —
- Monthly P&I
- —
- Monthly cashflow
- —
- DSCR
- —
- Eligible?
- —
Personal DTI + credit; lowest rate.
DSCR
20% down · 8.5% · 30yr
- Down + closing
- —
- Monthly P&I
- —
- Monthly cashflow
- —
- DSCR
- —
- Eligible?
- —
No personal income docs; deal must DSCR.
Hard money
10% down · 12.0% · 12mo
- Down + closing
- —
- Monthly P&I
- —
- Monthly cashflow
- —
- DSCR
- —
- Eligible?
- —
Short-term bridge; refi at stabilization.
Rent comps 3 comps
| Address | Beds | Baths | Sqft | Rent | $/sqft | DOM | Units | Dist |
|---|---|---|---|---|---|---|---|---|
| 670 Road 51021 Cleveland, TX | 4.0 | 2.0 | 1699 | $1,749 | $1.03 | 1d | 8 | 0.72mi |
| 26 Road 5102 F Cleveland, TX | 4.0 | 2.0 | 1761 | $1,501 | $0.85 | 21d | 1 | 0.76mi |
| 1176 Road 5102 Cleveland, TX | 4.0 | 3.0 | 2032 | $2,150 | $1.06 | 43d | 1 | 0.94mi |
HOA detail
- Monthly dues
- $75 · $900/yr
Listing history 28 events
-
2026-05-12$246,240 Active 563-char remark
-
2026-05-12historical
-
2026-05-08price $246,240
-
2026-05-07price $246,240
-
2026-05-05price $250,590
-
2026-05-04price $250,590
-
2026-04-17price $254,940
-
2026-04-16price $254,940
-
2026-04-14price $259,240
-
2026-04-14price $259,240
-
2026-03-31price $263,540
-
2026-03-31price $263,540
-
2026-03-22price $268,090
-
2026-03-20price $268,090
-
2026-03-17price $272,940
-
2026-03-16price $272,940
-
2026-03-13price $277,790
-
2026-03-13price $277,790
-
2026-03-10price $282,740
-
2026-03-10price $282,740
-
2026-03-02price $287,690
-
2026-03-01price $287,690
-
2026-02-24price $289,690
-
2026-02-24price $289,690
-
2026-02-19price $299,990
-
2026-02-18price $299,990
-
2025-12-17$310,990 Active
-
2025-12-17$310,990 Active
ⓘ Source: listings_history table (triggers on properties + properties_extension) + one-shot
backfill from property_details.listing_events for pre-trigger history.
Climate risk First Street
- Flood 6/10 Major FEMA zone X (unshaded) · 71% chance over 30 yrs
- Wildfire 4/10 Moderate
- Heat 8/10 Severe 7 d/yr ≥111°F today · 23 d/yr by 30 yrs out
- Wind 8/10 Severe 99% chance of damaging wind over 30 yrs
- Air quality 2/10 Low 1 unhealthy d/yr today · 2 by 30 yrs out
Nearby sold comps map
Loading sold comps map…
Walkable amenities ~0.75 mi
Loading nearby amenities…
Taxation est. · year 1
- Rental income
- $23,262
- − Mortgage interest
- −$18,349
- − Property taxes
- −$4,913
- − Insurance
- −$1,638
- − Repairs & maintenance
- −$1,861
- − Management
- −$1,861
- − HOA
- −$900
- − Depreciation
- −$9,529
- Taxable loss
- −$15,789
- Est. tax savings @ 24.0%
- +$3,789
- After-tax cash flow
- $-5,898/yr
For passive investors: Depreciation is non-cash, so a rental often shows a tax loss while cash-flowing — sheltering income. Rental losses are passive: they offset passive income freely, and up to $25,000/yr can offset ordinary (W-2) income if you actively participate and your MAGI is under $100k (phasing out to $0 by $150k); unused losses carry forward. On sale, claimed depreciation is recaptured at up to 25%, and gains may owe capital-gains tax (a 1031 exchange can defer both). Figures are a year-1 estimate at your 24.0% rate — not tax advice; consult a CPA.
Schools (NCES district)
- District
- Huffman ISD
- NCES district ID
- 4823820
- Math proficiency
- 32% ▼ -9.00%
- Reading proficiency
- 35% ▼ -9.00%
- Median HH income
- $65,848
- Composite
- 30.61/100
- National rank
- #6195
- State rank
- #500 of 826 in TX
Livability — Plum Grove
- Score
- 58/100
- State rank
- #1206
- US rank
- #21049
Category grades
Schools grade is shown separately in the Schools card above.
Census & demographics
- County
- Montgomery County · 663,713 people
- Metro
- Houston-The Woodlands-Sugar Land, TX
- Population (ZIP)
- 37,592
- Household income
- $76,050
- Rent vs Own
- Severe rent burden
- 487.0
Population outlook (Harris County) Hauer SSP2
- Today (2025)
- 5,571,493 people
- By 2030
- 6,089,821 · +9.3%
- By 2040
- 7,142,806 · +28.2%
- By 2050
- 8,185,864 · +46.9%
- By 2075
- 10,574,329 · +89.8%
- By 2100
- 12,109,958 · +117.4%
Race, ethnicity, and origin ACS 2023
- Neighborhood character
- Diverse neighborhood (Simpson 0.56)
- Race & ethnicity
- Hispanic / Latino 49% White 45% Two or more races 31% Black 3%
- Hispanic origin (detail)
- Mexican 40%
- Common ancestry
- Lithuanian 2% Romanian 1% Iranian 1%
- Foreign-born
- 23% · Canada, Jamaica
- Languages at home
- 58% English-only · Spanish 40% Other Indo-European 1%
Political lean MEDSL · Harris
- 2024 margin
- Lean D (+5.5) · D 52.0% · R 46.4% · Other 1.6%
- 2008→2024 swing
- +3.9pp toward D · 2008: 1.6pp · 2024: 5.5pp
- All cycles
- 2024: D+5.5 2020: D+13.3 2016: D+12.4 2012: D+0.1 2008: D+1.6
Not yet ingested
- Civics
- —
Market trends
- HPI YoY
- ▼ -87.71%
- Current HPI
- 266.8315
- Rent YoY
- ▲ 0.21%
- Metro
- Houston-The Woodlands-Sugar Land, TX
- State GDP YoY
- ▲ 3.95%
- F500 in state
- 110
Industry mix (Fortune 500 HQ in TX)
| Industry | F500 HQs | Revenue |
|---|---|---|
| Energy | 16 | $1,198B |
|
||
| Technology | 5 | $198B |
|
||
| Engineering / Construction | 4 | $72B |
|
||
| Energy Services | 3 | $60B |
|
||
| Utilities | 3 | $41B |
|
||
| Healthcare | 2 | $330B |
|
||
Price history
-20.8% since first listed16 events — show timeline
- 2026-05-20 Pending — HARMLS
- 2026-05-12 Listing Removed — HARMLS
- 2026-05-12 Listed $246,240 HARMLS
- 2026-05-07 Price Changed $246,240 HARMLS
- 2026-05-04 Price Changed $250,590 HARMLS
- 2026-04-16 Price Changed $254,940 HARMLS
- 2026-04-14 Price Changed $259,240 HARMLS
- 2026-03-31 Price Changed $263,540 HARMLS
- 2026-03-20 Price Changed $268,090 HARMLS
- 2026-03-16 Price Changed $272,940 HARMLS
- 2026-03-13 Price Changed $277,790 HARMLS
- 2026-03-10 Price Changed $282,740 HARMLS
- 2026-03-02 Price Changed $287,690 HARMLS
- 2026-02-24 Price Changed $289,690 HARMLS
- 2026-02-19 Price Changed $299,990 HARMLS
- 2025-12-17 Listed $310,990 HARMLS
Cash-flow waterfall
monthlySold comps — $/sqft
last 12 mo · ≤1 miLoading sold comps…