 Multi-family
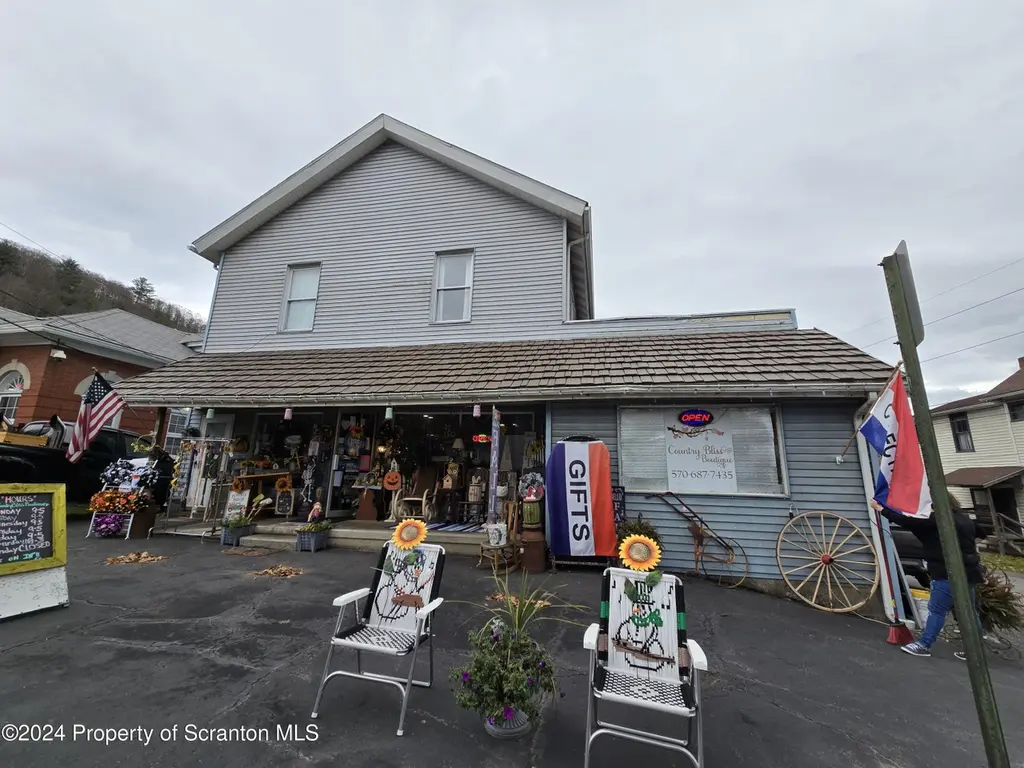
118 Main St · Hop Bottom, PA
Flood risk No data
- FEMA flood zone
- —
- Chance of flooding over 30 yrs
- —
- Est. flood insurance / yr
- —
Fire risk No data
- Est. fire insurance / yr
- —
Heat risk No data
- Hot days now (above threshold)
- —
- Hot days in 30 yrs
- —
Wind risk No data
- Chance of severe wind over 30 yrs
- —
Air-quality risk No data
- Unhealthy air days now
- —
- Unhealthy air days in 30 yrs
- —
Risk factors via First Street. Map © Google.
Why this score? — see what drove the B- grade
The composite is a weighted blend of 9 inputs, each scored 0–100. Each bar is that input's sub-score; the figure is the points it added to the 100-point composite (weight × sub-score).
- Cash flow +24.5/30.0
- ARV discount +14.9/15.0
- DSCR +7.9/10.0
- 1% rule +6.3/10.0
- Appreciation +5.0/10.0
- Schools +3.4/10.0
- Livability +3.1/5.0
- Rent growth +2.5/5.0
- Condition / age +2.2/5.0
$189,900
🖨 Deal sheet 📄 Offer letter ✓ Due diligence
Multi-family units
County records classify this as Multi-Family (2-4 Unit). Listing-text estimate: 1 unit. estimate disagrees with records
Listing remarks MLS
Spacious 2nd-story rental property offering multiple bedrooms, abundant natural light, and versatile living space. Below, the 1st-story storefront rental features a prime location with excellent visibility and foot traffic, ideal for retail or office use. A fantastic opportunity for live-and-work arrangements or investment income!
Key facts
- 9,147 sq ft lot
- Built 1890
- Listed 69 days
Neighborhood map
What this means for you Summary
Snapshot
- This is a 3-bed/1.5-bath multifamily listed at $190k. Condition is rated fair.
Deal economics
- At list price, monthly cash flow is $388 ($5k/yr) — positive.
- The deal already cash-flows at list — no discount required.
- Meets the 1% rule at list price ($2k rent vs $190k).
- Recommended offer: $179k (6.0% below list) — sets the bar for market timing.
Location & tenants
- Location reads 61/100 on livability (#1,418 in PA) — a middle-class / working-renter tenant base. Strengths: cost of living A+, housing A+; Watch: employment C-, schools F, amenities F.
- Mountain View SD (rural): math 30% / reading 50% proficiency, ranked #351 of 539 in PA (top 65%) — families likely to look elsewhere, expect single-tenant / working-renter base with shorter leases.
- Market conditions: 2 active listings in the ZIP; 80 units permitted in Susquehanna County in 2024 (5 in 5+ unit buildings).
Forward outlook
- In year one you build about $7k of equity ($1k loan paydown + $6k appreciation (3.0% local appreciation)).
- Susquehanna County population projected at -30% by 2050 — secular population decline; favor cash flow + early exit over multi-decade hold.
- At projected returns (3.0% appreciation + 3.0% rent growth), your $53k cash investment doubles in ~5 years — after that, you're playing with house money.
- By year 5, paydown + projected appreciation supports a ~$30k cash-out refi (75% LTV) — recoverable capital for the next deal without selling this one.
Negotiation context
- It's been on market 69 days — a 6% lower offer ($179k) is reasonable based on typical stale-listing flexibility.
- 3 sale attempts since 2y ago with the ask held roughly flat each time — persistent listings suggest the price (not the market) is what's stuck; bring a comps-based counter.
Risks & watch-outs
- Watch-outs: built in 1890 — expect roof / HVAC / electrical / plumbing capex.
Questions for the listing agent
- It's been on market 69 days. Have you received any prior offers? Is the seller open to a 6% concession, seller financing, or rate buy-down credit?
- Have any recent inspections been done? Can we get a copy of the seller's disclosures and any deferred-maintenance estimates?
- Built in 1890 — when were the roof, HVAC, electrical panel, plumbing, and water heater last replaced?
- Why hasn't it sold? Are there any deal-killer items the seller is aware of (foundation, flood, title, zoning, code violations)?
- Is there a deadline driving the sale (1031 exchange, divorce, estate, relocation)? That informs how much negotiation room exists.
- Schools are F-rated, which usually means shorter tenancies and higher turnover. Who's the typical renter profile here, and what's been the actual vacancy rate?
- What's the average days-on-market for RENTAL listings here right now (not sales)? A rising rental-DOM trend means longer vacancies and softer asking-rent achievability than the comps imply.
- What's the recent tenant-quality profile in this submarket — average credit score on applications, eviction rate, late-payment / NSF rate, and stable-employment percentage? A property-management company in the area should have these aggregated.
- How much new apartment / multifamily construction is in the pipeline within 1–3 miles? Heavy new supply (>2% of stock underway) typically softens rents 12–24 months out; light construction supports rent growth.
Investment metrics
- 1% rule
- 1.13% ✓
- Cap rate
- 8.74%
- Cash-on-cash
- 8.75%
- DSCR
- 1.39
- GRM
- 7.4
CMA / ARV
- ARV (median comp)
- $227,492
- List price
- $189,900
- Delta
- -16.52%
- Verdict
- UNDERPRICED
- Comps
- 1 within 2.0 mi
Projected returns pro-forma
3.0% appreciation · 3.0% rent growth · sell at horizon
- IRR
- 15.7%
- Equity multiple
- 1.90×
- Total profit
- $47,603
- Equity at exit
- $85,387
- IRR
- 17.3%
- Equity multiple
- 3.54×
- Total profit
- $134,928
- Equity at exit
- $131,592
Cash invested: $53,172 (down + closing). Projections, not guarantees.
Landlord ↔ Tenant lean methodology
- Overall (STATE)
- 62 Landlord-Friendly
- State Pennsylvania
- 62 Landlord-Friendly · EVEN
- County
- — inherits STATE
- City
- — inherits STATE
ZIP-level market 18824
- Active inventory
- 2
- Price-to-rent
- 14.7×
Monthly cashflow live
- Estimated rent
- $2,152 medium interval (Pro) →
- Mortgage (P&I)
- −$996
- Tax est. 1.5%
- −$237 /mo · $2,848/yr
- Insurance
- −$79
- HOA
- −$0
- Vacancy / Maint / Mgmt
- −$452
- Net cashflow
- $388
Break-even live
2-unit breakdown (identical units grouped — click to expand)
| Units | Beds | Baths | Est. rent |
|---|---|---|---|
| 2× units | 2 | 1 | $2,152 |
| #1 | 2 | 1 | $1,076 |
| #2 | 2 | 1 | $1,076 |
| Total (2 units) | $2,152 | ||
UW: 25.0% down · 7.5% · 30yr · 1.5% tax · 5.0% vac · 8.0% maint · 8.0% mgmt
Financing live
Cash to close
- Down payment
- $47,475
- Closing costs
- $5,697
- Reserves months
- —
- Total cash needed
- —
Loan-product check · same deal, 3 products live
Conventional
25% down · 7.5% · 30yr
- Down + closing
- —
- Monthly P&I
- —
- Monthly cashflow
- —
- DSCR
- —
- Eligible?
- —
Personal DTI + credit; lowest rate.
DSCR
20% down · 8.5% · 30yr
- Down + closing
- —
- Monthly P&I
- —
- Monthly cashflow
- —
- DSCR
- —
- Eligible?
- —
No personal income docs; deal must DSCR.
Hard money
10% down · 12.0% · 12mo
- Down + closing
- —
- Monthly P&I
- —
- Monthly cashflow
- —
- DSCR
- —
- Eligible?
- —
Short-term bridge; refi at stabilization.
Listing history 19 events
-
2026-06-18days on market $189,900 Active 69 DOM
-
2026-06-17days on market $189,900 Active 68 DOM
-
2026-06-16days on market $189,900 Active 67 DOM
-
2026-06-15days on market $189,900 Active 66 DOM
-
2026-06-14days on market $189,900 Active 64 DOM
-
2026-06-13days on market $189,900 Active 63 DOM
-
2026-06-10days on market $189,900 Active 61 DOM
-
2026-06-09days on market $189,900 Active 60 DOM
-
2026-06-08days on market $189,900 Active 59 DOM
-
2026-06-07days on market $189,900 Active 58 DOM
-
2026-06-03days on market $189,900 Active 54 DOM
-
2026-06-02days on market $189,900 Active 53 DOM
-
2026-06-01days on market $189,900 Active 52 DOM
-
2026-05-31days on market $189,900 Active 51 DOM
-
2026-05-30days on market $189,900 Active 50 DOM
-
2026-04-09$189,900 Active 332-char remark
Show marketing remark (332 chars)
Spacious 2nd-story rental property offering multiple bedrooms, abundant natural light, and versatile living space. Below, the 1st-story storefront rental features a prime location with excellent visibility and foot traffic, ideal for retail or office use. A fantastic opportunity for live-and-work arrangements or investment income!
-
2025-06-04status Active
-
2025-06-04price $199,900
-
2024-12-02$209,900 Active
ⓘ Source: listings_history table (triggers on properties + properties_extension) + one-shot
backfill from property_details.listing_events for pre-trigger history.
Nearby sold comps map
Loading sold comps map…
Walkable amenities ~0.75 mi
Loading nearby amenities…
Taxation est. · year 1
- Rental income
- $25,824
- − Mortgage interest
- −$10,637
- − Property taxes
- −$2,848
- − Insurance
- −$950
- − Repairs & maintenance
- −$2,066
- − Management
- −$2,066
- − Depreciation
- −$5,524
- Taxable income
- $1,732
- Est. tax owed @ 24.0%
- −$416
- After-tax cash flow
- $4,237/yr
For passive investors: Depreciation is non-cash, so a rental often shows a tax loss while cash-flowing — sheltering income. Rental losses are passive: they offset passive income freely, and up to $25,000/yr can offset ordinary (W-2) income if you actively participate and your MAGI is under $100k (phasing out to $0 by $150k); unused losses carry forward. On sale, claimed depreciation is recaptured at up to 25%, and gains may owe capital-gains tax (a 1031 exchange can defer both). Figures are a year-1 estimate at your 24.0% rate — not tax advice; consult a CPA.
Condition & rehab AI · 12 photos
This multi-family property requires moderate renovations to improve its curb appeal and interior condition, enhancing its resale and rental value.
Repairs flagged
- Major roof — Damaged shingles
- Major exterior siding — Weathered and peeling
- Major landscaping — Overgrown and cluttered
Value-add opportunities
- Both landscaping and curb appeal — Improved curb appeal and increased property value
- Both exterior siding and roof — Enhanced property value and reduced maintenance costs
- Both interior updates — Modernized interior and improved living experience
Renovation cost estimate screening
| Repair item | Severity | Est. cost |
|---|---|---|
| roof · Damaged shingles | Major | $15,000–50,000 |
| exterior siding · Weathered and peeling | Major | $15,000–50,000 |
| landscaping · Overgrown and cluttered | Major | $15,000–50,000 |
| Total estimated repair cost · 3 items | $45,000–150,000 |
Value-add ROI direction
- Both landscaping and curb appeal — Improved curb appeal and increased property value ↑
- Both exterior siding and roof — Enhanced property value and reduced maintenance costs ↑
- Both interior updates — Modernized interior and improved living experience ↑
ⓘ Cost ranges are severity-bucket heuristics (US national rule-of-thumb). Get contractor quotes + a written scope before underwriting a rehab budget.
Schools (NCES district)
- District
- Mountain View SD
- NCES district ID
- 4216050
- Math proficiency
- 30% ▼ -17.00%
- Reading proficiency
- 50% ▼ -13.00%
- Median HH income
- $50,744
- Composite
- 34.49/100
- National rank
- #5183
- State rank
- #351 of 539 in PA
Livability — Hop Bottom
- Score
- 61/100
- State rank
- #1418
- US rank
- #17997
Category grades
Schools grade is shown separately in the Schools card above.
Census & demographics
- Census place
- Hop Bottom, PA
- Population (ZIP)
- 1,342
Population outlook (Susquehanna County) Hauer SSP2
- Today (2025)
- 37,552 people
- By 2030
- 35,270 · -6.1%
- By 2040
- 30,663 · -18.3%
- By 2050
- 26,492 · -29.5%
- By 2075
- 19,658 · -47.7%
- By 2100
- 15,179 · -59.6%
Race, ethnicity, and origin ACS 2023
- Neighborhood character
- Predominantly White (96%)
- Race & ethnicity
- White 96% Two or more races 1% Hispanic / Latino 1%
- Common ancestry
- Romanian 15% Iranian 3% Slovak 2%
- Foreign-born
- 0%
- Languages at home
- 99% English-only · German/W. Germanic 1%
Political lean MEDSL · Susquehanna
- 2024 margin
- Solid R (+44.7) · D 27.2% · R 71.9%
- 2008→2024 swing
- -33.0pp toward R · 2008: -11.7pp · 2024: -44.7pp
- All cycles
- 2024: R+44.7 2020: R+41.2 2016: R+42.9 2012: R+21.4 2008: R+11.7
Not yet ingested
- Civics
- —
Market trends
- HPI YoY
- —
- Current HPI
- —
- Rent YoY
- —
- Metro
- —
- State GDP YoY
- ▲ 1.68%
- F500 in state
- 34
Industry mix (Fortune 500 HQ in PA)
| Industry | F500 HQs | Revenue |
|---|---|---|
| Healthcare | 2 | $309B |
|
||
| Insurance | 2 | $27B |
|
||
| Telecommunications / Media | 1 | $124B |
|
||
| Industrial Distribution | 1 | $22B |
|
||
| Financial Services | 1 | $20B |
|
||
| Chemicals / Materials | 1 | $18B |
|
||
Price history
-9.5% since first listed4 events — show timeline
- 2026-04-09 Listed $189,900 GSBR as distributed by MLS GRID
- 2025-06-04 Relisted — GSBR as distributed by MLS GRID
- 2025-06-04 Price Changed $199,900 GSBR as distributed by MLS GRID
- 2024-12-02 Listed $209,900 GSBR as distributed by MLS GRID
Cash-flow waterfall
monthlySold comps — $/sqft
last 12 mo · ≤1 miLoading sold comps…