 🏷️ Likely Rental
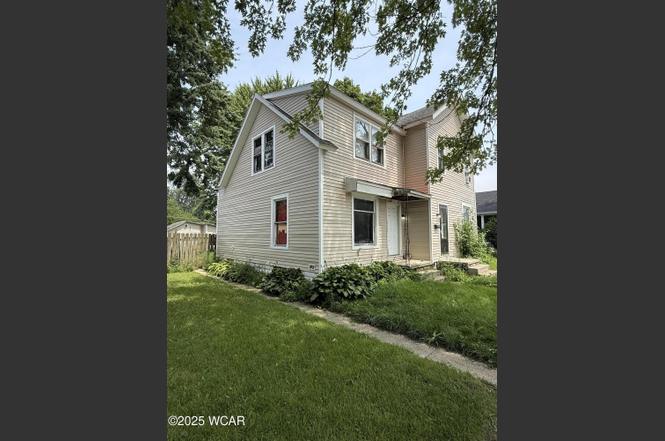
306 E High st St · Fostoria, OH
Flood risk 1/10 · Minimal
- FEMA flood zone
- X (unshaded)
- Chance of flooding over 30 yrs
- 0.0%
- Est. flood insurance / yr
- $473 – $860
Fire risk 1/10 · Minimal
- Est. fire insurance / yr
- $713 – $1,323
Heat risk 3/10 · Minor
- Hot days now (above 99°F)
- 7 days/yr
- Hot days in 30 yrs
- 17 days/yr
Wind risk 2/10 · Minimal
- Chance of severe wind over 30 yrs
- —
Air-quality risk 2/10 · Minimal
- Unhealthy air days now
- 1 days/yr
- Unhealthy air days in 30 yrs
- 2 days/yr
Risk factors via First Street. Map © Google.
Why this score? — see what drove the C+ grade
The composite is a weighted blend of 9 inputs, each scored 0–100. Each bar is that input's sub-score; the figure is the points it added to the 100-point composite (weight × sub-score).
- Cash flow +21.5/30.0
- ARV discount +15.0/15.0
- DSCR +6.8/10.0
- 1% rule +5.6/10.0
- Livability +3.8/5.0
- Schools +2.9/10.0
- Rent growth +2.5/5.0
- Condition / age +2.2/5.0
- Appreciation +0.0/10.0
$110,000
🖨 Deal sheet 📄 Offer letter ✓ Due diligence
Listing remarks
Large two-story home with detached garage property is tenant occupied with steady cashflow
Key facts
- 8,712 sq ft lot
- Garage
- Built 1928
Property features AI
Exterior
- Parking: Detached 1-car garage
- Security: See remarks for security details
- Utilities: Public water; Public sewer; Electricity connected; Natural gas available
- Home design: Single family residence; Two levels
- Construction: Vinyl siding; Block foundation; Built with block foundation
- Exterior features: Residential zoning; Garage(s) on the property
Interior
- Flooring: Other flooring
- Bathrooms: 2 full bathrooms
- Heating & cooling: Has heating (other); Wall unit cooling
- Interior features: Drapes on windows; See remarks for additional interior details; 10 total rooms; Unfinished block basement
Neighborhood map
What this means for you Summary
Snapshot
- This is a 4-bed/2.0-bath single-family listed at $110k. Condition is rated fair.
Deal economics
- At list price, monthly cash flow is $164 ($2k/yr) — positive.
- The deal already cash-flows at list — no discount required.
- Meets the 1% rule at list price ($1k rent vs $110k).
- Recommended offer: $97k (12.0% below list) — sets the bar for market timing.
- Cap rate 8.1% vs local median 4.4% in Fostoria — top-decile yield for the area; either an underpriced asset or a hidden risk that comps aren't pricing in. Stress-test before assuming the spread holds.
Location & tenants
- Location reads 76/100 on livability (#216 in OH, #3,330 nationally) — a middle-class / working-renter tenant base. Strengths: cost of living A+, housing A+, health & safety A+; Watch: schools D+, commute F, employment D-.
- Fostoria City (town): math 30% / reading 39% proficiency, ranked #566 of 656 in OH (top 86%) — families likely to look elsewhere, expect single-tenant / working-renter base with shorter leases; 70% free/reduced lunch — lower-income household profile, screen leases tightly.
- Market conditions: 44 active listings in the ZIP; 45 units permitted in Seneca County in 2024 (0 in 5+ unit buildings).
Forward outlook
- Local home prices are declining (-3.0%/yr); year-one equity from $761 of loan paydown is wiped out by about $3k of value loss. Plan a longer hold.
- Seneca County population projected at -14% by 2050 — secular population decline; favor cash flow + early exit over multi-decade hold.
Negotiation context
- It's been on market 233 days — a 12% lower offer ($97k) is reasonable based on typical stale-listing flexibility.
Risks & watch-outs
- Watch-outs: built in 1928 — expect roof / HVAC / electrical / plumbing capex.
Questions for the listing agent
- It's been on market 233 days. Have you received any prior offers? Is the seller open to a 12% concession, seller financing, or rate buy-down credit?
- Have any recent inspections been done? Can we get a copy of the seller's disclosures and any deferred-maintenance estimates?
- Built in 1928 — when were the roof, HVAC, electrical panel, plumbing, and water heater last replaced?
- Why hasn't it sold? Are there any deal-killer items the seller is aware of (foundation, flood, title, zoning, code violations)?
- Is there a deadline driving the sale (1031 exchange, divorce, estate, relocation)? That informs how much negotiation room exists.
- Schools are D-rated, which usually means shorter tenancies and higher turnover. Who's the typical renter profile here, and what's been the actual vacancy rate?
- What's the average days-on-market for RENTAL listings here right now (not sales)? A rising rental-DOM trend means longer vacancies and softer asking-rent achievability than the comps imply.
- What's the recent tenant-quality profile in this submarket — average credit score on applications, eviction rate, late-payment / NSF rate, and stable-employment percentage? A property-management company in the area should have these aggregated.
- How much new for-sale + rental construction is in the pipeline within 1–3 miles? Heavy new supply typically softens prices + rents 12–24 months out; constrained supply supports both.
Investment metrics
- 1% rule
- 1.06% ✓
- Cap rate
- 8.09%
- Cash-on-cash
- 6.40%
- DSCR
- 1.28
- GRM
- 7.8
CMA / ARV
- ARV (on-the-fly)
- $170,245
- Comps found
- 12
Show comp detail 12 sales within ~0.75 mi
| Address | Dist | Beds/Ba | Sqft | Sold | Price | $/sf | Match |
|---|---|---|---|---|---|---|---|
| 622 Walnut St | 0.36mi | 4/2.0 | 2,144 (-0%) | 2mo | $182,000 | $85 | 80 |
| 354 W Fremont St | 0.39mi | 4/2.0 | 2,030 (-6%) | 2mo | $60,000 | $30 | 70 |
| 827 N Main St | 0.42mi | 3/2.0 (-1) | 2,109 (-2%) | 11mo | $245,000 | $116 | 62 |
| 414 E Tiffin St | 0.42mi | 3/2.0 (-1) | 2,106 (-2%) | 18mo | $125,000 | $59 | 57 |
| 120 Elm St | 0.25mi | 5/2.0 (+1) | 2,404 (+12%) | 10mo | $190,000 | $79 | 55 |
| 145 E Crocker St | 0.56mi | 4/2.0 | 2,014 (-6%) | 10mo | $171,000 | $85 | 55 |
| 827 Buckley St | 0.50mi | 3/1.5 (-1) | 2,285 (+6%) | 6mo | $155,000 | $68 | 54 |
| 337 N Union St | 0.44mi | 4/1.0 | 1,994 (-8%) | 12mo | $95,000 | $48 | 53 |
| 911 N Main St | 0.50mi | 4/2.5 | 1,855 (-14%) | 2mo | $215,000 | $116 | 50 |
| 326 W Center St | 0.57mi | 4/2.0 | 2,376 (+10%) | 17mo | $160,000 | $67 | 42 |
| 719 N Main | 0.31mi | 3/1.5 (-1) | 2,425 (+12%) | 20mo | $194,500 | $80 | 41 |
| 430 W Center St | 0.68mi | 3/2.0 (-1) | 1,966 (-9%) | 12mo | $144,362 | $73 | 38 |
Match score weights: distance 35% · size 25% · config 20% · recency 20%. Top-matched comps best support the ARV.
Projected returns pro-forma
-3.0% appreciation · 3.0% rent growth · sell at horizon
- IRR
- -6.4%
- Equity multiple
- 0.76×
- Total profit
- $-7,340
- Equity at exit
- $16,401
- IRR
- 3.2%
- Equity multiple
- 1.23×
- Total profit
- $7,158
- Equity at exit
- $9,511
Cash invested: $30,800 (down + closing). Projections, not guarantees.
Landlord ↔ Tenant lean methodology
- Overall (STATE)
- 73 Landlord-Friendly
- State Ohio
- 73 Landlord-Friendly · R+6
- County
- — inherits STATE
- City
- — inherits STATE
ZIP-level market 44830
- Home prices YoY
- -16.1%
- Active inventory
- 44
- Price-to-rent
- 7.8×
Monthly cashflow live
- Estimated rent
- $1,170 medium interval (Pro) →
- Mortgage (P&I)
- −$577
- Tax est. 1.5%
- −$138 /mo · $1,650/yr
- Insurance
- −$46
- HOA
- −$0
- Vacancy / Maint / Mgmt
- −$246
- Net cashflow
- $164
Break-even live
UW: 25.0% down · 7.5% · 30yr · 1.5% tax · 5.0% vac · 8.0% maint · 8.0% mgmt
Financing live
Cash to close
- Down payment
- $27,500
- Closing costs
- $3,300
- Reserves months
- —
- Total cash needed
- —
Loan-product check · same deal, 3 products live
Conventional
25% down · 7.5% · 30yr
- Down + closing
- —
- Monthly P&I
- —
- Monthly cashflow
- —
- DSCR
- —
- Eligible?
- —
Personal DTI + credit; lowest rate.
DSCR
20% down · 8.5% · 30yr
- Down + closing
- —
- Monthly P&I
- —
- Monthly cashflow
- —
- DSCR
- —
- Eligible?
- —
No personal income docs; deal must DSCR.
Hard money
10% down · 12.0% · 12mo
- Down + closing
- —
- Monthly P&I
- —
- Monthly cashflow
- —
- DSCR
- —
- Eligible?
- —
Short-term bridge; refi at stabilization.
Listing history 15 events
-
2026-06-18days on market $110,000 Active 233 DOM
-
2026-06-17days on market $110,000 Active 232 DOM
-
2026-06-16days on market $110,000 Active 231 DOM
-
2026-06-15days on market $110,000 Active 230 DOM
-
2026-06-13days on market $110,000 Active 228 DOM
-
2026-06-12days on market $110,000 Active 227 DOM
-
2026-06-09days on market $110,000 Active 224 DOM
-
2026-06-08days on market $110,000 Active 223 DOM
-
2026-06-08days on market $110,000 Active 222 DOM
-
2026-06-04days on market $110,000 Active 218 DOM
-
2026-06-02days on market $110,000 Active 217 DOM
-
2026-06-01days on market $110,000 Active 216 DOM
-
2026-05-31days on market $110,000 Active 215 DOM
-
2026-05-19price $110,000
-
2025-10-28$130,000 Active
ⓘ Source: listings_history table (triggers on properties + properties_extension) + one-shot
backfill from property_details.listing_events for pre-trigger history.
Climate risk First Street
- Flood 1/10 Low FEMA zone X (unshaded) · 0% chance over 30 yrs
- Wildfire 1/10 Low
- Heat 3/10 Moderate 7 d/yr ≥99°F today · 17 d/yr by 30 yrs out
- Wind 2/10 Low
- Air quality 2/10 Low 1 unhealthy d/yr today · 2 by 30 yrs out
Nearby sold comps map
Loading sold comps map…
Walkable amenities ~0.75 mi
Loading nearby amenities…
Taxation est. · year 1
- Rental income
- $14,043
- − Mortgage interest
- −$6,162
- − Property taxes
- −$1,650
- − Insurance
- −$550
- − Repairs & maintenance
- −$1,123
- − Management
- −$1,123
- − Depreciation
- −$3,200
- Taxable income
- $235
- Est. tax owed @ 24.0%
- −$56
- After-tax cash flow
- $1,916/yr
For passive investors: Depreciation is non-cash, so a rental often shows a tax loss while cash-flowing — sheltering income. Rental losses are passive: they offset passive income freely, and up to $25,000/yr can offset ordinary (W-2) income if you actively participate and your MAGI is under $100k (phasing out to $0 by $150k); unused losses carry forward. On sale, claimed depreciation is recaptured at up to 25%, and gains may owe capital-gains tax (a 1031 exchange can defer both). Figures are a year-1 estimate at your 24.0% rate — not tax advice; consult a CPA.
Condition & rehab AI · 7 photos
The home requires significant exterior repairs and maintenance, including painting, foundation repair, landscaping, and fencing. These improvements would significantly increase its value and appeal to potential buyers or renters.
Repairs flagged
- Major exterior siding — Significant damage and discoloration visible in the independent image.
- Major exterior foundation — Visible cracks and unevenness in the independent image.
- Major exterior landscaping — Significant overgrowth and disrepair in the independent image.
- Major exterior fencing — Visible damage and unevenness in the independent image.
Value-add opportunities
- Both paint exterior — Fresh paint can improve the curb appeal and value of the home.
- Both repair foundation — A repaired foundation can improve the structural integrity and value of the home.
- Both landscape yard — A well-maintained yard can improve the curb appeal and value of the home.
- Both repair fencing — A repaired fence can improve the safety and value of the home.
Renovation cost estimate screening
| Repair item | Severity | Est. cost |
|---|---|---|
| exterior siding · Significant damage and discoloration visible in the independent image. | Major | $15,000–50,000 |
| exterior foundation · Visible cracks and unevenness in the independent image. | Major | $15,000–50,000 |
| exterior landscaping · Significant overgrowth and disrepair in the independent image. | Major | $15,000–50,000 |
| exterior fencing · Visible damage and unevenness in the independent image. | Major | $15,000–50,000 |
| Total estimated repair cost · 4 items | $60,000–200,000 |
Value-add ROI direction
- Both paint exterior — Fresh paint can improve the curb appeal and value of the home. ↑
- Both repair foundation — A repaired foundation can improve the structural integrity and value of the home. ↑
- Both landscape yard — A well-maintained yard can improve the curb appeal and value of the home. ↑
- Both repair fencing — A repaired fence can improve the safety and value of the home. ↑
ⓘ Cost ranges are severity-bucket heuristics (US national rule-of-thumb). Get contractor quotes + a written scope before underwriting a rehab budget.
Schools (NCES district)
- District
- Fostoria City
- NCES district ID
- 3904399
- Math proficiency
- 30% ▼ -21.00%
- Reading proficiency
- 39% ▼ -10.00%
- Median HH income
- $36,902
- Composite
- 28.65/100
- National rank
- #6702
- State rank
- #566 of 656 in OH
Livability — Fostoria
- Score
- 76/100
- State rank
- #216
- US rank
- #3330
Category grades
Schools grade is shown separately in the Schools card above.
Census & demographics
- Census place
- Fostoria, OH
- County
- Seneca · 70,739 people
- City population
- 18,409
- Population (ZIP)
- 18,409
- Household income
- $61,589
- Rent vs Own
- Severe rent burden
- 9.8
Population outlook (Seneca County) Hauer SSP2
- Today (2025)
- 54,243 people
- By 2030
- 52,947 · -2.4%
- By 2040
- 49,842 · -8.1%
- By 2050
- 46,689 · -13.9%
- By 2075
- 39,889 · -26.5%
- By 2100
- 32,155 · -40.7%
Race, ethnicity, and origin ACS 2023
- Neighborhood character
- Predominantly White (80%)
- Race & ethnicity
- White 80% Hispanic / Latino 10% Two or more races 7% Black 3% Asian 1%
- Hispanic origin (detail)
- Mexican 9%
- Common ancestry
- Lithuanian 2% Italian 2% Slovak 1%
- Foreign-born
- 3% · Canada, South Korea
- Languages at home
- 94% English-only · Spanish 4%
Political lean MEDSL · Seneca
- 2024 margin
- Solid R (+37.5) · D 30.7% · R 68.2% · Other 1.0%
- 2008→2024 swing
- -34.8pp toward R · 2008: -2.7pp · 2024: -37.5pp
- All cycles
- 2024: R+37.5 2020: R+34.2 2016: R+31.2 2012: R+8.4 2008: R+2.7
Not yet ingested
- Civics
- —
Market trends
- HPI YoY
- ▼ -42.93%
- Current HPI
- 224.2583
- Rent YoY
- —
- Metro
- —
- State GDP YoY
- ▲ 1.98%
- F500 in state
- 48
Industry mix (Fortune 500 HQ in OH)
| Industry | F500 HQs | Revenue |
|---|---|---|
| Insurance | 3 | $145B |
|
||
| Industrial Machinery | 3 | $49B |
|
||
| Financial Services | 3 | $24B |
|
||
| Consumer Goods | 2 | $93B |
|
||
| Aerospace / Defense | 2 | $47B |
|
||
| Utilities | 2 | $33B |
|
||
Price history
-15.4% since first listed2 events — show timeline
- 2026-05-19 Price Changed $110,000 WCARE
- 2025-10-28 Listed $130,000 WCARE
Cash-flow waterfall
monthlySold comps — $/sqft
last 12 mo · ≤1 miLoading sold comps…