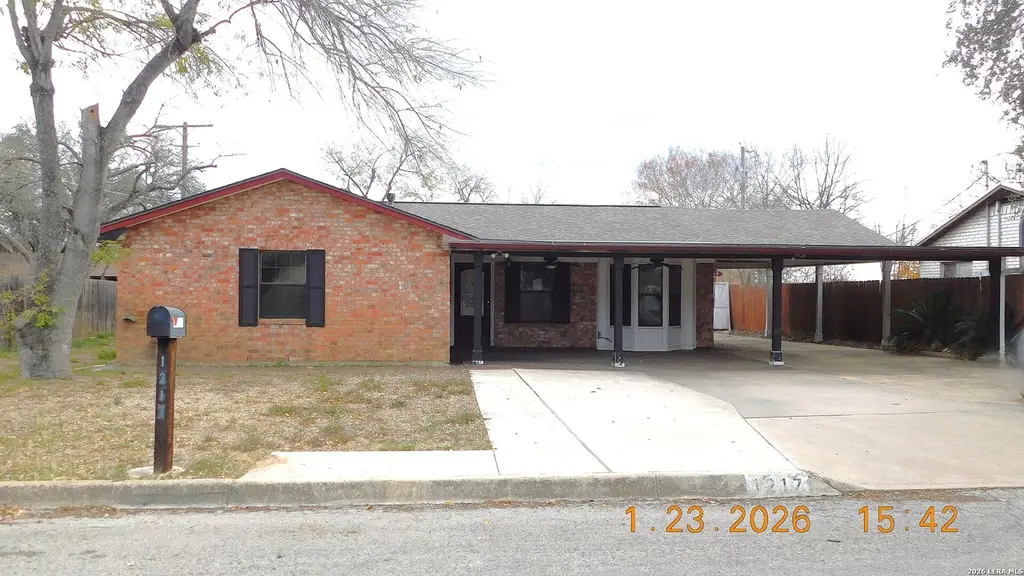
1217 Vivian · Pleasanton, TX
Flood risk 1/10 · Minimal
- FEMA flood zone
- X (unshaded)
- Chance of flooding over 30 yrs
- 0.0%
- Est. flood insurance / yr
- $507 – $1,088
Fire risk 5/10 · Moderate
- Est. fire insurance / yr
- $1,222 – $2,270
Heat risk 8/10 · Major
- Hot days now (above 111°F)
- 7 days/yr
- Hot days in 30 yrs
- 23 days/yr
Wind risk 8/10 · Major
- Chance of severe wind over 30 yrs
- 80.0%
Air-quality risk 1/10 · Minimal
- Unhealthy air days now
- 0 days/yr
- Unhealthy air days in 30 yrs
- 0 days/yr
Risk factors via First Street. Map © Google.
Why this score? — see what drove the C- grade
The composite is a weighted blend of 9 inputs, each scored 0–100. Each bar is that input's sub-score; the figure is the points it added to the 100-point composite (weight × sub-score).
- ARV discount +15.0/15.0
- Cash flow +14.3/30.0
- 1% rule +5.2/10.0
- DSCR +4.4/10.0
- Schools +3.2/10.0
- Livability +3.2/5.0
- Rent growth +2.5/5.0
- Condition / age +2.5/5.0
- Appreciation +0.0/10.0
$159,700
🖨 Deal sheet 📄 Offer letter ✓ Due diligence
Listing remarks MLS
Nice size home in a short Cul-de-sac. Not a lot of traffic. Near school. Listed below appraisal district value and has a lot of potential. Could possibly go FHA 203k to include updating.
Key facts
- Near school
- Cul-de-sac
- 7,666 sq ft lot
Tags
Neighborhood map
What this means for you Summary
Snapshot
- This is a 3-bed/2.0-bath single-family listed at $160k.
Deal economics
- At list price, monthly cash flow is $30 ($359/yr) — positive.
- The deal already cash-flows at list — no discount required.
- Meets the 1% rule at list price ($2k rent vs $160k).
- Recommended offer: $145k (9.0% below list) — sets the bar for market timing.
- Cap rate 6.5% vs local median 3.3% in Pleasanton — top-decile yield for the area; either an underpriced asset or a hidden risk that comps aren't pricing in. Stress-test before assuming the spread holds.
Location & tenants
- Location reads 65/100 on livability (#679 in TX) — a middle-class / working-renter tenant base. Strengths: cost of living A+, housing A+, employment B; Watch: schools C-, amenities F, commute F.
- Pleasanton ISD (town): math 36% / reading 37% proficiency, ranked #470 of 826 in TX (top 57%) — families likely to look elsewhere, expect single-tenant / working-renter base with shorter leases.
- Market conditions: 233 active listings in the ZIP; 5 comparable units currently listed for rent nearby; rentals at typical pace (median 18d on market — plan ~3-4 weeks tenant-placement turnaround); 40% of comp listings sitting > 30 days — soft ceiling on asking rent; 224 units permitted in Atascosa County in 2024 (0 in 5+ unit buildings).
Forward outlook
- Local home prices are declining (-3.0%/yr); year-one equity from $1k of loan paydown is wiped out by about $5k of value loss. Plan a longer hold.
- Atascosa County population projected at +41% by 2050 — long-run rental-demand tailwind backs the buy-and-hold thesis.
Negotiation context
- It's been on market 110 days — a 9% lower offer ($145k) is reasonable based on typical stale-listing flexibility.
- 4 sale attempts since 8y ago; this cycle's ask has dropped $20k (11%) from the opening price — seller is motivated, your offer sets the floor, not the list.
Risks & watch-outs
- Watch-outs: property tax is 2.7% of price.
- Climate carrying-cost: severe wind risk, 80% chance of damaging wind over 30y; moderate wildfire risk; extreme-heat days projected 7→23/yr by 2055 (HVAC capex compounding) — expect insurance premiums to compound above CPI over the hold.
Questions for the listing agent
- It's been on market 110 days. Have you received any prior offers? Is the seller open to a 9% concession, seller financing, or rate buy-down credit?
- Property tax is high relative to price — has the assessment been appealed recently, and will the sale trigger a re-assessment?
- Why hasn't it sold? Are there any deal-killer items the seller is aware of (foundation, flood, title, zoning, code violations)?
- Is there a deadline driving the sale (1031 exchange, divorce, estate, relocation)? That informs how much negotiation room exists.
- What's the average days-on-market for RENTAL listings here right now (not sales)? A rising rental-DOM trend means longer vacancies and softer asking-rent achievability than the comps imply.
- What's the recent tenant-quality profile in this submarket — average credit score on applications, eviction rate, late-payment / NSF rate, and stable-employment percentage? A property-management company in the area should have these aggregated.
- How much new for-sale + rental construction is in the pipeline within 1–3 miles? Heavy new supply typically softens prices + rents 12–24 months out; constrained supply supports both.
Investment metrics
- 1% rule
- 1.02% ✓
- Cap rate
- 6.52%
- Cash-on-cash
- 0.80%
- DSCR
- 1.04
- GRM
- 8.2
CMA / ARV
- ARV (median comp)
- $252,712
- List price
- $159,700
- Delta
- -36.81%
- Verdict
- UNDERPRICED
- Comps
- 20 within 1.0 mi
Show comp detail 12 sales within ~0.75 mi
| Address | Dist | Beds/Ba | Sqft | Sold | Price | $/sf | Match |
|---|---|---|---|---|---|---|---|
| 230 Yorktown | 0.59mi | 3/2.0 | 1,625 (-1%) | 0mo | $289,900 | $178 | 71 |
| 1105 Maia | 0.27mi | 4/2.0 (+1) | 1,850 (+13%) | 1mo | $164,900 | $89 | 60 |
| 193 Bronco Rdg | 0.65mi | 4/2.0 (+1) | 1,600 (-2%) | 1mo | $186,999 | $117 | 60 |
| 224 Bunker Hl | 0.52mi | 3/2.0 | 1,470 (-10%) | 1mo | $299,000 | $203 | 58 |
| 176 Bronco Rdg | 0.69mi | 4/2.0 (+1) | 1,500 (-8%) | 1mo | $155,999 | $104 | 48 |
| 523 Mansfield | 0.69mi | 3/2.0 | 1,848 (+13%) | 1mo | $129,500 | $70 | 46 |
| 1707 Park Vw | 0.71mi | 3/2.0 | 1,836 (+12%) | 1mo | $405,000 | $221 | 46 |
| 181 Bronco Rdg | 0.68mi | 3/2.0 | 1,867 (+14%) | 1mo | $191,999 | $103 | 44 |
| 189 Bronco Rdg | 0.66mi | 3/2.0 | 1,402 (-14%) | 2mo | $177,999 | $127 | 44 |
| 165 Bronco Rdg | 0.70mi | 3/2.0 | 1,867 (+14%) | 2mo | $190,999 | $102 | 42 |
| 168 Bronco Rdg | 0.70mi | 3/2.0 | 1,402 (-14%) | 2mo | $181,999 | $130 | 42 |
| 152 Rawhide Rdg | 0.73mi | 4/3.0 (+1) | 1,795 (+10%) | 0mo | $242,999 | $135 | 40 |
Match score weights: distance 35% · size 25% · config 20% · recency 20%. Top-matched comps best support the ARV.
Projected returns pro-forma
-3.0% appreciation · 3.0% rent growth · sell at horizon
- IRR
- -14.9%
- Equity multiple
- 0.47×
- Total profit
- $-23,853
- Equity at exit
- $23,812
- IRR
- -6.2%
- Equity multiple
- 0.60×
- Total profit
- $-17,828
- Equity at exit
- $13,808
Cash invested: $44,716 (down + closing). Projections, not guarantees.
Landlord ↔ Tenant lean methodology
- Overall (STATE)
- 87 Strongly Landlord-Friendly
- State Texas
- 87 Strongly Landlord-Friendly · R+5
- County
- — inherits STATE
- City
- — inherits STATE
ZIP-level market 78064
- Home prices YoY
- -32.7%
- Active inventory
- 233
- Price-to-rent
- 8.2×
Monthly cashflow live
- Estimated rent
- $1,632 high interval (Pro) →
- Mortgage (P&I)
- −$837
- Tax from tax record
- −$356 /mo · $4,268/yr
- Insurance
- −$67
- HOA
- −$0
- Vacancy / Maint / Mgmt
- −$343
- Net cashflow
- $30
Break-even live
UW: 25.0% down · 7.5% · 30yr · 1.5% tax · 5.0% vac · 8.0% maint · 8.0% mgmt
Financing live
Cash to close
- Down payment
- $39,925
- Closing costs
- $4,791
- Reserves months
- —
- Total cash needed
- —
Loan-product check · same deal, 3 products live
Conventional
25% down · 7.5% · 30yr
- Down + closing
- —
- Monthly P&I
- —
- Monthly cashflow
- —
- DSCR
- —
- Eligible?
- —
Personal DTI + credit; lowest rate.
DSCR
20% down · 8.5% · 30yr
- Down + closing
- —
- Monthly P&I
- —
- Monthly cashflow
- —
- DSCR
- —
- Eligible?
- —
No personal income docs; deal must DSCR.
Hard money
10% down · 12.0% · 12mo
- Down + closing
- —
- Monthly P&I
- —
- Monthly cashflow
- —
- DSCR
- —
- Eligible?
- —
Short-term bridge; refi at stabilization.
Rent comps 5 comps
| Address | Beds | Baths | Sqft | Rent | $/sqft | DOM | Units | Dist |
|---|---|---|---|---|---|---|---|---|
| 404 High Meadow Dr Pleasanton, TX | 3.0 | 2.0 | 1428 | $1,800 | $1.26 | 17d | 1 | 0.17mi |
| 701 Oakhaven Rd Apt 504 Pleasanton, TX | 3.0 | 1.0 | 1075 | $1,100 | $1.02 | 43d | 1 | 0.66mi |
| 268 Cowboy Rdg Pleasanton, TX | 3.0 | 2.0 | 1200 | $1,525 | $1.27 | 12d | 1 | 0.79mi |
| 140 Maverick Cv Pleasanton, TX | 3.0 | 2.0 | 1450 | $1,800 | $1.24 | 14d | 1 | 0.84mi |
| 176 W White St Pleasanton, TX | 2.0 | 2.0 | 1120 | $1,100 | $0.98 | 43d | 1 | 0.87mi |
Listing history 19 events
-
2026-05-08historical Active Option 190-char remark
Show marketing remark (190 chars)
Nice size home in a short Cul-de-sac. Not a lot of traffic. Near school. Listed below appraisal district value and has a lot of potential. Could possibly go FHA 203k to include updating.
-
2026-04-16price $159,700 190-char remark
Show marketing remark (190 chars)
Nice size home in a short Cul-de-sac. Not a lot of traffic. Near school. Listed below appraisal district value and has a lot of potential. Could possibly go FHA 203k to include updating.
-
2026-04-08price $164,700 190-char remark
Show marketing remark (190 chars)
Nice size home in a short Cul-de-sac. Not a lot of traffic. Near school. Listed below appraisal district value and has a lot of potential. Could possibly go FHA 203k to include updating.
-
2026-03-20soldstatus Closed 204-char remark
Show marketing remark (204 chars)
HUD Case #514-070890. Lots to love with this all brick cutie in Pleasanton! Spacious 3 bed, 2.5 bath with huge living room, cute kitchen with lots of storage, and big, sunny bedrooms. Come check it out!
-
2026-03-10price $169,700 190-char remark
Show marketing remark (190 chars)
Nice size home in a short Cul-de-sac. Not a lot of traffic. Near school. Listed below appraisal district value and has a lot of potential. Could possibly go FHA 203k to include updating.
-
2026-02-05$179,700 New 190-char remark
Show marketing remark (190 chars)
Nice size home in a short Cul-de-sac. Not a lot of traffic. Near school. Listed below appraisal district value and has a lot of potential. Could possibly go FHA 203k to include updating.
-
2026-01-28soldstatus
-
2025-09-29historical 204-char remark
Show marketing remark (204 chars)
HUD Case #514-070890. Lots to love with this all brick cutie in Pleasanton! Spacious 3 bed, 2.5 bath with huge living room, cute kitchen with lots of storage, and big, sunny bedrooms. Come check it out!
-
2025-09-28$120,000 204-char remark
Show marketing remark (204 chars)
HUD Case #514-070890. Lots to love with this all brick cutie in Pleasanton! Spacious 3 bed, 2.5 bath with huge living room, cute kitchen with lots of storage, and big, sunny bedrooms. Come check it out!
-
2025-08-06historical
-
2025-04-28price $200,000
-
2025-03-26price $230,000
-
2025-02-06$250,000 Active
-
2018-12-17historical
-
2018-10-26price $189,999
-
2018-10-06price $194,999
-
2018-10-06price $194,500
-
2018-09-21$199,999 New
-
2014-07-03soldstatus
ⓘ Source: listings_history table (triggers on properties + properties_extension) + one-shot
backfill from property_details.listing_events for pre-trigger history.
Tax reassessment forecast TX · Resets to sale price
- Current annual tax
- $4,268 · $356/mo
- Projected year-2 tax
- $4,268 · $356/mo
- Expected delta
- $0/yr ($0/mo · 0.0%)
ⓘ Screening estimate from a state-policy table — verify with the county assessor before closing.
Climate risk First Street
- Flood 1/10 Low FEMA zone X (unshaded) · 0% chance over 30 yrs
- Wildfire 5/10 Major
- Heat 8/10 Severe 7 d/yr ≥111°F today · 23 d/yr by 30 yrs out
- Wind 8/10 Severe 80% chance of damaging wind over 30 yrs
- Air quality 1/10 Low 0 unhealthy d/yr today · 0 by 30 yrs out
Nearby sold comps map
Loading sold comps map…
Walkable amenities ~0.75 mi
Loading nearby amenities…
Taxation est. · year 1
- Rental income
- $19,589
- − Mortgage interest
- −$8,946
- − Property taxes
- −$4,268
- − Insurance
- −$798
- − Repairs & maintenance
- −$1,567
- − Management
- −$1,567
- − Depreciation
- −$4,646
- Taxable loss
- −$2,203
- Est. tax savings @ 24.0%
- +$529
- After-tax cash flow
- $888/yr
For passive investors: Depreciation is non-cash, so a rental often shows a tax loss while cash-flowing — sheltering income. Rental losses are passive: they offset passive income freely, and up to $25,000/yr can offset ordinary (W-2) income if you actively participate and your MAGI is under $100k (phasing out to $0 by $150k); unused losses carry forward. On sale, claimed depreciation is recaptured at up to 25%, and gains may owe capital-gains tax (a 1031 exchange can defer both). Figures are a year-1 estimate at your 24.0% rate — not tax advice; consult a CPA.
Schools (NCES district)
- District
- Pleasanton ISD
- NCES district ID
- 4835190
- Math proficiency
- 36% ▼ -2.00%
- Reading proficiency
- 37% ▲ 4.00%
- Median HH income
- $53,885
- Composite
- 31.97/100
- National rank
- #5843
- State rank
- #470 of 826 in TX
Livability — Pleasanton
- Score
- 65/100
- State rank
- #679
- US rank
- #12731
Category grades
Schools grade is shown separately in the Schools card above.
Census & demographics
- Census place
- Pleasanton, TX
- Population (ZIP)
- 16,420
Population outlook (Atascosa County) Hauer SSP2
- Today (2025)
- 57,233 people
- By 2030
- 61,729 · +7.9%
- By 2040
- 71,122 · +24.3%
- By 2050
- 80,906 · +41.4%
- By 2075
- 106,134 · +85.4%
- By 2100
- 122,415 · +113.9%
Race, ethnicity, and origin ACS 2023
- Neighborhood character
- Majority Hispanic (55%)
- Race & ethnicity
- Hispanic / Latino 55% White 41% Two or more races 27% Black 2%
- Hispanic origin (detail)
- Mexican 49%
- Common ancestry
- Romanian 2% Lithuanian 2% Portuguese 1%
- Foreign-born
- 7% · Canada
- Languages at home
- 67% English-only · Spanish 32% Other Indo-European 1% German/W. Germanic 1%
Political lean MEDSL · Atascosa
- 2024 margin
- Solid R (+43.3) · D 27.9% · R 71.3%
- 2008→2024 swing
- -32.8pp toward R · 2008: -10.5pp · 2024: -43.3pp
- All cycles
- 2024: R+43.3 2020: R+34.0 2016: R+29.1 2012: R+18.3 2008: R+10.5
Not yet ingested
- Civics
- —
Market trends
- HPI YoY
- ▼ -91.53%
- Current HPI
- 188.725
- Rent YoY
- —
- Metro
- —
- State GDP YoY
- ▲ 3.95%
- F500 in state
- 110
Industry mix (Fortune 500 HQ in TX)
| Industry | F500 HQs | Revenue |
|---|---|---|
| Energy | 16 | $1,198B |
|
||
| Technology | 5 | $198B |
|
||
| Engineering / Construction | 4 | $72B |
|
||
| Energy Services | 3 | $60B |
|
||
| Utilities | 3 | $41B |
|
||
| Healthcare | 2 | $330B |
|
||
Price history
-20.1% since first listed19 events — show timeline
- 2026-05-08 Contingent — LERA
- 2026-04-16 Price Changed $159,700 LERA
- 2026-04-08 Price Changed $164,700 LERA
- 2026-03-20 Sold (MLS) — NTREIS
- 2026-03-10 Price Changed $169,700 LERA
- 2026-02-05 Listed $179,700 LERA
- 2026-01-28 Sold (Public Records) — Public Records
- 2025-09-29 Listing Removed — NTREIS
- 2025-09-28 Listed $120,000 NTREIS
- 2025-08-06 Listing Removed — NTREIS
- 2025-04-28 Price Changed $200,000 NTREIS
- 2025-03-26 Price Changed $230,000 NTREIS
- 2025-02-06 Listed $250,000 NTREIS
- 2018-12-17 Listing Removed — LERA
- 2018-10-26 Price Changed $189,999 LERA
- 2018-10-06 Price Changed $194,999 LERA
- 2018-10-06 Price Changed $194,500 LERA
- 2018-09-21 Listed $199,999 LERA
- 2014-07-03 Sold (Public Records) — Public Records
Property tax history
+4.1%/yrLatest (2025): $4,268 · +13.1% YoY. Source: county tax records.
Cash-flow waterfall
monthlySold comps — $/sqft
last 12 mo · ≤1 miLoading sold comps…