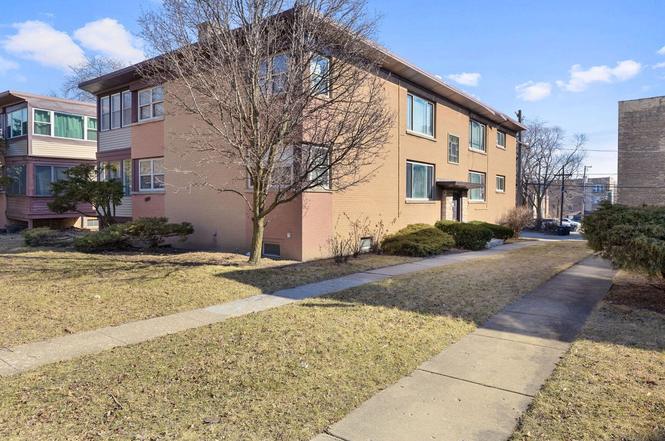
135 Ridge Ave Unit 1W · Evanston, IL
Flood risk 1/10 · Minimal
- FEMA flood zone
- X (unshaded)
- Chance of flooding over 30 yrs
- 0.0%
- Est. flood insurance / yr
- $507 – $1,088
Fire risk 1/10 · Minimal
- Est. fire insurance / yr
- $804 – $1,492
Heat risk 2/10 · Minimal
- Hot days now (above 98°F)
- 7 days/yr
- Hot days in 30 yrs
- 14 days/yr
Wind risk 2/10 · Minimal
- Chance of severe wind over 30 yrs
- 0.0%
Air-quality risk 4/10 · Minor
- Unhealthy air days now
- 5 days/yr
- Unhealthy air days in 30 yrs
- 6 days/yr
Risk factors via First Street. Map © Google.
Why this score? — see what drove the D grade
The composite is a weighted blend of 9 inputs, each scored 0–100. Each bar is that input's sub-score; the figure is the points it added to the 100-point composite (weight × sub-score).
- Cash flow +11.8/30.0
- ARV discount +7.5/15.0
- Schools +4.5/10.0
- 1% rule +4.4/10.0
- Livability +4.2/5.0
- Rent growth +3.6/5.0
- DSCR +3.5/10.0
- Condition / age +2.5/5.0
- Appreciation +0.0/10.0
$223,500
🖨 Deal sheet (PDF) 📄 Offer letter ✓ Due diligence
Listing remarks
Welcome to this beautiful sun-drenched two-bedroom, one-bathroom condominium, located in beautiful Evanston, Illinois. In a two-story four-unit building, the spacious thoughtfully designed layout features generously sized bedrooms, and inviting living area filled with natural light. This home is equipped with central AC and ceiling fan in the bedrooms. In addition to the comfortable interior, the unit includes a valuable private basement storage/laundry room, offering tons of extra space. It includes one assigned parking space, and one assigned guest parking space. This home is located near vibrant shopping area, scenic parks, local schools, and a wide variety of restaurants. This home offe
Key facts
- Local schools
- Scenic parks
- $200 HOA
Tags
Neighborhood map
What this means for you Summary
Snapshot
- This is a 2-bed/1.0-bath condo listed at $224k.
Deal economics
- At list price, monthly cash flow is $-62 ($-741/yr) — negative.
- To cash-flow at today's rent, offer at most $213k (4.9% below list).
- To meet the 1% rule (rent ≥ 1% of price), the offer needs to be $210k (6.0% below list).
- Recommended offer: $210k (6.0% below list) — sets the bar for 1% rule.
- Cap rate 6.0% vs local median 3.0% in Evanston — top-decile yield for the area; either an underpriced asset or a hidden risk that comps aren't pricing in. Stress-test before assuming the spread holds.
Location & tenants
- Location reads 85/100 on livability (#26 in IL, #464 nationally) — a professional / high-income tenant draw. Strengths: amenities A+, commute A+, employment A+; Watch: cost of living F.
- Evanston Twp Hsd 202 (urban): math 47% / reading 52% proficiency, ranked #54 of 620 in IL (top 9%) — families likely to look elsewhere, expect single-tenant / working-renter base with shorter leases.
- Zoned schools: Oakton Elem School (math 17% / reading 22%, grade F, #1,054 of 2,056 statewide, top 54%, 393 students, 0% FRL); Chute Middle School (math 27% / reading 32%, grade F, #256 of 665 statewide, top 41%, 581 students, 0% FRL); Evanston Twp High School (math 47% / reading 52%, grade D, #44 of 693 statewide, top 7%, 3,691 students, 0% FRL).
- Zoned-school proficiency averages 33% at this address vs 50% district-wide (-17 pts) — the specific schools serving this property underperform the Evanston Twp Hsd 202 average; the district grade overstates school quality for this exact location.
- Market conditions: Rents rising fast (+4.3%/yr); 75 active listings in the ZIP; 40 comparable units currently listed for rent nearby; rentals at typical pace (median 19d on market — plan ~3-4 weeks tenant-placement turnaround); solid renter incomes; 6,272 units permitted in Cook County in 2024 (4,658 in 5+ unit buildings).
Forward outlook
- Local home prices are declining (-3.0%/yr); year-one equity from $2k of loan paydown is wiped out by about $7k of value loss. Plan a longer hold.
Negotiation context
- It's been on market 42 days — a 3% lower offer ($217k) is reasonable based on typical stale-listing flexibility.
- Current owner paid $110k; list at $224k implies a 102% gain — meaningful room to come down on a strong offer.
Risks & watch-outs
- Watch-outs: built in 1954 — expect roof / HVAC / electrical / plumbing capex.
Questions for the listing agent
- What do current leases actually rent for vs. the listed asking? Can we see a recent rent roll and the last 12 months of T-12 income?
- It's been on market 42 days. Have you received any prior offers? Is the seller open to a 6% concession, seller financing, or rate buy-down credit?
- Built in 1954 — when were the roof, HVAC, electrical panel, plumbing, and water heater last replaced?
- What does the HOA fee cover, when was the last increase, and are there any pending special assessments or reserve-fund shortfalls?
- Any open or pending special assessments — roof, HVAC, plumbing, elevator, façade? What's the per-unit balance and payoff schedule, and is the seller paying it off at close or rolling it to the buyer?
- Is there a deadline driving the sale (1031 exchange, divorce, estate, relocation)? That informs how much negotiation room exists.
- Schools are A-rated — typically a magnet for longer-tenancy family renters. What's the average tenant stay here, and is there a school-zone premium baked into asking?
- The area grade is low — what's the realistic commute time and amenity access for the typical tenant pool here? Any planned neighborhood developments (good or bad) we should know about?
- What's the average days-on-market for RENTAL listings here right now (not sales)? A rising rental-DOM trend means longer vacancies and softer asking-rent achievability than the comps imply.
- What's the recent tenant-quality profile in this submarket — average credit score on applications, eviction rate, late-payment / NSF rate, and stable-employment percentage? A property-management company in the area should have these aggregated.
- How much new apartment / multifamily construction is in the pipeline within 1–3 miles? Heavy new supply (>2% of stock underway) typically softens rents 12–24 months out; light construction supports rent growth.
Investment metrics
- 1% rule
- 0.94% ✗
- Cap rate
- 5.96%
- Cash-on-cash
- -1.18%
- DSCR
- 0.95
- GRM
- 8.9
CMA / ARV
No comps found within radius.
Projected returns pro-forma
-3.0% appreciation · 4.35% rent growth · sell at horizon
- IRR
- -16.5%
- Equity multiple
- 0.41×
- Total profit
- $-37,116
- Equity at exit
- $33,325
- IRR
- -5.7%
- Equity multiple
- 0.61×
- Total profit
- $-24,614
- Equity at exit
- $19,324
Cash invested: $62,580 (down + closing). Projections, not guarantees.
Landlord ↔ Tenant lean methodology
- Overall (STATE)
- 43 Moderately Tenant-Leaning
- State Illinois
- 43 Moderately Tenant-Leaning · D+7
- County
- — inherits STATE
- City
- — inherits STATE
ZIP-level market 60202
- Rents YoY
- 4.3%
- Active inventory
- 75
- Price-to-rent
- 8.9×
Monthly cashflow live
- Estimated rent
- $2,101 high interval (Pro) →
- Mortgage (P&I)
- −$1,172
- Tax from tax record
- −$256 /mo · $3,077/yr
- Insurance
- −$93
- HOA
- −$200
- Vacancy / Maint / Mgmt
- −$441
- Net cashflow
- $-62
Break-even live
Sensitivity live
| Price | -10% $65 | -5% $2 | +0% $-62 | +5% $-125 | +10% $-188 |
|---|---|---|---|---|---|
| Rent | -10% $-228 | -5% $-145 | +0% $-62 | +5% $21 | +10% $104 |
| Rate | -1.0pp $51 | -0.5pp $-5 | base $-62 | +0.5pp $-120 | +1.0pp $-179 |
UW: 25.0% down · 7.5% · 30yr · 1.5% tax · 5.0% vac · 8.0% maint · 8.0% mgmt
Financing live
Cash to close
- Down payment
- $55,875
- Closing costs
- $6,705
- Reserves months
- —
- Total cash needed
- —
Loan-product check · same deal, 3 products live
Conventional
25% down · 7.5% · 30yr
- Down + closing
- —
- Monthly P&I
- —
- Monthly cashflow
- —
- DSCR
- —
- Eligible?
- —
Personal DTI + credit; lowest rate.
DSCR
20% down · 8.5% · 30yr
- Down + closing
- —
- Monthly P&I
- —
- Monthly cashflow
- —
- DSCR
- —
- Eligible?
- —
No personal income docs; deal must DSCR.
Hard money
10% down · 12.0% · 12mo
- Down + closing
- —
- Monthly P&I
- —
- Monthly cashflow
- —
- DSCR
- —
- Eligible?
- —
Short-term bridge; refi at stabilization.
Rent comps 40 comps
| Address | Beds | Baths | Sqft | Rent | $/sqft | DOM | Units | Dist |
|---|---|---|---|---|---|---|---|---|
| 243 Ridge Ave Evanston, IL | 2.0 | 1.0 | 1200 | $1,745 | $1.45 | 26d | 1 | 0.12mi |
| 245 Ridge Ave Evanston, IL | 1.0 | 1.0 | 900 | $1,550 | $1.72 | 26d | 1 | 0.13mi |
| 336 Ridge Ave #2 Evanston, IL | 2.0 | 1.0 | 950 | $2,250 | $2.37 | 26d | 1 | 0.23mi |
| 419 Ridge Ave Unit L Evanston, IL | 2.0 | 1.0 | 1000 | $1,925 | $1.93 | 0d | 1 | 0.33mi |
| 100 Chicago Ave Evanston, IL | 1.0–2.0 | 1.0–2.0 | 945 | $2,995 | $3.17 | 26d | 3 | 0.40mi |
| 415 W Howard St Evanston, IL | 1.0 | 1.0 | 798 | $2,162 | $2.71 | 26d | 1 | 0.47mi |
| 415 W Howard St Evanston, IL | 2.0 | 2.0 | 1133 | $2,466 | $2.18 | 14d | 1 | 0.47mi |
| 609 Oakton St Unit 3A Evanston, IL | 3.0 | 2.0 | 1250 | $2,250 | $1.80 | 26d | 1 | 0.47mi |
| 1507 W Howard St Unit 19G1 Evanston, IL | 1.0 | 1.0 | 800 | $1,350 | $1.69 | 26d | 1 | 0.51mi |
| 1322 Oakton St Unit 6 Evanston, IL | 1.0 | 1.0 | 1200 | $2,195 | $1.83 | 26d | 1 | 0.51mi |
| 916 Reba Pl Evanston, IL | 1.0 | 1.0 | 700 | $1,795 | $2.56 | 26d | 1 | 0.59mi |
| 539 Hinman Ave Evanston, IL | 2.0–3.0 | 1.0–2.0 | 1325 | $2,595 | $1.96 | 5d | 2 | 0.61mi |
| 610 Hinman Ave Evanston, IL | 1.0–3.0 | 1.0–2.0 | 912 | $2,070 | $2.27 | 8d | 6 | 0.64mi |
| 555 Hinman Ave Evanston, IL | 2.0 | 1.0 | 1050 | $2,200 | $2.10 | 17d | 2 | 0.65mi |
| 605 Hinman Ave Unit 605-3M Evanston, IL | 3.0 | 2.0 | 1235 | $2,495 | $2.02 | 9d | 1 | 0.66mi |
| 605 Hinman Ave Unit 3M Evanston, IL | 3.0 | 2.0 | 1235 | $2,495 | $2.02 | 8d | 1 | 0.66mi |
| 611 Wesley Ave Unit 1 Evanston, IL | 2.0 | 1.5 | 1200 | $2,750 | $2.29 | 26d | 1 | 0.68mi |
| 647 Asbury Ave Unit 2 Evanston, IL | 2.0 | 2.0 | 1050 | $2,595 | $2.47 | 4d | 1 | 0.70mi |
| 704 Hinman Ave Evanston, IL | 1.0–2.0 | 1.0 | 850 | $1,785 | $2.10 | 26d | 1 | 0.74mi |
| 524 Michigan Ave Unit 2S Evanston, IL | 2.0 | 1.0 | 900 | $1,950 | $2.17 | 22d | 1 | 0.74mi |
| 524 Michigan Ave Evanston, IL | 2.0 | 1.0 | 1000 | $2,050 | $2.05 | 14d | 1 | 0.74mi |
| 718 Hinman Ave Unit 24E2 Evanston, IL | 2.0 | 1.0 | 1100 | $1,750 | $1.59 | 26d | 1 | 0.77mi |
| 718 Hinman Ave Unit 18GD Evanston, IL | 2.0 | 1.0 | 1100 | $1,635 | $1.49 | 26d | 1 | 0.77mi |
| 718 Hinman Ave Unit 21N2 Evanston, IL | 2.0 | 1.0 | 1100 | $1,695 | $1.54 | 26d | 1 | 0.77mi |
| 800 Washington St Unit 2 Evanston, IL | 1.0 | 1.0 | 700 | $1,895 | $2.71 | 9d | 1 | 0.81mi |
| 800 Washington St Evanston, IL | 1.0 | 1.0 | 700 | $1,995 | $2.85 | 18d | 1 | 0.81mi |
| 800 Custer Ave Evanston, IL | 1.0 | 1.0 | 750 | $1,695 | $2.26 | 0d | 1 | 0.81mi |
| 907 Washington St Unit 1C Evanston, IL | 2.0 | 1.0 | 1000 | $1,745 | $1.75 | 9d | 1 | 0.83mi |
| 800 Hinman Ave Evanston, IL | 1.0 | 1.0 | 587 | $1,995 | $3.40 | 0d | 7 | 0.85mi |
| 730 Wesley Ave Unit 2 Evanston, IL | 2.0 | 1.0 | 1000 | $3,200 | $3.20 | 9d | 1 | 0.85mi |
| 740 Main St Evanston, IL | 2.0 | 2.0 | 596 | $3,550 | $5.95 | 26d | 28 | 0.89mi |
| 1605 Monroe St #4 Evanston, IL | 2.0 | 1.0 | 800 | $1,800 | $2.25 | 23d | 1 | 0.89mi |
| 805 Judson Ave Unit 3 Evanston, IL | 2.0 | 1.0 | 900 | $2,270 | $2.52 | 0d | 1 | 0.90mi |
| 805 Judson Ave Unit 3 Evanston, IL | 2.0 | 1.0 | 900 | $2,270 | $2.52 | 17d | 1 | 0.90mi |
| 805 Judson Ave Unit 3 Evanston, IL | 2.0 | 1.0 | 900 | $2,270 | $2.52 | 26d | 1 | 0.90mi |
| 805 Judson Ave Evanston, IL | 2.0 | 1.0 | 1000 | $2,270 | $2.27 | 14d | 1 | 0.90mi |
| 329 Kedzie St Unit 2 Evanston, IL | 3.0 | 2.0 | 1100 | $2,445 | $2.22 | 14d | 1 | 0.90mi |
| 820 Judson Ave Evanston, IL | 3.0 | 2.0 | 1140 | $2,335 | $2.05 | 5d | 1 | 0.90mi |
| 594 Sheridan Sq #3 Evanston, IL | 1.0 | 1.0 | 750 | $2,000 | $2.67 | 14d | 1 | 0.91mi |
| 807 Judson Ave Unit 3W Evanston, IL | 2.0 | 1.0 | 1125 | $2,700 | $2.40 | 20d | 1 | 0.91mi |
HOA detail condo
- Monthly dues
- $200 · $2,400/yr
- Likely covers
- parking
- Assessments
- None detected in remarks — confirm with the listing agent.
Listing history 3 events
-
2026-04-15status Pending
-
2026-03-03$223,500 Active
-
2000-08-01soldstatus $110,500
ⓘ Source: listings_history table (triggers on properties + properties_extension) + one-shot
backfill from property_details.listing_events for pre-trigger history.
Tax reassessment forecast IL · Partial reset (capped growth)
- Current annual tax
- $3,077 · $256/mo
- Projected year-2 tax
- $4,075 · $340/mo
- Expected delta
- +$998/yr (+$83/mo · 32.4%)
ⓘ Screening estimate from a state-policy table — verify with the county assessor before closing.
Climate risk First Street
- Flood 1/10 Low FEMA zone X (unshaded) · 0% chance over 30 yrs
- Wildfire 1/10 Low
- Heat 2/10 Low 7 d/yr ≥98°F today · 14 d/yr by 30 yrs out
- Wind 2/10 Low 0% chance of damaging wind over 30 yrs
- Air quality 4/10 Moderate 5 unhealthy d/yr today · 6 by 30 yrs out
Nearby sold comps map
Loading sold comps map…
Walkable amenities ~0.75 mi
Loading nearby amenities…
Taxation est. · year 1
- Rental income
- $25,213
- − Mortgage interest
- −$12,519
- − Property taxes
- −$3,077
- − Insurance
- −$1,118
- − Repairs & maintenance
- −$2,017
- − Management
- −$2,017
- − HOA
- −$2,400
- − Depreciation
- −$6,502
- Taxable loss
- −$4,437
- Est. tax savings @ 24.0%
- +$1,065
- After-tax cash flow
- $324/yr
For passive investors: Depreciation is non-cash, so a rental often shows a tax loss while cash-flowing — sheltering income. Rental losses are passive: they offset passive income freely, and up to $25,000/yr can offset ordinary (W-2) income if you actively participate and your MAGI is under $100k (phasing out to $0 by $150k); unused losses carry forward. On sale, claimed depreciation is recaptured at up to 25%, and gains may owe capital-gains tax (a 1031 exchange can defer both). Figures are a year-1 estimate at your 24.0% rate — not tax advice; consult a CPA.
Schools (NCES district)
- District
- Evanston Twp Hsd 202
- NCES district ID
- 1714490
- Math proficiency
- 47% ▼ -3.00%
- Reading proficiency
- 52% ▬ 0.00%
- Median HH income
- $72,672
- Composite
- 44.52/100
- National rank
- #2794
- State rank
- #54 of 620 in IL
Livability — Evanston
- Score
- 85/100
- State rank
- #26
- US rank
- #464
Category grades
Schools grade is shown separately in the Schools card above.
Census & demographics
- Census place
- Evanston, IL
- County
- Cook County · 4,486,803 people
- City population
- 76,085
- Metro
- Chicago-Naperville-Elgin, IL-IN-WI
- Population (ZIP)
- 32,341
- Household income
- $98,989
- Rent vs Own
- Severe rent burden
- 784.0
Population outlook (Cook County) Hauer SSP2
- Today (2025)
- 5,347,519 people
- By 2030
- 5,357,703 · +0.2%
- By 2040
- 5,324,924 · -0.4%
- By 2050
- 5,230,762 · -2.2%
- By 2075
- 4,785,735 · -10.5%
- By 2100
- 4,188,836 · -21.7%
Race, ethnicity, and origin ACS 2023
- Neighborhood character
- Diverse neighborhood (Simpson 0.65)
- Race & ethnicity
- White 54% Black 18% Hispanic / Latino 14% Two or more races 11% Asian 8%
- Hispanic origin (detail)
- Mexican 8%
- Common ancestry
- Romanian 8% Scotch-Irish 2% Portuguese 2%
- Foreign-born
- 19% · Canada, Jamaica, Vietnam
- Languages at home
- 73% English-only · Spanish 11% Other Indo-European 3% Russian/Polish/Slavic 2%
Political lean MEDSL · Cook
- 2024 margin
- Solid D (+42.0) · D 70.4% · R 28.4% · Other 1.2%
- 2008→2024 swing
- -11.4pp toward R · 2008: 53.4pp · 2024: 42.0pp
- All cycles
- 2024: D+42.0 2020: D+50.3 2016: D+53.0 2012: D+49.4 2008: D+53.4
Not yet ingested
- Civics
- —
Market trends
- HPI YoY
- ▼ -245.25%
- Current HPI
- 172.9605
- Rent YoY
- ▲ 4.35%
- Metro
- Chicago-Naperville-Elgin, IL-IN-WI
- State GDP YoY
- ▲ 1.59%
- F500 in state
- 60
Industry mix (Fortune 500 HQ in IL)
| Industry | F500 HQs | Revenue |
|---|---|---|
| Insurance | 4 | $201B |
|
||
| Consumer Goods | 4 | $87B |
|
||
| Industrial Machinery | 3 | $64B |
|
||
| Healthcare | 2 | $55B |
|
||
| Retail / Pharmacy | 1 | $148B |
|
||
| Agriculture / Food | 1 | $86B |
|
||
Price history
+102.3% since first listed3 events — show timeline
- 2026-04-15 Pending — MRED as Distributed by MLS Grid
- 2026-03-03 Listed $223,500 MRED as Distributed by MLS Grid
- 2000-08-01 Sold (Public Records) $110,500 Public Records
Property tax history
+0.3%/yrLatest (2023): $3,077 · +5.1% YoY. Source: county tax records.
Cash-flow waterfall
monthlySold comps — $/sqft
last 12 mo · ≤1 miLoading sold comps…