32600 State Highway 74 #140 · Homeland, CA
Flood risk 4/10 · Minor
- FEMA flood zone
- X (unshaded)
- Chance of flooding over 30 yrs
- 0.22%
- Est. flood insurance / yr
- $507 – $1,088
Fire risk 8/10 · Major
- Est. fire insurance / yr
- $659 – $1,223
Heat risk 7/10 · Major
- Hot days now (above 104°F)
- 7 days/yr
- Hot days in 30 yrs
- 18 days/yr
Wind risk 1/10 · Minimal
- Chance of severe wind over 30 yrs
- —
Air-quality risk 6/10 · Moderate
- Unhealthy air days now
- 10 days/yr
- Unhealthy air days in 30 yrs
- 14 days/yr
Risk factors via First Street. Map © Google.
Why this score? — see what drove the B+ grade
The composite is a weighted blend of 9 inputs, each scored 0–100. Each bar is that input's sub-score; the figure is the points it added to the 100-point composite (weight × sub-score).
- Cash flow +30.0/30.0
- ARV discount +15.0/15.0
- 1% rule +10.0/10.0
- DSCR +10.0/10.0
- Schools +3.7/10.0
- Rent growth +3.4/5.0
- Condition / age +2.5/5.0
- Livability +2.2/5.0
- Appreciation +0.0/10.0
$60,000
🖨 Deal sheet 📄 Offer letter ✓ Due diligence
Listing remarks
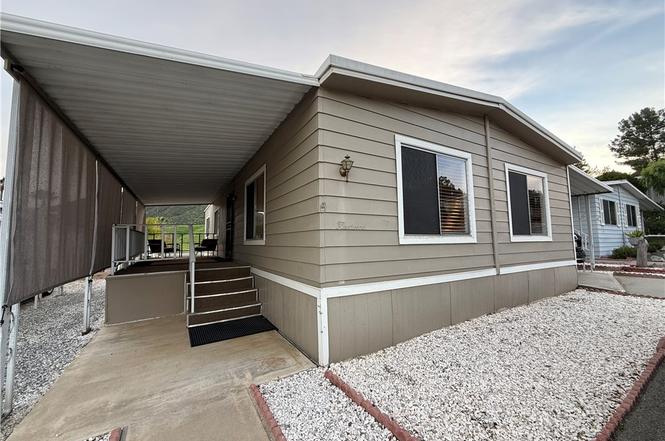
Welcome to the “California Caddy Shack” where relaxed coastal charm meets breathtaking views and effortless California living in a vibrant 55+ community designed for comfort, connection, and lifestyle. This beautifully maintained home offers front-row seats to stunning mountain scenery right from your windows and your covered front porch. Imagine unwinding in the evening with a cool California breeze, watching golden sunsets paint the sky. This is the lifestyle people move here for. The low-maintenance landscaping keeps life simple, while the oversized carport easily accommodates two to three vehicles, giving you space for guests or your weekend toys. Step inside and you’r
Key facts
- Breathtaking views
- Oversized carport
- Indoor spa
Tags
Property features AI
Finance
- Financial info: Monthly land lease of $885 (park-managed)
- HOA & community: Senior community; Park requires manager approval; Pets allowed
Exterior
- Parking: Located in Panorama Cove park
- Utilities: Public sewer; District/Public water
- Home design: Single-story mobile home (12' x 49'); Entry on front
- Construction: Mobile home remains on site; Year built: see remarks
- Exterior features: Community pool; Mountainous community setting; 0-1 Unit/Acre lot
Interior
- Bathrooms: 2 full bathrooms
- Interior features: Front entry; One-level home
- Laundry & utility: Washer and dryer included; Laundry in closet
Neighborhood map
What this means for you Summary
Snapshot
- This is a 2-bed/2.0-bath manufactured listed at $60k.
Deal economics
- At list price, monthly cash flow is $1k ($15k/yr) — positive.
- The deal already cash-flows at list — no discount required.
- Meets the 1% rule at list price ($2k rent vs $60k).
- Recommended offer: $53k (12.0% below list) — sets the bar for market timing.
- Cap rate 31.7% vs local median 5.9% in Homeland — top-decile yield for the area; either an underpriced asset or a hidden risk that comps aren't pricing in. Stress-test before assuming the spread holds.
Location & tenants
- Location reads 45/100 on livability (#1,297 in CA) — a working-class tenant base; expect higher turnover. Strengths: housing A+; Watch: cost of living C-, health & safety C-, employment D.
- Romoland Elementary (suburban): math 35% / reading 44% proficiency, ranked #699 of 1,400 in CA (top 50%) — families likely to look elsewhere, expect single-tenant / working-renter base with shorter leases.
- Market conditions: Rents rising (+3.7%/yr); 290 active listings in the ZIP; 2 comparable units currently listed for rent nearby; 9,195 units permitted in Riverside County in 2024 (1,512 in 5+ unit buildings).
- This rent runs 40% of the median local income ($64k/yr) — at the standard rent-burdened threshold; future hikes will face affordability resistance.
Forward outlook
- Local home prices are declining (-3.0%/yr); year-one equity from $415 of loan paydown is wiped out by about $2k of value loss. Plan a longer hold.
- Riverside County population projected at +22% by 2050 — long-run rental-demand tailwind backs the buy-and-hold thesis.
- At projected returns (-3.0% appreciation + 3.7% rent growth), your $17k cash investment doubles in ~2 years — after that, you're playing with house money.
Negotiation context
- It's been on market 127 days — a 12% lower offer ($53k) is reasonable based on typical stale-listing flexibility.
- 2 sale attempts since 4y ago with the ask held roughly flat each time — persistent listings suggest the price (not the market) is what's stuck; bring a comps-based counter.
Risks & watch-outs
- Climate carrying-cost: severe wildfire risk; extreme-heat days projected 7→18/yr by 2055 (HVAC capex compounding) — expect insurance premiums to compound above CPI over the hold.
Questions for the listing agent
- It's been on market 127 days. Have you received any prior offers? Is the seller open to a 12% concession, seller financing, or rate buy-down credit?
- Built in 1974 — when were the roof, HVAC, electrical panel, plumbing, and water heater last replaced?
- Why hasn't it sold? Are there any deal-killer items the seller is aware of (foundation, flood, title, zoning, code violations)?
- Is there a deadline driving the sale (1031 exchange, divorce, estate, relocation)? That informs how much negotiation room exists.
- Schools are F-rated, which usually means shorter tenancies and higher turnover. Who's the typical renter profile here, and what's been the actual vacancy rate?
- Crime grade is F in this area — have there been break-ins, vandalism, or insurance claims at this property in the last 3 years? What carrier currently insures it and at what premium?
- What's the average days-on-market for RENTAL listings here right now (not sales)? A rising rental-DOM trend means longer vacancies and softer asking-rent achievability than the comps imply.
- What's the recent tenant-quality profile in this submarket — average credit score on applications, eviction rate, late-payment / NSF rate, and stable-employment percentage? A property-management company in the area should have these aggregated.
- How much new for-sale + rental construction is in the pipeline within 1–3 miles? Heavy new supply typically softens prices + rents 12–24 months out; constrained supply supports both.
Investment metrics
- 1% rule
- 3.55% ✓
- Cap rate
- 31.70%
- Cash-on-cash
- 90.73%
- DSCR
- 5.04
- GRM
- 2.3
CMA / ARV
- ARV (on-the-fly)
- $106,800
- Comps found
- 12
Show comp detail 12 sales within ~0.75 mi
| Address | Dist | Beds/Ba | Sqft | Sold | Price | $/sf | Match |
|---|---|---|---|---|---|---|---|
| 32600 State Highway 74 #35 | 0.00mi | 2/2.0 | 1,246 (+4%) | 4mo | $62,000 | $50 | 90 |
| 32600 State Highway 74 #23 | 0.02mi | 2/2.0 | 1,164 (-3%) | 7mo | $75,000 | $64 | 88 |
| 32600 State Highway 74 #87 | 0.00mi | 2/2.0 | 1,056 (-12%) | 1mo | $77,000 | $73 | 79 |
| 32600 State Hwy 74 #5 | 0.03mi | 2/2.0 | 1,060 (-12%) | 1mo | $60,000 | $57 | 79 |
| 32600 State Highway 74 | 0.00mi | 2/2.0 | 1,040 (-13%) | 4mo | $69,000 | $66 | 74 |
| 26350-26350 Cortrite | 0.31mi | 3/2.0 (+1) | 1,248 (+4%) | 4mo | $425,000 | $341 | 70 |
| 26394 Joppe Ave | 0.25mi | 3/2.0 (+1) | 1,213 (+1%) | 14mo | $450,000 | $371 | 70 |
| 32600 State Highway 74 #38 | 0.00mi | 3/2.0 (+1) | 1,056 (-12%) | 7mo | $45,000 | $43 | 69 |
| 32600 Highway 74 #93 | 0.03mi | 3/2.0 (+1) | 1,333 (+11%) | 9mo | $118,500 | $89 | 68 |
| 32600 State Highway 74 #122 | 0.00mi | 3/2.0 (+1) | 1,344 (+12%) | 14mo | $149,900 | $112 | 64 |
| 26175 Melba Ave | 0.71mi | 2/2.0 | 1,080 (-10%) | 16mo | $180,000 | $167 | 37 |
| 26145 Melba | 0.69mi | 2/2.0 | 1,092 (-9%) | 21mo | $328,000 | $300 | 35 |
Match score weights: distance 35% · size 25% · config 20% · recency 20%. Top-matched comps best support the ARV.
Projected returns pro-forma
-3.0% appreciation · 3.74% rent growth · sell at horizon
- IRR
- 92.3%
- Equity multiple
- 5.33×
- Total profit
- $72,813
- Equity at exit
- $8,946
- IRR
- 95.3%
- Equity multiple
- 11.38×
- Total profit
- $174,374
- Equity at exit
- $5,188
Cash invested: $16,800 (down + closing). Projections, not guarantees.
Landlord ↔ Tenant lean methodology
- Overall (STATE)
- 18 Strongly Tenant-Friendly
- State California
- 18 Strongly Tenant-Friendly · D+13
- County
- — inherits STATE
- City
- — inherits STATE
ZIP-level market 92545
- Home prices YoY
- -24.6%
- Rents YoY
- 3.7%
- Active inventory
- 290
- Price-to-rent
- 2.3×
Monthly cashflow live
- Estimated rent
- $2,133 medium interval (Pro) →
- Mortgage (P&I)
- −$315
- Tax est. 1.5%
- −$75 /mo · $900/yr
- Insurance
- −$25
- HOA
- −$0
- Vacancy / Maint / Mgmt
- −$448
- Net cashflow
- $1,270
Break-even live
UW: 25.0% down · 7.5% · 30yr · 1.5% tax · 5.0% vac · 8.0% maint · 8.0% mgmt
Financing live
Cash to close
- Down payment
- $15,000
- Closing costs
- $1,800
- Reserves months
- —
- Total cash needed
- —
Loan-product check · same deal, 3 products live
Conventional
25% down · 7.5% · 30yr
- Down + closing
- —
- Monthly P&I
- —
- Monthly cashflow
- —
- DSCR
- —
- Eligible?
- —
Personal DTI + credit; lowest rate.
DSCR
20% down · 8.5% · 30yr
- Down + closing
- —
- Monthly P&I
- —
- Monthly cashflow
- —
- DSCR
- —
- Eligible?
- —
No personal income docs; deal must DSCR.
Hard money
10% down · 12.0% · 12mo
- Down + closing
- —
- Monthly P&I
- —
- Monthly cashflow
- —
- DSCR
- —
- Eligible?
- —
Short-term bridge; refi at stabilization.
Rent comps 2 comps
| Address | Beds | Baths | Sqft | Rent | $/sqft | DOM | Units | Dist |
|---|---|---|---|---|---|---|---|---|
| 33099 Old State Hwy Hemet, CA | 3.0 | 2.0 | 1440 | $2,300 | $1.60 | 1d | 1 | 0.51mi |
| 25806 Creag Ave Homeland, CA | 2.0 | 2.0 | 792 | $2,095 | $2.65 | 24d | 1 | 0.93mi |
Listing history 17 events
-
2026-06-18days on market $60,000 Active 127 DOM
-
2026-06-17days on market $60,000 Active 126 DOM
-
2026-06-16days on market $60,000 Active 125 DOM
-
2026-06-15days on market $60,000 Active 124 DOM
-
2026-06-13days on market $60,000 Active 122 DOM
-
2026-06-09days on market $60,000 Active 118 DOM
-
2026-06-08days on market $60,000 Active 117 DOM
-
2026-06-07days on market $60,000 Active 116 DOM
-
2026-06-04days on market $60,000 Active 113 DOM
-
2026-06-03days on market $60,000 Active 112 DOM
-
2026-06-02days on market $60,000 Active 111 DOM
-
2026-06-01days on market $60,000 Active 110 DOM
-
2026-05-31days on market $60,000 Active 109 DOM
-
2026-02-11$60,000 Active
-
2023-04-20historical
-
2023-01-10price $79,000
-
2022-10-21$99,900 Active
ⓘ Source: listings_history table (triggers on properties + properties_extension) + one-shot
backfill from property_details.listing_events for pre-trigger history.
Climate risk First Street
- Flood 4/10 Moderate FEMA zone X (unshaded) · 22% chance over 30 yrs
- Wildfire 8/10 Severe
- Heat 7/10 Severe 7 d/yr ≥104°F today · 18 d/yr by 30 yrs out
- Wind 1/10 Low
- Air quality 6/10 Major 10 unhealthy d/yr today · 14 by 30 yrs out
Nearby sold comps map
Loading sold comps map…
Walkable amenities ~0.75 mi
Loading nearby amenities…
Taxation est. · year 1
- Rental income
- $25,593
- − Mortgage interest
- −$3,361
- − Property taxes
- −$900
- − Insurance
- −$300
- − Repairs & maintenance
- −$2,047
- − Management
- −$2,047
- − Depreciation
- −$1,745
- Taxable income
- $15,192
- Est. tax owed @ 24.0%
- −$3,646
- After-tax cash flow
- $11,597/yr
For passive investors: Depreciation is non-cash, so a rental often shows a tax loss while cash-flowing — sheltering income. Rental losses are passive: they offset passive income freely, and up to $25,000/yr can offset ordinary (W-2) income if you actively participate and your MAGI is under $100k (phasing out to $0 by $150k); unused losses carry forward. On sale, claimed depreciation is recaptured at up to 25%, and gains may owe capital-gains tax (a 1031 exchange can defer both). Figures are a year-1 estimate at your 24.0% rate — not tax advice; consult a CPA.
Schools (NCES district)
- District
- Romoland Elementary
- NCES district ID
- 0633390
- Math proficiency
- 35% ▲ 2.00%
- Reading proficiency
- 44% ▲ 1.00%
- Median HH income
- $58,935
- Composite
- 37.36/100
- National rank
- #8931
- State rank
- #699 of 1400 in CA
Livability — Homeland
- Score
- 45/100
- State rank
- #1297
- US rank
- #26584
Category grades
Schools grade is shown separately in the Schools card above.
Census & demographics
- Census place
- Homeland, CA
- County
- Riverside County · 2,287,001 people
- Metro
- Riverside-San Bernardino-Ontario, CA
- Population (ZIP)
- 45,982
- Household income
- $63,770
- Rent vs Own
- Severe rent burden
- 1813.0
Population outlook (Riverside County) Hauer SSP2
- Today (2025)
- 2,664,475 people
- By 2030
- 2,802,692 · +5.2%
- By 2040
- 3,050,904 · +14.5%
- By 2050
- 3,256,783 · +22.2%
- By 2075
- 3,655,058 · +37.2%
- By 2100
- 3,766,594 · +41.4%
Race, ethnicity, and origin ACS 2023
- Neighborhood character
- Diverse neighborhood (Simpson 0.65)
- Race & ethnicity
- Hispanic / Latino 46% White 35% Two or more races 17% Black 8% Asian 5% Native American 1%
- Hispanic origin (detail)
- Mexican 40%
- Common ancestry
- Slovak 2% Lithuanian 2% Portuguese 1%
- Foreign-born
- 19% · Canada, Vietnam, Jamaica
- Languages at home
- 69% English-only · Spanish 27% Tagalog/Filipino 1% Other Indo-European 1%
Political lean MEDSL · Riverside
- 2024 margin
- Toss-up / Even · D 48.0% · R 49.3% · Other 2.6%
- 2008→2024 swing
- -3.6pp toward R · 2008: 2.3pp · 2024: -1.3pp
- All cycles
- 2024: R+1.3 2020: D+8.0 2016: D+4.3 2012: R+0.4 2008: D+2.3
Not yet ingested
- Civics
- —
Market trends
- HPI YoY
- ▼ -116.25%
- Current HPI
- 356.9414
- Rent YoY
- ▲ 3.74%
- Metro
- Riverside-San Bernardino-Ontario, CA
- State GDP YoY
- ▲ 3.21%
- F500 in state
- 116
Industry mix (Fortune 500 HQ in CA)
| Industry | F500 HQs | Revenue |
|---|---|---|
| Technology | 27 | $1,492B |
|
||
| Financial Services | 3 | $174B |
|
||
| Retail | 3 | $44B |
|
||
| Insurance | 3 | $26B |
|
||
| Media / Entertainment | 2 | $115B |
|
||
| Pharmaceuticals / Biotech | 2 | $62B |
|
||
Price history
-39.9% since first listed4 events — show timeline
- 2026-02-11 Listed $60,000 CRMLS
- 2023-04-20 Listing Removed — CRMLS
- 2023-01-10 Price Changed $79,000 CRMLS
- 2022-10-21 Listed $99,900 CRMLS
Cash-flow waterfall
monthlySold comps — $/sqft
last 12 mo · ≤1 miLoading sold comps…