402 N Weller St · Ottumwa, IA
Flood risk 1/10 · Minimal
- FEMA flood zone
- X (unshaded)
- Chance of flooding over 30 yrs
- 0.0%
- Est. flood insurance / yr
- $473 – $860
Fire risk 4/10 · Minor
- Est. fire insurance / yr
- $902 – $1,676
Heat risk 3/10 · Minor
- Hot days now (above 106°F)
- 7 days/yr
- Hot days in 30 yrs
- 15 days/yr
Wind risk 2/10 · Minimal
- Chance of severe wind over 30 yrs
- —
Air-quality risk 2/10 · Minimal
- Unhealthy air days now
- 1 days/yr
- Unhealthy air days in 30 yrs
- 1 days/yr
Risk factors via First Street. Map © Google.
Why this score? — see what drove the B grade
The composite is a weighted blend of 9 inputs, each scored 0–100. Each bar is that input's sub-score; the figure is the points it added to the 100-point composite (weight × sub-score).
- Cash flow +30.0/30.0
- ARV discount +10.3/15.0
- 1% rule +10.0/10.0
- DSCR +10.0/10.0
- Schools +4.3/10.0
- Livability +4.0/5.0
- Rent growth +2.5/5.0
- Condition / age +2.5/5.0
- Appreciation +0.0/10.0
$62,500
🖨 Deal sheet 📄 Offer letter ✓ Due diligence
Listing remarks
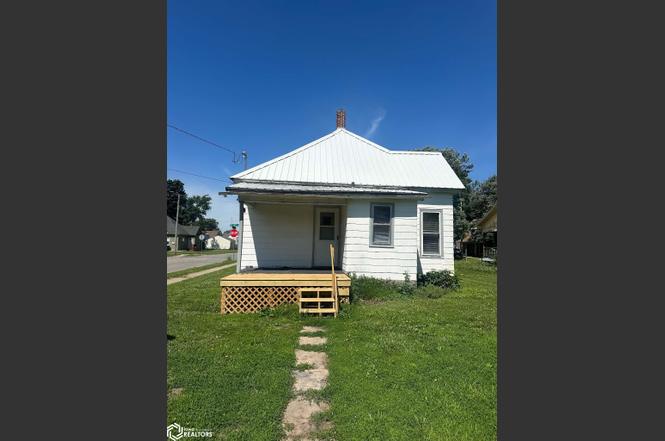
Charming 2-bedroom, 1-bath home situated on a desirable corner lot! This property offers a large backyard with plenty of room for outdoor entertaining, gardening, pets, or future improvements. The corner lot provides added privacy and extra outdoor space, while the home's inviting interior makes it perfect for first-time buyers, downsizers, or investors. Conveniently located and full of potential, this property is ready for its next owner to make it their own.
Key facts
- Extra outdoor space
- Added privacy
- Outdoor entertaining
Tags
Property features AI
Exterior
- Parking: Gravel driveway/parking
- Utilities: Public sewer
- Home design: Single family residence; Residential property
- Construction: Constructed with other/unspecified materials
- Exterior features: Gravel parking; Lot dimensions approximately 132 x 50
Interior
- Bathrooms: 1 full bathroom
- Heating & cooling: Central Air; Forced Air
- Interior features: Basement present; Central air conditioning; Forced air heating
Neighborhood map
What this means for you Summary
Snapshot
- This is a 2-bed/1.0-bath single-family listed at $62k.
Deal economics
- At list price, monthly cash flow is $580 ($7k/yr) — positive.
- The deal already cash-flows at list — no discount required.
- Meets the 1% rule at list price ($1k rent vs $62k).
- Cap rate 17.4% vs local median 5.9% in Ottumwa — top-decile yield for the area; either an underpriced asset or a hidden risk that comps aren't pricing in. Stress-test before assuming the spread holds.
Location & tenants
- Location reads 80/100 on livability (#91 in IA, #1,900 nationally) — a professional / high-income tenant draw. Strengths: cost of living A+, housing A+, health & safety A+; Watch: crime D-, employment D-.
- Ottumwa Community School District (town): math 50% / reading 54% proficiency, ranked #277 of 289 in IA (top 96%) — acceptable for families but not a draw, mixed tenant base, ~2y average lease.
- Market conditions: 186 active listings in the ZIP; 2 comparable units currently listed for rent nearby; 44 units permitted in Wapello County in 2024 (0 in 5+ unit buildings).
Forward outlook
- Local home prices are declining (-3.0%/yr); year-one equity from $432 of loan paydown is wiped out by about $2k of value loss. Plan a longer hold.
- Wapello County population projected at +5% by 2050 — modest demand growth; plan on rents tracking national, not racing it.
- At projected returns (-3.0% appreciation + 3.0% rent growth), your $18k cash investment doubles in ~3 years — after that, you're playing with house money.
Negotiation context
- Only 3 days on market — expect competitive offers; lowballing is unlikely to land.
- Current owner paid $14k; list at $62k implies a 346% gain — meaningful room to come down on a strong offer.
Risks & watch-outs
- Watch-outs: built in 1919 — expect roof / HVAC / electrical / plumbing capex.
Questions for the listing agent
- Built in 1919 — when were the roof, HVAC, electrical panel, plumbing, and water heater last replaced?
- Is there a deadline driving the sale (1031 exchange, divorce, estate, relocation)? That informs how much negotiation room exists.
- Crime grade is D in this area — have there been break-ins, vandalism, or insurance claims at this property in the last 3 years? What carrier currently insures it and at what premium?
- What's the average days-on-market for RENTAL listings here right now (not sales)? A rising rental-DOM trend means longer vacancies and softer asking-rent achievability than the comps imply.
- What's the recent tenant-quality profile in this submarket — average credit score on applications, eviction rate, late-payment / NSF rate, and stable-employment percentage? A property-management company in the area should have these aggregated.
- How much new for-sale + rental construction is in the pipeline within 1–3 miles? Heavy new supply typically softens prices + rents 12–24 months out; constrained supply supports both.
Investment metrics
- 1% rule
- 2.01% ✓
- Cap rate
- 17.43%
- Cash-on-cash
- 39.79%
- DSCR
- 2.77
- GRM
- 4.1
CMA / ARV
- ARV (on-the-fly)
- $66,720
- Comps found
- 12
Show comp detail 12 sales within ~0.75 mi
| Address | Dist | Beds/Ba | Sqft | Sold | Price | $/sf | Match |
|---|---|---|---|---|---|---|---|
| 182 N Moore St | 0.18mi | 2/1.0 | 796 (-5%) | 2mo | $63,500 | $80 | 82 |
| 202 N Moore St | 0.17mi | 2/1.0 | 878 (+5%) | 8mo | $59,000 | $67 | 77 |
| 138 S Moore St | 0.41mi | 2/1.0 | 864 (+4%) | 6mo | $55,000 | $64 | 69 |
| 422 W Finley Ave | 0.66mi | 2/1.0 | 832 (-0%) | 1mo | $125,000 | $150 | 68 |
| 312 S Moore St | 0.61mi | 2/1.0 | 812 (-3%) | 5mo | $59,500 | $73 | 63 |
| 513 S Sheridan Ave | 0.61mi | 2/1.0 | 867 (+4%) | 3mo | $50,000 | $58 | 62 |
| 612 Clinton Ave | 0.64mi | 2/1.0 | 906 (+9%) | 1mo | $57,000 | $63 | 55 |
| 518 Tuttle St | 0.65mi | 3/2.0 (+1) | 864 (+4%) | 0mo | $160,000 | $185 | 54 |
| 519 S Madison St | 0.71mi | 2/1.0 | 800 (-4%) | 8mo | $98,900 | $124 | 54 |
| 902 Clinton Ave | 0.68mi | 2/1.0 | 746 (-11%) | 4mo | $45,000 | $60 | 47 |
| 924 Clinton Ave. Ave | 0.69mi | 3/1.0 (+1) | 912 (+9%) | 0mo | $105,000 | $115 | 47 |
| 433 W Finley Ave | 0.66mi | 3/1.5 (+1) | 950 (+14%) | 6mo | $129,500 | $136 | 34 |
Match score weights: distance 35% · size 25% · config 20% · recency 20%. Top-matched comps best support the ARV.
Projected returns pro-forma
-3.0% appreciation · 3.0% rent growth · sell at horizon
- IRR
- 36.1%
- Equity multiple
- 2.53×
- Total profit
- $26,839
- Equity at exit
- $9,319
- IRR
- 42.8%
- Equity multiple
- 5.06×
- Total profit
- $70,991
- Equity at exit
- $5,404
Cash invested: $17,500 (down + closing). Projections, not guarantees.
Landlord ↔ Tenant lean methodology
- Overall (STATE)
- 83 Strongly Landlord-Friendly
- State Iowa
- 83 Strongly Landlord-Friendly · R+6
- County
- — inherits STATE
- City
- — inherits STATE
ZIP-level market 52501
- Active inventory
- 186
- Price-to-rent
- 4.1×
Monthly cashflow live
- Estimated rent
- $1,257 medium interval (Pro) →
- Mortgage (P&I)
- −$328
- Tax from tax record
- −$59 /mo · $704/yr
- Insurance
- −$26
- HOA
- −$0
- Vacancy / Maint / Mgmt
- −$264
- Net cashflow
- $580
Break-even live
UW: 25.0% down · 7.5% · 30yr · 1.5% tax · 5.0% vac · 8.0% maint · 8.0% mgmt
Financing live
Cash to close
- Down payment
- $15,625
- Closing costs
- $1,875
- Reserves months
- —
- Total cash needed
- —
Loan-product check · same deal, 3 products live
Conventional
25% down · 7.5% · 30yr
- Down + closing
- —
- Monthly P&I
- —
- Monthly cashflow
- —
- DSCR
- —
- Eligible?
- —
Personal DTI + credit; lowest rate.
DSCR
20% down · 8.5% · 30yr
- Down + closing
- —
- Monthly P&I
- —
- Monthly cashflow
- —
- DSCR
- —
- Eligible?
- —
No personal income docs; deal must DSCR.
Hard money
10% down · 12.0% · 12mo
- Down + closing
- —
- Monthly P&I
- —
- Monthly cashflow
- —
- DSCR
- —
- Eligible?
- —
Short-term bridge; refi at stabilization.
Rent comps 2 comps
| Address | Beds | Baths | Sqft | Rent | $/sqft | DOM | Units | Dist |
|---|---|---|---|---|---|---|---|---|
| 420 Minneopa Ave Unit 203 Ottumwa, IA | 2.0 | 1.0 | 700 | $1,150 | $1.64 | 43d | 1 | 1.47mi |
| 420 Minneopa Ave Unit 204 Ottumwa, IA | 2.0 | 1.0 | 800 | $1,350 | $1.69 | 43d | 1 | 1.47mi |
Listing history 4 events
-
2026-06-18days on market $62,500 Active 3 DOM
-
2026-06-17days on market $62,500 Active 2 DOM
-
2026-06-16remarks 464-char remark
-
2026-06-16$62,500 Active 1 DOM
ⓘ Source: listings_history table (triggers on properties + properties_extension) + one-shot
backfill from property_details.listing_events for pre-trigger history.
Tax reassessment forecast IA · Partial reset (capped growth)
- Current annual tax
- $704 · $59/mo
- Projected year-2 tax
- $843 · $70/mo
- Expected delta
- +$139/yr (+$12/mo · 19.7%)
ⓘ Screening estimate from a state-policy table — verify with the county assessor before closing.
Climate risk First Street
- Flood 1/10 Low FEMA zone X (unshaded) · 0% chance over 30 yrs
- Wildfire 4/10 Moderate
- Heat 3/10 Moderate 7 d/yr ≥106°F today · 15 d/yr by 30 yrs out
- Wind 2/10 Low
- Air quality 2/10 Low 1 unhealthy d/yr today · 1 by 30 yrs out
Nearby sold comps map
Loading sold comps map…
Walkable amenities ~0.75 mi
Loading nearby amenities…
Taxation est. · year 1
- Rental income
- $15,080
- − Mortgage interest
- −$3,501
- − Property taxes
- −$704
- − Insurance
- −$312
- − Repairs & maintenance
- −$1,206
- − Management
- −$1,206
- − Depreciation
- −$1,818
- Taxable income
- $6,332
- Est. tax owed @ 24.0%
- −$1,520
- After-tax cash flow
- $5,444/yr
For passive investors: Depreciation is non-cash, so a rental often shows a tax loss while cash-flowing — sheltering income. Rental losses are passive: they offset passive income freely, and up to $25,000/yr can offset ordinary (W-2) income if you actively participate and your MAGI is under $100k (phasing out to $0 by $150k); unused losses carry forward. On sale, claimed depreciation is recaptured at up to 25%, and gains may owe capital-gains tax (a 1031 exchange can defer both). Figures are a year-1 estimate at your 24.0% rate — not tax advice; consult a CPA.
Schools (NCES district)
- District
- Ottumwa Community School District
- NCES district ID
- 1922110
- Math proficiency
- 50% ▼ -9.00%
- Reading proficiency
- 54% ▲ 1.00%
- Median HH income
- $39,864
- Composite
- 43.46/100
- National rank
- #3004
- State rank
- #277 of 289 in IA
Livability — Ottumwa
- Score
- 80/100
- State rank
- #91
- US rank
- #1900
Category grades
Schools grade is shown separately in the Schools card above.
Census & demographics
- Census place
- Ottumwa, IA
- Population (ZIP)
- 30,341
Population outlook (Wapello County) Hauer SSP2
- Today (2025)
- 35,472 people
- By 2030
- 35,563 · +0.3%
- By 2040
- 36,083 · +1.7%
- By 2050
- 37,287 · +5.1%
- By 2075
- 43,898 · +23.8%
- By 2100
- 52,973 · +49.3%
Race, ethnicity, and origin ACS 2023
- Neighborhood character
- Predominantly White (74%)
- Race & ethnicity
- White 74% Hispanic / Latino 14% Two or more races 7% Black 4% Pacific Islander 2% Asian 2%
- Hispanic origin (detail)
- Mexican 9%
- Common ancestry
- Iranian 4% Italian 1% Slovak 1%
- Foreign-born
- 11% · Canada
- Languages at home
- 84% English-only · Spanish 10% Other Asian/Pacific 3% Tagalog/Filipino 1%
Political lean MEDSL · Wapello
- 2024 margin
- Solid R (+31.4) · D 33.6% · R 65.0% · Other 1.4%
- 2008→2024 swing
- -45.0pp toward R · 2008: 13.5pp · 2024: -31.4pp
- All cycles
- 2024: R+31.4 2020: R+23.6 2016: R+20.8 2012: D+11.8 2008: D+13.5
Not yet ingested
- Civics
- —
Market trends
- HPI YoY
- ▼ -94.66%
- Current HPI
- 174.6021
- Rent YoY
- —
- Metro
- —
- State GDP YoY
- ▲ 2.48%
- F500 in state
- 4
Industry mix (Fortune 500 HQ in IA)
| Industry | F500 HQs | Revenue |
|---|---|---|
| Financial Services | 1 | $16B |
|
||
| Retail / Convenience | 1 | $15B |
|
||
Price history
+346.4% since first listed3 events — show timeline
- 2026-06-15 Price Changed $62,500 IAR
- 2026-06-15 Listed $62,050 IAR
- 2009-06-25 Sold (Public Records) $14,000 Public Records
Property tax history
+1.0%/yrLatest (2025): $704 · +5.4% YoY. Source: county tax records.
Cash-flow waterfall
monthlySold comps — $/sqft
last 12 mo · ≤1 miLoading sold comps…