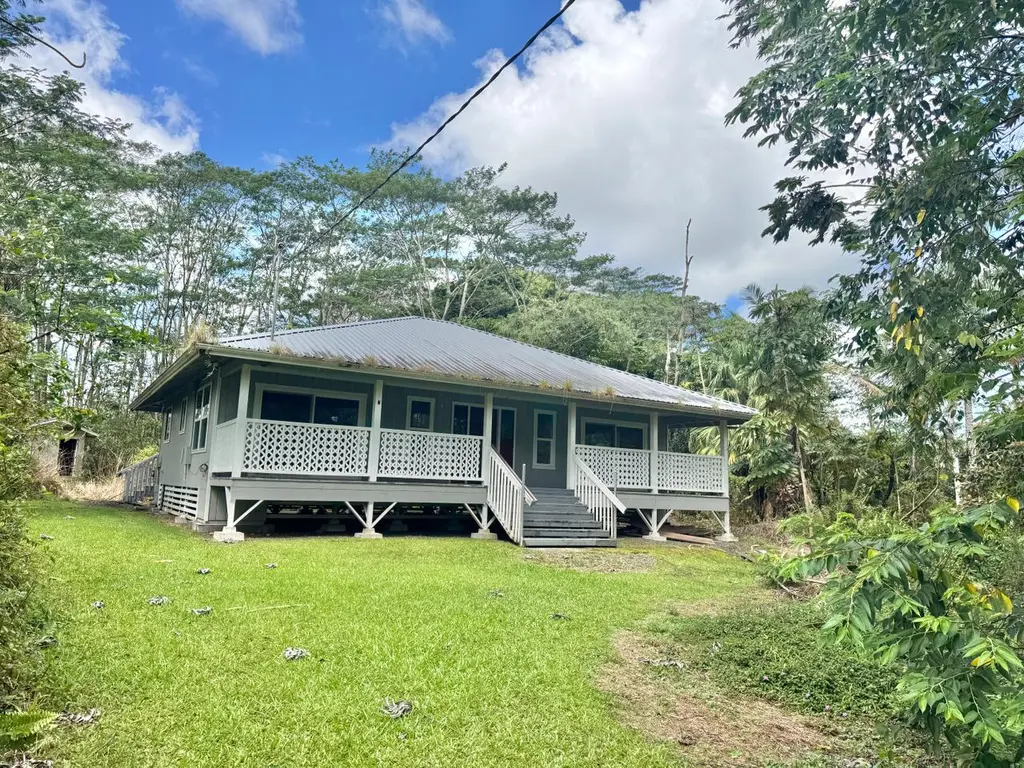
13-3360 Kupono St · Leilani Estates, HI
Flood risk 1/10 · Minimal
- FEMA flood zone
- X (unshaded)
- Chance of flooding over 30 yrs
- 0.0%
- Est. flood insurance / yr
- $507 – $1,088
Fire risk No data
- Est. fire insurance / yr
- —
Heat risk No data
- Hot days now (above threshold)
- —
- Hot days in 30 yrs
- —
Wind risk No data
- Chance of severe wind over 30 yrs
- —
Air-quality risk 1/10 · Minimal
- Unhealthy air days now
- —
- Unhealthy air days in 30 yrs
- —
Risk factors via First Street. Map © Google.
Why this score? — see what drove the D grade
The composite is a weighted blend of 9 inputs, each scored 0–100. Each bar is that input's sub-score; the figure is the points it added to the 100-point composite (weight × sub-score).
- ARV discount +15.0/15.0
- Cash flow +9.5/30.0
- Schools +3.7/10.0
- 1% rule +2.9/10.0
- DSCR +2.7/10.0
- Livability +2.6/5.0
- Rent growth +2.5/5.0
- Condition / age +2.5/5.0
- Appreciation +0.0/10.0
$265,000
🖨 Deal sheet (PDF) 📄 Offer letter ✓ Due diligence
Listing remarks
This 2 bedroom, 2 bath never lived in 1408sf home was started in 2018 and finaled 9-20-2024. Kenmore dishwasher, elite Fridge, gas with convection oven stove, above range microwave, washer dryer series 200; Koa slab island, 10,000 gal catchment tank with cover; 3 ceiling fans, 4 smoke detectors, laminate wood flooring throughout. 352' front lanai, 10x12 tool shed. 13-3360 Kupono St is in Lava Zone 1, Flood Zone X and is at 727 ft elevation. For 360 go to https://leilanirealestate.com/360/MLS729079/index. html
Key facts
- Elite fridge
- Kenmore dishwasher
- Koa slab island
Tags
Property features AI
Finance
- Other: Lava zone: 1; Full ownership indicated
- Financial info: Not used as a short-term vacation rental
- HOA & community: Association fee: $10
Exterior
- Parking: Unassigned parking
- Utilities: Electricity available; Catchment water; Cesspool sewer; No solid waste disposal service listed
- Home design: Fee simple ownership; Zoned A-1A; Not in an agriculture-dedicated zone; No unpermitted improvements reported; Located on paved road
- Exterior features: Interior lot; Graded topography
Interior
- Kitchen: Microwave; Oven
- Flooring: Laminate
- Bathrooms: 2 total bathrooms (2 full)
- Interior features: Laminate flooring
- Laundry & utility: Washer; Dryer
Neighborhood map
What this means for you Summary
Snapshot
- This is a 2-bed/2.0-bath single-family listed at $265k.
Deal economics
- At list price, monthly cash flow is $-184 ($-2k/yr) — negative.
- To cash-flow at today's rent, offer at most $238k (10.0% below list).
- To meet the 1% rule (rent ≥ 1% of price), the offer needs to be $210k (20.8% below list).
- Recommended offer: $210k (20.8% below list) — sets the bar for 1% rule.
Location & tenants
- Location reads 52/100 on livability (#144 in HI) — a working-class tenant base; expect higher turnover. Strengths: crime A+; Watch: health & safety C-, amenities F, commute F.
- Hawaii Department Of Education (suburban): math 32% / reading 50% proficiency, ranked #1 of 1 in HI (top 100%) — families likely to look elsewhere, expect single-tenant / working-renter base with shorter leases.
- Zoned schools: Keonepoko Elementary School (math 8% / reading 24%, grade F, #169 of 183 statewide, top 93%, 562 students, 75% FRL); Pahoa High & Intermediate School (math 17% / reading 42%, grade F, #35 of 43 statewide, top 86%, 723 students, 74% FRL) — zoned schools average 75% FRL vs 39% district-wide (36 pts higher); higher-poverty schools than district average — tighter screening recommended.
- Zoned-school proficiency averages 23% at this address vs 41% district-wide (-18 pts) — the specific schools serving this property underperform the Hawaii Department Of Education average; the district grade overstates school quality for this exact location.
- Market conditions: 388 active listings in the ZIP; 982 units permitted in Hawaii County in 2024 (0 in 5+ unit buildings).
Forward outlook
- Local home prices are declining (-3.0%/yr); year-one equity from $2k of loan paydown is wiped out by about $8k of value loss. Plan a longer hold.
- Hawaii County population projected at +24% by 2050 — long-run rental-demand tailwind backs the buy-and-hold thesis.
Negotiation context
- It's been on market 58 days — a 3% lower offer ($257k) is reasonable based on typical stale-listing flexibility.
- 6 sale attempts since 4y ago with the ask held roughly flat each time — persistent listings suggest the price (not the market) is what's stuck; bring a comps-based counter.
Questions for the listing agent
- What do current leases actually rent for vs. the listed asking? Can we see a recent rent roll and the last 12 months of T-12 income?
- It's been on market 58 days. Have you received any prior offers? Is the seller open to a 21% concession, seller financing, or rate buy-down credit?
- What does the HOA fee cover, when was the last increase, and are there any pending special assessments or reserve-fund shortfalls?
- Is there a deadline driving the sale (1031 exchange, divorce, estate, relocation)? That informs how much negotiation room exists.
- Schools are D-rated, which usually means shorter tenancies and higher turnover. Who's the typical renter profile here, and what's been the actual vacancy rate?
- The area grade is low — what's the realistic commute time and amenity access for the typical tenant pool here? Any planned neighborhood developments (good or bad) we should know about?
- What's the average days-on-market for RENTAL listings here right now (not sales)? A rising rental-DOM trend means longer vacancies and softer asking-rent achievability than the comps imply.
- What's the recent tenant-quality profile in this submarket — average credit score on applications, eviction rate, late-payment / NSF rate, and stable-employment percentage? A property-management company in the area should have these aggregated.
- How much new for-sale + rental construction is in the pipeline within 1–3 miles? Heavy new supply typically softens prices + rents 12–24 months out; constrained supply supports both.
Investment metrics
- 1% rule
- 0.79% ✗
- Cap rate
- 5.46%
- Cash-on-cash
- -2.97%
- DSCR
- 0.87
- GRM
- 10.5
CMA / ARV
- ARV (median comp)
- $318,817
- List price
- $265,000
- Delta
- -16.88%
- Verdict
- UNDERPRICED
- Comps
- 7 within 1.0 mi
Show comp detail 2 sales within ~0.75 mi
| Address | Dist | Beds/Ba | Sqft | Sold | Price | $/sf | Match |
|---|---|---|---|---|---|---|---|
| 13-3303 Moku St | 0.17mi | 3/2.0 (+1) | 1,420 (+1%) | 2mo | $450,000 | $317 | 84 |
| 13-3403 Kumakahi St | 0.64mi | 2/2.0 | 1,340 (-5%) | 10mo | $194,900 | $145 | 54 |
Match score weights: distance 35% · size 25% · config 20% · recency 20%. Top-matched comps best support the ARV.
Projected returns pro-forma
-3.0% appreciation · 3.0% rent growth · sell at horizon
- IRR
- -21.2%
- Equity multiple
- 0.26×
- Total profit
- $-54,594
- Equity at exit
- $39,512
- IRR
- -14.7%
- Equity multiple
- 0.16×
- Total profit
- $-62,439
- Equity at exit
- $22,912
Cash invested: $74,200 (down + closing). Projections, not guarantees.
Landlord ↔ Tenant lean methodology
- Overall (STATE)
- 37 Tenant-Leaning
- State Hawaii
- 37 Tenant-Leaning · D+13
- County
- — inherits STATE
- City
- — inherits STATE
ZIP-level market 96778
- Home prices YoY
- -15.3%
- Active inventory
- 388
- Price-to-rent
- 10.5×
Monthly cashflow live
- Estimated rent
- $2,098 medium interval (Pro) →
- Mortgage (P&I)
- −$1,390
- Tax est. 1.5%
- −$331 /mo · $3,975/yr
- Insurance
- −$110
- HOA
- −$10
- Vacancy / Maint / Mgmt
- −$441
- Net cashflow
- $-184
Break-even live
Sensitivity live
| Price | -10% $0 | -5% $-92 | +0% $-184 | +5% $-275 | +10% $-367 |
|---|---|---|---|---|---|
| Rent | -10% $-349 | -5% $-266 | +0% $-184 | +5% $-101 | +10% $-18 |
| Rate | -1.0pp $-50 | -0.5pp $-116 | base $-184 | +0.5pp $-252 | +1.0pp $-322 |
UW: 25.0% down · 7.5% · 30yr · 1.5% tax · 5.0% vac · 8.0% maint · 8.0% mgmt
Financing live
Cash to close
- Down payment
- $66,250
- Closing costs
- $7,950
- Reserves months
- —
- Total cash needed
- —
Loan-product check · same deal, 3 products live
Conventional
25% down · 7.5% · 30yr
- Down + closing
- —
- Monthly P&I
- —
- Monthly cashflow
- —
- DSCR
- —
- Eligible?
- —
Personal DTI + credit; lowest rate.
DSCR
20% down · 8.5% · 30yr
- Down + closing
- —
- Monthly P&I
- —
- Monthly cashflow
- —
- DSCR
- —
- Eligible?
- —
No personal income docs; deal must DSCR.
Hard money
10% down · 12.0% · 12mo
- Down + closing
- —
- Monthly P&I
- —
- Monthly cashflow
- —
- DSCR
- —
- Eligible?
- —
Short-term bridge; refi at stabilization.
HOA detail
- Monthly dues
- $10 · $120/yr
- Likely covers
- gas
Listing history 27 events
-
2026-06-21days on market $265,000 Active 58 DOM
-
2026-06-18days on market $265,000 Active 55 DOM
-
2026-06-17pricedays on market $265,000 Active 54 DOM
-
2026-06-16days on market $275,000 Active 53 DOM
-
2026-06-15days on market $275,000 Active 52 DOM
-
2026-06-13days on market $275,000 Active 50 DOM
-
2026-06-13days on market $275,000 Active 49 DOM
-
2026-06-10days on market $275,000 Active 47 DOM
-
2026-06-09days on market $275,000 Active 46 DOM
-
2026-06-08days on market $275,000 Active 45 DOM
-
2026-06-07days on market $275,000 Active 44 DOM
-
2026-06-05days on market $275,000 Active 41 DOM
-
2026-06-03days on market $275,000 Active 40 DOM
-
2026-06-02days on market $275,000 Active 39 DOM
-
2026-06-01days on market $275,000 Active 38 DOM
-
2026-05-31days on market $275,000 Active 37 DOM
-
2026-03-25$275,000 Active 514-char remark
-
2025-06-01status Active
-
2025-05-31historical
-
2025-04-13status Active
-
2025-04-13price $285,000
-
2025-04-11historical Active Under Contract
-
2024-05-19status Active
-
2024-05-19price $293,000
-
2024-03-12historical Contingent
-
2023-02-01$345,678 Active
-
2022-04-14$345,678
ⓘ Source: listings_history table (triggers on properties + properties_extension) + one-shot
backfill from property_details.listing_events for pre-trigger history.
Climate risk First Street
- Flood 1/10 Low FEMA zone X (unshaded) · 0% chance over 30 yrs
- Air quality 1/10 Low
Nearby sold comps map
Loading sold comps map…
Walkable amenities ~0.75 mi
Loading nearby amenities…
Taxation est. · year 1
- Rental income
- $25,182
- − Mortgage interest
- −$14,844
- − Property taxes
- −$3,975
- − Insurance
- −$1,325
- − Repairs & maintenance
- −$2,015
- − Management
- −$2,015
- − HOA
- −$120
- − Depreciation
- −$7,709
- Taxable loss
- −$6,820
- Est. tax savings @ 24.0%
- +$1,637
- After-tax cash flow
- $-566/yr
For passive investors: Depreciation is non-cash, so a rental often shows a tax loss while cash-flowing — sheltering income. Rental losses are passive: they offset passive income freely, and up to $25,000/yr can offset ordinary (W-2) income if you actively participate and your MAGI is under $100k (phasing out to $0 by $150k); unused losses carry forward. On sale, claimed depreciation is recaptured at up to 25%, and gains may owe capital-gains tax (a 1031 exchange can defer both). Figures are a year-1 estimate at your 24.0% rate — not tax advice; consult a CPA.
Schools (NCES district)
- District
- Hawaii Department Of Education
- NCES district ID
- 1500030
- Math proficiency
- 32% ▼ -10.00%
- Reading proficiency
- 50% ▼ -3.00%
- Median HH income
- $69,005
- Composite
- 37.07/100
- National rank
- #4504
- State rank
- #1 of 1 in HI
Livability — Leilani Estates
- Score
- 52/100
- State rank
- #144
- US rank
- #24982
Category grades
Schools grade is shown separately in the Schools card above.
Census & demographics
- Census place
- Leilani Estates, HI
- Population (ZIP)
- 14,225
Population outlook (Hawaii County) Hauer SSP2
- Today (2025)
- 220,733 people
- By 2030
- 232,156 · +5.2%
- By 2040
- 252,486 · +14.4%
- By 2050
- 272,703 · +23.5%
- By 2075
- 332,113 · +50.5%
- By 2100
- 398,342 · +80.5%
Race, ethnicity, and origin ACS 2023
- Neighborhood character
- Highly diverse neighborhood (Simpson 0.82)
- Race & ethnicity
- White 37% Two or more races 30% Hispanic / Latino 15% Pacific Islander 15% Asian 12%
- Hispanic origin (detail)
- Mexican 4% Puerto Rican 9%
- Common ancestry
- Russian 7% Italian 3% Romanian 3%
- Foreign-born
- 12% · Canada, Vietnam
- Languages at home
- 77% English-only · Other Asian/Pacific 11% Tagalog/Filipino 1% Russian/Polish/Slavic 1%
Political lean MEDSL · Hawaii
- 2024 margin
- Strong D (+28.3) · D 63.0% · R 34.7% · Other 2.3%
- 2008→2024 swing
- -25.4pp toward R · 2008: 53.7pp · 2024: 28.3pp
- All cycles
- 2024: D+28.3 2020: D+36.2 2016: D+36.6 2012: D+51.3 2008: D+53.7
Not yet ingested
- Civics
- —
Market trends
- HPI YoY
- ▼ -31.52%
- Current HPI
- 173.8168
- Rent YoY
- —
- Metro
- —
- State GDP YoY
- —
- F500 in state
- 0
Price history
-23.3% since first listed12 events — show timeline
- 2026-06-17 Price Changed $265,000 HI Information Service
- 2026-03-25 Listed $275,000 HI Information Service
- 2025-06-01 Relisted — HI Information Service
- 2025-05-31 Listing Removed — HI Information Service
- 2025-04-13 Relisted — HI Information Service
- 2025-04-13 Price Changed $285,000 HI Information Service
- 2025-04-11 Contingent — HI Information Service
- 2024-05-19 Relisted — HI Information Service
- 2024-05-19 Price Changed $293,000 HI Information Service
- 2024-03-12 Contingent — HI Information Service
- 2023-02-01 Listed $345,678 HI Information Service
- 2022-04-14 Listed $345,678 HI Information Service
Cash-flow waterfall
monthlySold comps — $/sqft
last 12 mo · ≤1 miLoading sold comps…