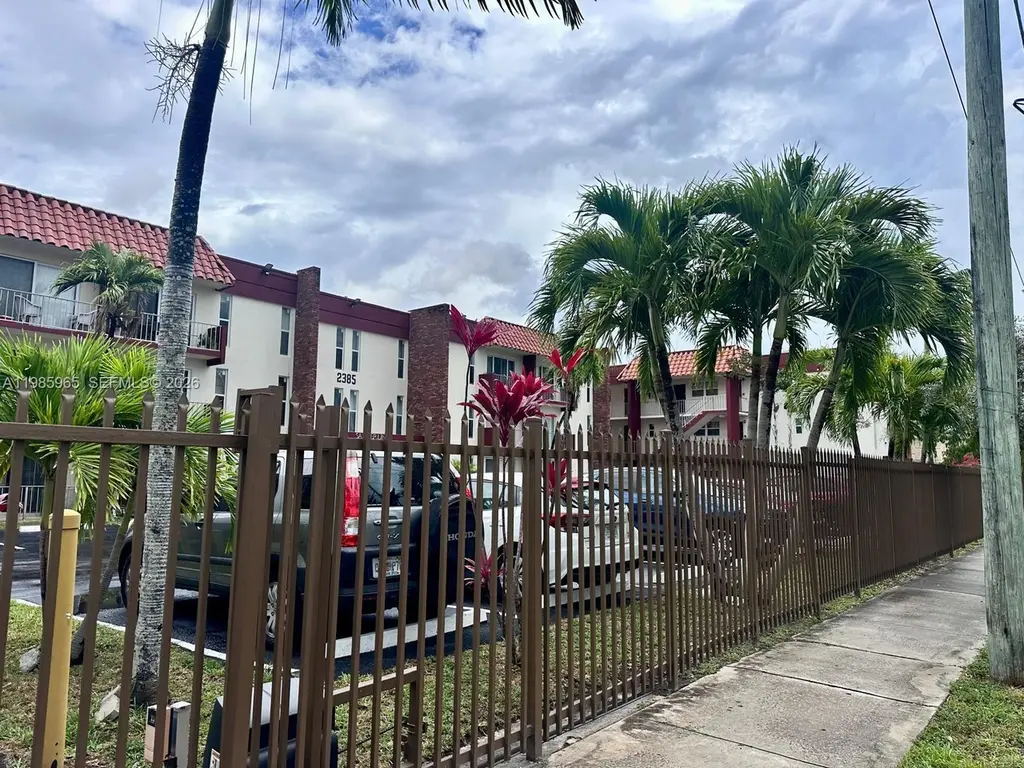
2385 NW 11th St Unit B16 · Miami, FL
Flood risk 7/10 · Major
- FEMA flood zone
- AE
- Chance of flooding over 30 yrs
- 0.59%
- Est. flood insurance / yr
- $1,737 – $8,500
Fire risk 1/10 · Minimal
- Est. fire insurance / yr
- $947 – $1,759
Heat risk 10/10 · Severe
- Hot days now (above 104°F)
- 5 days/yr
- Hot days in 30 yrs
- 20 days/yr
Wind risk 10/10 · Severe
- Chance of severe wind over 30 yrs
- 99.0%
Air-quality risk 2/10 · Minimal
- Unhealthy air days now
- 1 days/yr
- Unhealthy air days in 30 yrs
- 1 days/yr
Risk factors via First Street. Map © Google.
Why this score? — see what drove the B- grade
The composite is a weighted blend of 9 inputs, each scored 0–100. Each bar is that input's sub-score; the figure is the points it added to the 100-point composite (weight × sub-score).
- Cash flow +30.0/30.0
- 1% rule +10.0/10.0
- DSCR +10.0/10.0
- ARV discount +7.5/15.0
- Schools +4.2/10.0
- Livability +3.9/5.0
- Rent growth +2.2/5.0
- Condition / age +2.2/5.0
- Appreciation +0.0/10.0
$175,000
🖨 Deal sheet 📄 Offer letter ✓ Due diligence
Listing remarks
COMPETITIVE NEW PRICE. opportunity to own a centrally located 1-bedroom, 1-bathroom unit in the heart of Miami at an affordable price point under $200,000. Situated on the first floor of a well-maintained, gated community, this unit offers convenience and accessibility. The apartment features a private balcony overlooking the pool area and includes one assigned parking space. The location is a standout—just minutes from major expressways, close to the hospital, near LoanDepot Park (Marlins Stadium), and also within easy reach of the new Inter Miami Soccer Stadium—providing quick access to Downtown Miami, Coral Gables, and surrounding areas. Ideal for commuters or anyone seeking
Key facts
- Gated community
- Close to hospital
- Near loandepot park
Tags
Property features AI
Finance
- Financial info: Pets allowed with restrictions or possible restrictions (conditional)
- HOA & community: Monthly association fee of $423; Association covers management, amenities, common areas, insurance, laundry, structure maintenance, parking, reserve fund, sewer, trash and water; Association amenities include laundry and elevators
Exterior
- Parking: One parking space
- Security: Complex fenced; Security/high-impact doors
- Home design: Attached property; 4-story building; Entry on level 1
- Construction: Block construction; Resale property
- Exterior features: Fence; Security/high-impact doors; Exterior lighting; Complex is fenced
Interior
- Bedrooms: Bedroom located on the main level
- Flooring: Ceramic tile; Tile
- Bathrooms: 1 full bathroom
- Heating & cooling: Central heating (electric); Central air conditioning (electric)
- Interior features: Impact glass windows; Bedroom on main level; First floor entry
- Laundry & utility: Laundry in common area
Neighborhood map
What this means for you Summary
Snapshot
- This is a 1-bed/1.0-bath condo listed at $175k. Condition is rated fair.
Deal economics
- At list price, monthly cash flow is $432 ($5k/yr) — positive.
- The deal already cash-flows at list — no discount required.
- Meets the 1% rule at list price ($3k rent vs $175k).
- Recommended offer: $164k (6.0% below list) — sets the bar for market timing.
- Cap rate 12.2% vs local median 1.9% in Miami — top-decile yield for the area; either an underpriced asset or a hidden risk that comps aren't pricing in. Stress-test before assuming the spread holds.
Location & tenants
- Location reads 78/100 on livability (#177 in FL, #2,724 nationally) — a middle-class / working-renter tenant base. Strengths: amenities A+, commute A+, health & safety A+; Watch: employment C-, crime F, cost of living F.
- Miami-Dade (suburban): math 45% / reading 54% proficiency, ranked #40 of 73 in FL (top 55%) — families likely to look elsewhere, expect single-tenant / working-renter base with shorter leases; 64% free/reduced lunch — lower-income household profile, screen leases tightly.
- Market conditions: Rents soft (-1.4%/yr); 239 active listings in the ZIP; lower-income renter base — watch delinquency; 10,051 units permitted in Miami-Dade County in 2024 (7,758 in 5+ unit buildings).
- At $3,153/mo this rent would consume 84% of the median local household income ($45k/yr) (locally 5223% of renters already pay >50% of income on rent) — very limited rent-growth headroom before tenants either downsize or default.
Forward outlook
- Local home prices are declining (-3.0%/yr); year-one equity from $1k of loan paydown is wiped out by about $5k of value loss. Plan a longer hold.
- Miami-Dade County population projected at +28% by 2050 — long-run rental-demand tailwind backs the buy-and-hold thesis.
Negotiation context
- It's been on market 87 days — a 6% lower offer ($164k) is reasonable based on typical stale-listing flexibility.
Risks & watch-outs
- Watch-outs: flood insurance adds $427/mo.
- Climate carrying-cost: in FEMA flood zone AE (mandatory federal flood insurance); severe wind risk, 99% chance of damaging wind over 30y; extreme-heat days projected 5→20/yr by 2055 (HVAC capex compounding) — expect insurance premiums to compound above CPI over the hold.
Questions for the listing agent
- It's been on market 87 days. Have you received any prior offers? Is the seller open to a 6% concession, seller financing, or rate buy-down credit?
- Have any recent inspections been done? Can we get a copy of the seller's disclosures and any deferred-maintenance estimates?
- Built in 1972 — when were the roof, HVAC, electrical panel, plumbing, and water heater last replaced?
- What's the actual annual flood-insurance premium (NFIP or private), and is the property in a SFHA with mandatory coverage?
- What does the HOA fee cover, when was the last increase, and are there any pending special assessments or reserve-fund shortfalls?
- Any open or pending special assessments — roof, HVAC, plumbing, elevator, façade? What's the per-unit balance and payoff schedule, and is the seller paying it off at close or rolling it to the buyer?
- Why hasn't it sold? Are there any deal-killer items the seller is aware of (foundation, flood, title, zoning, code violations)?
- Is there a deadline driving the sale (1031 exchange, divorce, estate, relocation)? That informs how much negotiation room exists.
- Schools are B-rated — typically a magnet for longer-tenancy family renters. What's the average tenant stay here, and is there a school-zone premium baked into asking?
- Crime grade is F in this area — have there been break-ins, vandalism, or insurance claims at this property in the last 3 years? What carrier currently insures it and at what premium?
- What's the average days-on-market for RENTAL listings here right now (not sales)? A rising rental-DOM trend means longer vacancies and softer asking-rent achievability than the comps imply.
- What's the recent tenant-quality profile in this submarket — average credit score on applications, eviction rate, late-payment / NSF rate, and stable-employment percentage? A property-management company in the area should have these aggregated.
- How much new apartment / multifamily construction is in the pipeline within 1–3 miles? Heavy new supply (>2% of stock underway) typically softens rents 12–24 months out; light construction supports rent growth.
Investment metrics
- 1% rule
- 1.80% ✓
- Cap rate
- 12.18%
- Cash-on-cash
- 21.02%
- DSCR
- 1.94
- GRM
- 4.6
CMA / ARV
No comps found within radius.
Projected returns pro-forma
-3.0% appreciation · 0.0% rent growth · sell at horizon
- IRR
- -5.5%
- Equity multiple
- 0.81×
- Total profit
- $-9,530
- Equity at exit
- $26,093
- IRR
- -2.4%
- Equity multiple
- 0.87×
- Total profit
- $-6,284
- Equity at exit
- $15,131
Cash invested: $49,000 (down + closing). Projections, not guarantees.
Landlord ↔ Tenant lean methodology
- Overall (STATE)
- 87 Strongly Landlord-Friendly
- State Florida
- 87 Strongly Landlord-Friendly · R+3
- County
- — inherits STATE
- City
- — inherits STATE
ZIP-level market 33125
- Rents YoY
- -1.4%
- Active inventory
- 239
- Price-to-rent
- 4.6×
Monthly cashflow live
- Estimated rent
- $3,153 medium interval (Pro) →
- Mortgage (P&I)
- −$918
- Tax est. 1.5%
- −$219 /mo · $2,625/yr
- Insurance
- −$73
- Flood insurance flood zone
- −$427 /mo · $5,118/yr
- HOA
- −$423
- Vacancy / Maint / Mgmt
- −$662
- Net cashflow
- $432
Break-even live
UW: 25.0% down · 7.5% · 30yr · 1.5% tax · 5.0% vac · 8.0% maint · 8.0% mgmt
Financing live
Cash to close
- Down payment
- $43,750
- Closing costs
- $5,250
- Reserves months
- —
- Total cash needed
- —
Loan-product check · same deal, 3 products live
Conventional
25% down · 7.5% · 30yr
- Down + closing
- —
- Monthly P&I
- —
- Monthly cashflow
- —
- DSCR
- —
- Eligible?
- —
Personal DTI + credit; lowest rate.
DSCR
20% down · 8.5% · 30yr
- Down + closing
- —
- Monthly P&I
- —
- Monthly cashflow
- —
- DSCR
- —
- Eligible?
- —
No personal income docs; deal must DSCR.
Hard money
10% down · 12.0% · 12mo
- Down + closing
- —
- Monthly P&I
- —
- Monthly cashflow
- —
- DSCR
- —
- Eligible?
- —
Short-term bridge; refi at stabilization.
HOA detail condo
- Monthly dues
- $423 · $5,076/yr
- Likely covers
- poolsecurityparking
- Assessments
- None detected in remarks — confirm with the listing agent.
Listing history 15 events
-
2026-06-18days on market $175,000 Active 87 DOM
-
2026-06-17days on market $175,000 Active 86 DOM
-
2026-06-16days on market $175,000 Active 85 DOM
-
2026-06-15days on market $175,000 Active 84 DOM
-
2026-06-13days on market $175,000 Active 82 DOM
-
2026-06-09days on market $175,000 Active 78 DOM
-
2026-06-08days on market $175,000 Active 77 DOM
-
2026-06-07days on market $175,000 Active 76 DOM
-
2026-06-04days on market $175,000 Active 73 DOM
-
2026-06-03days on market $175,000 Active 72 DOM
-
2026-06-02days on market $175,000 Active 71 DOM
-
2026-06-01days on market $175,000 Active 70 DOM
-
2026-05-31days on market $175,000 Active 69 DOM
-
2026-05-07price $175,000
-
2026-03-23$189,000 Active
ⓘ Source: listings_history table (triggers on properties + properties_extension) + one-shot
backfill from property_details.listing_events for pre-trigger history.
Climate risk First Street
- Flood 7/10 Severe FEMA zone AE · 59% chance over 30 yrs
- Wildfire 1/10 Low
- Heat 10/10 Extreme 5 d/yr ≥104°F today · 20 d/yr by 30 yrs out
- Wind 10/10 Extreme 99% chance of damaging wind over 30 yrs
- Air quality 2/10 Low 1 unhealthy d/yr today · 1 by 30 yrs out
Nearby sold comps map
Loading sold comps map…
Walkable amenities ~0.75 mi
Loading nearby amenities…
Taxation est. · year 1
- Rental income
- $37,833
- − Mortgage interest
- −$9,803
- − Property taxes
- −$2,625
- − Insurance
- −$5,994
- − Repairs & maintenance
- −$3,027
- − Management
- −$3,027
- − HOA
- −$5,076
- − Depreciation
- −$5,091
- Taxable income
- $3,191
- Est. tax owed @ 24.0%
- −$766
- After-tax cash flow
- $4,415/yr
For passive investors: Depreciation is non-cash, so a rental often shows a tax loss while cash-flowing — sheltering income. Rental losses are passive: they offset passive income freely, and up to $25,000/yr can offset ordinary (W-2) income if you actively participate and your MAGI is under $100k (phasing out to $0 by $150k); unused losses carry forward. On sale, claimed depreciation is recaptured at up to 25%, and gains may owe capital-gains tax (a 1031 exchange can defer both). Figures are a year-1 estimate at your 24.0% rate — not tax advice; consult a CPA.
Condition & rehab AI · 14 photos
The property is in fair condition with cosmetic repairs needed in the kitchen and bathrooms. It has a good location and access to amenities, making it a good investment opportunity.
Repairs flagged
- Minor Kitchen Countertops — Visible signs of wear and minor scratches.
- Minor Bathroom Shower — Signs of wear and discoloration on the shower area.
- Minor Exterior Fencing — Visible signs of wear and discoloration.
Value-add opportunities
- Both Paint touch-ups and minor repairs to kitchen and bathroom — These updates will improve the home's appearance and functionality, making it more attractive to potential buyers and renters.
- Both Landscaping and fence maintenance — A well-maintained exterior can enhance curb appeal and property value.
Renovation cost estimate screening
| Repair item | Severity | Est. cost |
|---|---|---|
| Kitchen Countertops · Visible signs of wear and minor scratches. | Minor | $500–3,000 |
| Bathroom Shower · Signs of wear and discoloration on the shower area. | Minor | $500–3,000 |
| Exterior Fencing · Visible signs of wear and discoloration. | Minor | $500–3,000 |
| Total estimated repair cost · 3 items | $1,500–9,000 |
Value-add ROI direction
- Both Paint touch-ups and minor repairs to kitchen and bathroom — These updates will improve the home's appearance and functionality, making it more attractive to potential buyers and renters. ↑
- Both Landscaping and fence maintenance — A well-maintained exterior can enhance curb appeal and property value. ↑
ⓘ Cost ranges are severity-bucket heuristics (US national rule-of-thumb). Get contractor quotes + a written scope before underwriting a rehab budget.
Schools (NCES district)
- District
- Miami-Dade
- NCES district ID
- 1200390
- Math proficiency
- 45% ▼ -16.00%
- Reading proficiency
- 54% ▼ -5.00%
- Median HH income
- $43,928
- Composite
- 41.76/100
- National rank
- #3397
- State rank
- #40 of 73 in FL
Livability — Miami
- Score
- 78/100
- State rank
- #177
- US rank
- #2724
Category grades
Schools grade is shown separately in the Schools card above.
Census & demographics
- Census place
- Miami, FL
- County
- Miami-Dade County · 2,697,751 people
- City population
- 827,308
- Metro
- Miami-Fort Lauderdale-Pompano Beach, FL
- Population (ZIP)
- 56,897
- Household income
- $44,979
- Rent vs Own
- Severe rent burden
- 5223.0
Population outlook (Miami-Dade County) Hauer SSP2
- Today (2025)
- 3,126,439 people
- By 2030
- 3,325,765 · +6.4%
- By 2040
- 3,697,561 · +18.3%
- By 2050
- 4,012,134 · +28.3%
- By 2075
- 4,605,612 · +47.3%
- By 2100
- 4,866,598 · +55.7%
Race, ethnicity, and origin ACS 2023
- Neighborhood character
- Predominantly Hispanic (92%)
- Race & ethnicity
- Hispanic / Latino 92% Two or more races 52% White 4% Black 4%
- Hispanic origin (detail)
- Mexican 2% Puerto Rican 3% Cuban 46% Dominican 3% Salvadoran 1%
- Common ancestry
- Hispanic 1%
- Foreign-born
- 68% · Canada, Jamaica, Dominican Republic
- Languages at home
- 9% English-only · Spanish 90%
Political lean MEDSL · Miami-Dade
- 2024 margin
- R (+11.4) · D 43.9% · R 55.4%
- 2008→2024 swing
- -27.6pp toward R · 2008: 16.1pp · 2024: -11.4pp
- All cycles
- 2024: R+11.4 2020: D+7.3 2016: D+29.6 2012: D+23.7 2008: D+16.1
Not yet ingested
- Civics
- —
Market trends
- HPI YoY
- ▼ -402.98%
- Current HPI
- 476.1631
- Rent YoY
- ▼ -1.39%
- Metro
- Miami-Fort Lauderdale-Pompano Beach, FL
- State GDP YoY
- ▲ 3.28%
- F500 in state
- 36
Industry mix (Fortune 500 HQ in FL)
| Industry | F500 HQs | Revenue |
|---|---|---|
| Industrial Technology | 2 | $29B |
|
||
| Insurance | 2 | $17B |
|
||
| Retail | 1 | $60B |
|
||
| Technology Distribution | 1 | $58B |
|
||
| Homebuilding | 1 | $35B |
|
||
| Technology Manufacturing | 1 | $35B |
|
||
Price history
-7.4% since first listed2 events — show timeline
- 2026-05-07 Price Changed $175,000 MARMLS
- 2026-03-23 Listed $189,000 MARMLS
Cash-flow waterfall
monthlySold comps — $/sqft
last 12 mo · ≤1 miLoading sold comps…