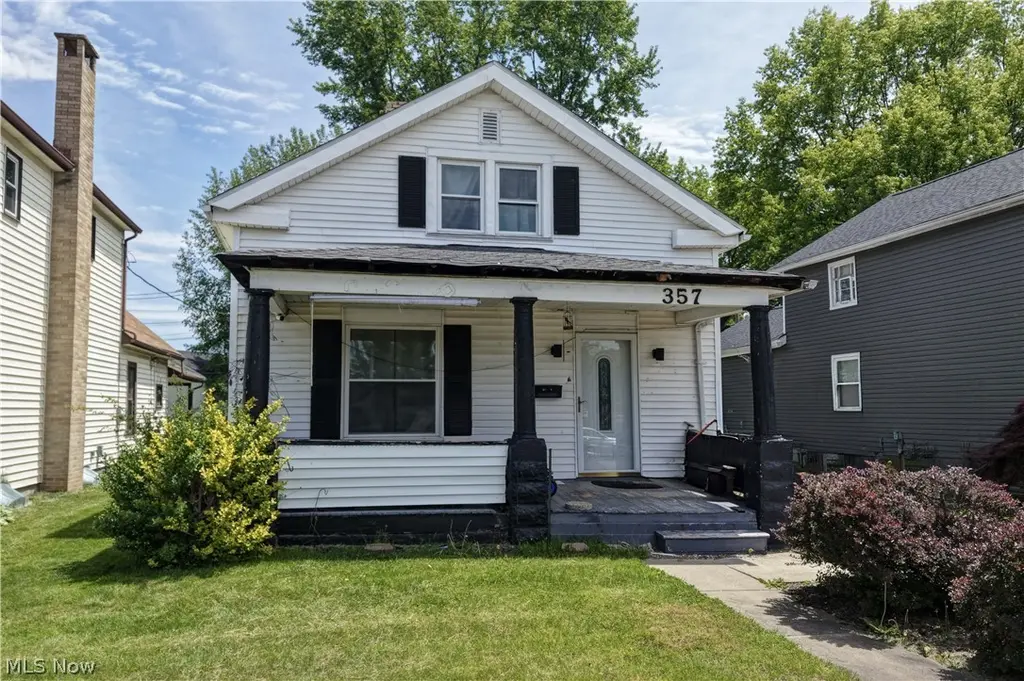
357 3rd St NW · New Philadelphia, OH
Flood risk 4/10 · Minor
- FEMA flood zone
- X (unshaded)
- Chance of flooding over 30 yrs
- 0.2%
- Est. flood insurance / yr
- $473 – $860
Fire risk 2/10 · Minimal
- Est. fire insurance / yr
- $713 – $1,323
Heat risk 4/10 · Minor
- Hot days now (above 98°F)
- 7 days/yr
- Hot days in 30 yrs
- 18 days/yr
Wind risk 1/10 · Minimal
- Chance of severe wind over 30 yrs
- —
Air-quality risk 2/10 · Minimal
- Unhealthy air days now
- 1 days/yr
- Unhealthy air days in 30 yrs
- 2 days/yr
Risk factors via First Street. Map © Google.
Why this score? — see what drove the B- grade
The composite is a weighted blend of 9 inputs, each scored 0–100. Each bar is that input's sub-score; the figure is the points it added to the 100-point composite (weight × sub-score).
- Cash flow +30.0/30.0
- DSCR +10.0/10.0
- 1% rule +8.3/10.0
- ARV discount +7.5/15.0
- Schools +5.3/10.0
- Livability +3.8/5.0
- Rent growth +2.5/5.0
- Condition / age +2.5/5.0
- Appreciation +0.0/10.0
$99,000
🖨 Deal sheet 📄 Offer letter ✓ Due diligence
Listing remarks
Great opportunity for an affordable fixer upper or rental property. Home is 2 or potentially 3 bdrms. Main level has living room, dining room, and kitchen leading out to porch and large backyard with privacy fence. 2nd level has 2 bdrms with bonus area.
Key facts
- Rental property
- Porch
- Kitchen
Tags
Property features AI
Finance
- Financial info: Annual tax amount available
Exterior
- Parking: Has carport
- Utilities: Public water; Public sewer
- Home design: 2-story house; Vinyl siding; Shingle roof
- Construction: Built (year per public records); Vinyl siding construction; Shingle roof
- Exterior features: Driveway; Lot recorded at approximately 0.1267 acres
Interior
- Bedrooms: Total of 5 rooms (includes bedrooms and other living spaces)
- Bathrooms: 1 full bathroom (main level)
- Heating & cooling: Forced air heating (gas); Central air conditioning
- Interior features: Unfinished basement
Neighborhood map
What this means for you Summary
Snapshot
- This is a 3-bed/1.0-bath single-family listed at $99k.
Deal economics
- At list price, monthly cash flow is $369 ($4k/yr) — positive.
- The deal already cash-flows at list — no discount required.
- Meets the 1% rule at list price ($1k rent vs $99k).
- Cap rate 10.8% vs local median 2.7% in New Philadelphia — top-decile yield for the area; either an underpriced asset or a hidden risk that comps aren't pricing in. Stress-test before assuming the spread holds.
Location & tenants
- Location reads 75/100 on livability (#265 in OH, #4,229 nationally) — a middle-class / working-renter tenant base. Strengths: crime A+, cost of living A+, housing A+; Watch: employment D, amenities F, commute F.
- New Philadelphia City (town): math 61% / reading 66% proficiency, ranked #248 of 656 in OH (top 38%) — acceptable for families but not a draw, mixed tenant base, ~2y average lease.
- Market conditions: 67 active listings in the ZIP; 244 units permitted in Tuscarawas County in 2024 (0 in 5+ unit buildings).
Forward outlook
- Local home prices are declining (-3.0%/yr); year-one equity from $684 of loan paydown is wiped out by about $3k of value loss. Plan a longer hold.
- Tuscarawas County population projected to shrink 10% by 2050 — rents likely to lag national; underwrite the cash flow, not the appreciation.
- At projected returns (-3.0% appreciation + 3.0% rent growth), your $28k cash investment doubles in ~8 years — after that, you're playing with house money.
Negotiation context
- Only 2 days on market — expect competitive offers; lowballing is unlikely to land.
- 4 sale attempts since 30y ago with the ask held roughly flat each time — persistent listings suggest the price (not the market) is what's stuck; bring a comps-based counter.
- Current owner paid $53k; list at $99k implies a 87% gain — meaningful room to come down on a strong offer.
Risks & watch-outs
- Watch-outs: built in 1900 — expect roof / HVAC / electrical / plumbing capex.
Questions for the listing agent
- Built in 1900 — when were the roof, HVAC, electrical panel, plumbing, and water heater last replaced?
- Is there a deadline driving the sale (1031 exchange, divorce, estate, relocation)? That informs how much negotiation room exists.
- Schools are B-rated — typically a magnet for longer-tenancy family renters. What's the average tenant stay here, and is there a school-zone premium baked into asking?
- What's the average days-on-market for RENTAL listings here right now (not sales)? A rising rental-DOM trend means longer vacancies and softer asking-rent achievability than the comps imply.
- What's the recent tenant-quality profile in this submarket — average credit score on applications, eviction rate, late-payment / NSF rate, and stable-employment percentage? A property-management company in the area should have these aggregated.
- How much new for-sale + rental construction is in the pipeline within 1–3 miles? Heavy new supply typically softens prices + rents 12–24 months out; constrained supply supports both.
Investment metrics
- 1% rule
- 1.33% ✓
- Cap rate
- 10.76%
- Cash-on-cash
- 15.96%
- DSCR
- 1.71
- GRM
- 6.3
CMA / ARV
- ARV (on-the-fly)
- $200,200
- Comps found
- 12
Show comp detail 12 sales within ~0.75 mi
| Address | Dist | Beds/Ba | Sqft | Sold | Price | $/sf | Match |
|---|---|---|---|---|---|---|---|
| 148 North Ave NW | 0.12mi | 3/1.5 | 1,403 (+0%) | 3mo | $105,000 | $75 | 90 |
| 728 Oak St NW | 0.30mi | 3/1.5 | 1,464 (+5%) | 1mo | $244,900 | $167 | 75 |
| 431 Cedar Ln NW | 0.20mi | 2/2.5 (-1) | 1,320 (-6%) | 6mo | $77,500 | $59 | 65 |
| 639 4th St NW | 0.27mi | 3/2.0 | 1,544 (+10%) | 3mo | $223,000 | $144 | 64 |
| 122 5th St SW | 0.48mi | 3/1.0 | 1,292 (-8%) | 2mo | $185,000 | $143 | 63 |
| 1203 4th St NW | 0.72mi | 3/1.5 | 1,392 (-1%) | 3mo | $192,590 | $138 | 61 |
| 341 Ray Ave NE | 0.55mi | 3/1.0 | 1,330 (-5%) | 6mo | $174,250 | $131 | 61 |
| 185 Wabash Ave NW | 0.66mi | 3/2.0 | 1,392 (-1%) | 5mo | $175,000 | $126 | 60 |
| 820 Park Ave NW | 0.59mi | 3/2.0 | 1,334 (-5%) | 5mo | $220,000 | $165 | 57 |
| 856 Baker Ave NW | 0.73mi | 3/1.5 | 1,344 (-4%) | 2mo | $229,900 | $171 | 56 |
| 237 7th St NW | 0.50mi | 3/2.0 | 1,248 (-11%) | 2mo | $184,000 | $147 | 53 |
| 944 Grant Ave NW | 0.74mi | 3/1.0 | 1,562 (+12%) | 6mo | $127,500 | $82 | 41 |
Match score weights: distance 35% · size 25% · config 20% · recency 20%. Top-matched comps best support the ARV.
Projected returns pro-forma
-3.0% appreciation · 3.0% rent growth · sell at horizon
- IRR
- 6.9%
- Equity multiple
- 1.27×
- Total profit
- $7,455
- Equity at exit
- $14,761
- IRR
- 16.2%
- Equity multiple
- 2.33×
- Total profit
- $36,784
- Equity at exit
- $8,560
Cash invested: $27,720 (down + closing). Projections, not guarantees.
Landlord ↔ Tenant lean methodology
- Overall (STATE)
- 73 Landlord-Friendly
- State Ohio
- 73 Landlord-Friendly · R+6
- County
- — inherits STATE
- City
- — inherits STATE
ZIP-level market 44663
- Active inventory
- 67
- Price-to-rent
- 6.3×
Monthly cashflow live
- Estimated rent
- $1,318 medium interval (Pro) →
- Mortgage (P&I)
- −$519
- Tax from tax record
- −$112 /mo · $1,344/yr
- Insurance
- −$41
- HOA
- −$0
- Vacancy / Maint / Mgmt
- −$277
- Net cashflow
- $369
Break-even live
UW: 25.0% down · 7.5% · 30yr · 1.5% tax · 5.0% vac · 8.0% maint · 8.0% mgmt
Financing live
Cash to close
- Down payment
- $24,750
- Closing costs
- $2,970
- Reserves months
- —
- Total cash needed
- —
Loan-product check · same deal, 3 products live
Conventional
25% down · 7.5% · 30yr
- Down + closing
- —
- Monthly P&I
- —
- Monthly cashflow
- —
- DSCR
- —
- Eligible?
- —
Personal DTI + credit; lowest rate.
DSCR
20% down · 8.5% · 30yr
- Down + closing
- —
- Monthly P&I
- —
- Monthly cashflow
- —
- DSCR
- —
- Eligible?
- —
No personal income docs; deal must DSCR.
Hard money
10% down · 12.0% · 12mo
- Down + closing
- —
- Monthly P&I
- —
- Monthly cashflow
- —
- DSCR
- —
- Eligible?
- —
Short-term bridge; refi at stabilization.
Listing history 8 events
-
2026-05-22status Pending
-
2026-05-18$99,000 Active
-
2007-07-04historical
-
2007-01-04$77,900
-
1997-02-24soldstatus $53,000
-
1997-02-15historical
-
1996-08-15$56,900
-
1996-08-15$59,900
ⓘ Source: listings_history table (triggers on properties + properties_extension) + one-shot
backfill from property_details.listing_events for pre-trigger history.
Tax reassessment forecast OH · Partial reset (capped growth)
- Current annual tax
- $1,344 · $112/mo
- Projected year-2 tax
- $1,444 · $120/mo
- Expected delta
- +$100/yr (+$8/mo · 7.5%)
ⓘ Screening estimate from a state-policy table — verify with the county assessor before closing.
Climate risk First Street
- Flood 4/10 Moderate FEMA zone X (unshaded) · 20% chance over 30 yrs
- Wildfire 2/10 Low
- Heat 4/10 Moderate 7 d/yr ≥98°F today · 18 d/yr by 30 yrs out
- Wind 1/10 Low
- Air quality 2/10 Low 1 unhealthy d/yr today · 2 by 30 yrs out
Nearby sold comps map
Loading sold comps map…
Walkable amenities ~0.75 mi
Loading nearby amenities…
Taxation est. · year 1
- Rental income
- $15,815
- − Mortgage interest
- −$5,546
- − Property taxes
- −$1,344
- − Insurance
- −$495
- − Repairs & maintenance
- −$1,265
- − Management
- −$1,265
- − Depreciation
- −$2,880
- Taxable income
- $3,020
- Est. tax owed @ 24.0%
- −$725
- After-tax cash flow
- $3,700/yr
For passive investors: Depreciation is non-cash, so a rental often shows a tax loss while cash-flowing — sheltering income. Rental losses are passive: they offset passive income freely, and up to $25,000/yr can offset ordinary (W-2) income if you actively participate and your MAGI is under $100k (phasing out to $0 by $150k); unused losses carry forward. On sale, claimed depreciation is recaptured at up to 25%, and gains may owe capital-gains tax (a 1031 exchange can defer both). Figures are a year-1 estimate at your 24.0% rate — not tax advice; consult a CPA.
Schools (NCES district)
- District
- New Philadelphia City
- NCES district ID
- 3904448
- Math proficiency
- 61% ▼ -5.00%
- Reading proficiency
- 66% ▼ -3.00%
- Median HH income
- $42,895
- Composite
- 53.28/100
- National rank
- #1490
- State rank
- #248 of 656 in OH
Livability — New Philadelphia
- Score
- 75/100
- State rank
- #265
- US rank
- #4229
Category grades
Schools grade is shown separately in the Schools card above.
Census & demographics
- Census place
- New Philadelphia, OH
- County
- Tuscarawas · 99,287 people
- City population
- 24,732
- Population (ZIP)
- 24,732
- Household income
- $62,383
- Rent vs Own
- Severe rent burden
- 20.1
Population outlook (Tuscarawas County) Hauer SSP2
- Today (2025)
- 92,253 people
- By 2030
- 91,060 · -1.3%
- By 2040
- 87,479 · -5.2%
- By 2050
- 83,174 · -9.8%
- By 2075
- 72,000 · -22.0%
- By 2100
- 58,574 · -36.5%
Race, ethnicity, and origin ACS 2023
- Neighborhood character
- Predominantly White (88%)
- Race & ethnicity
- White 88% Hispanic / Latino 8% Two or more races 3% Asian 1%
- Hispanic origin (detail)
- Puerto Rican 5%
- Common ancestry
- Slovak 3% Serbian 2% Lithuanian 2%
- Foreign-born
- 4% · Canada
- Languages at home
- 91% English-only · Spanish 6% German/W. Germanic 1% Other Indo-European 1%
Political lean MEDSL · Tuscarawas
- 2024 margin
- Solid R (+43.3) · D 28.0% · R 71.2%
- 2008→2024 swing
- -45.7pp toward R · 2008: 2.4pp · 2024: -43.3pp
- All cycles
- 2024: R+43.3 2020: R+39.9 2016: R+35.5 2012: R+9.8 2008: D+2.4
Not yet ingested
- Civics
- —
Market trends
- HPI YoY
- ▼ -201.12%
- Current HPI
- 180.4068
- Rent YoY
- —
- Metro
- —
- State GDP YoY
- ▲ 1.98%
- F500 in state
- 48
Industry mix (Fortune 500 HQ in OH)
| Industry | F500 HQs | Revenue |
|---|---|---|
| Insurance | 3 | $145B |
|
||
| Industrial Machinery | 3 | $49B |
|
||
| Financial Services | 3 | $24B |
|
||
| Consumer Goods | 2 | $93B |
|
||
| Aerospace / Defense | 2 | $47B |
|
||
| Utilities | 2 | $33B |
|
||
Price history
+74.0% since first listed8 events — show timeline
- 2026-05-22 Pending — MLSNOW
- 2026-05-18 Listed $99,000 MLSNOW
- 2007-07-04 Listing Removed — MLSNOW
- 2007-01-04 Listed $77,900 MLSNOW
- 1997-02-24 Sold (Public Records) $53,000 Public Records
- 1997-02-15 Listing Removed — MLSNOW
- 1996-08-15 Listed $59,900 MLSNOW
- 1996-08-15 Listed $56,900 MLSNOW
Property tax history
+4.5%/yrLatest (2025): $1,344 · +23.4% YoY. Source: county tax records.
Cash-flow waterfall
monthlySold comps — $/sqft
last 12 mo · ≤1 miLoading sold comps…