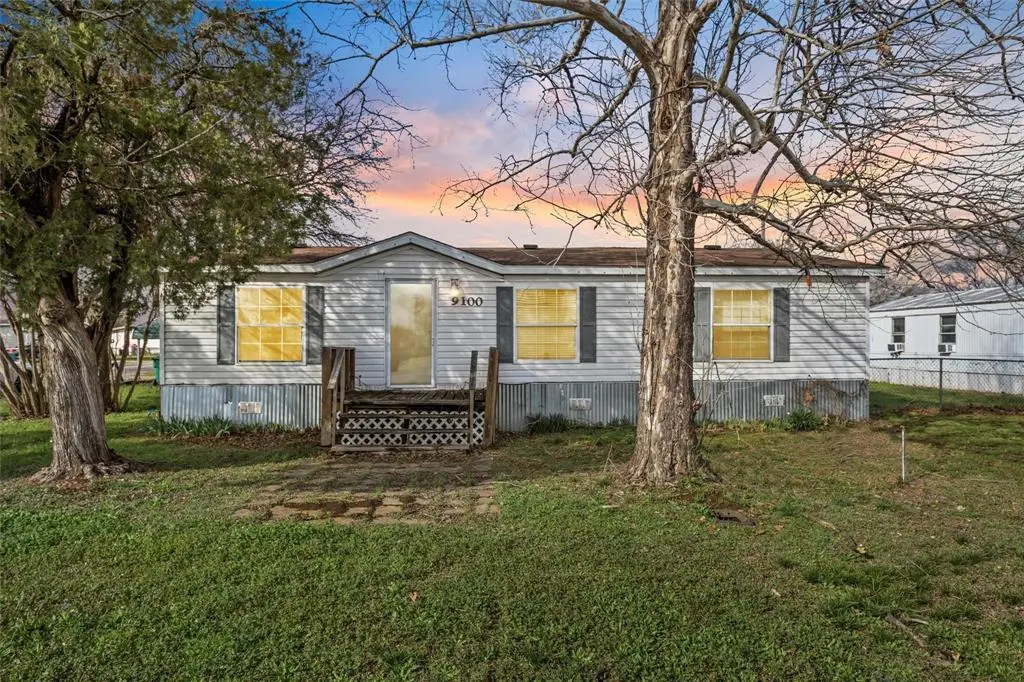
9100/9088 5th St · Crawford, TX
Flood risk 1/10 · Minimal
- FEMA flood zone
- X (unshaded)
- Chance of flooding over 30 yrs
- 0.0%
- Est. flood insurance / yr
- $507 – $1,088
Fire risk 6/10 · Moderate
- Est. fire insurance / yr
- $1,222 – $2,270
Heat risk 7/10 · Major
- Hot days now (above 108°F)
- 7 days/yr
- Hot days in 30 yrs
- 25 days/yr
Wind risk 6/10 · Moderate
- Chance of severe wind over 30 yrs
- 57.0%
Air-quality risk 2/10 · Minimal
- Unhealthy air days now
- 0 days/yr
- Unhealthy air days in 30 yrs
- 1 days/yr
Risk factors via First Street. Map © Google.
Why this score? — see what drove the C- grade
The composite is a weighted blend of 9 inputs, each scored 0–100. Each bar is that input's sub-score; the figure is the points it added to the 100-point composite (weight × sub-score).
- Cash flow +21.2/30.0
- ARV discount +7.5/15.0
- DSCR +6.8/10.0
- Schools +5.8/10.0
- 1% rule +4.5/10.0
- Livability +3.3/5.0
- Rent growth +2.5/5.0
- Condition / age +2.5/5.0
- Appreciation +0.0/10.0
$189,900
🖨 Deal sheet 📄 Offer letter ✓ Due diligence
Listing remarks MLS
2 for 1 opportunity in Crawford ISD. Located at 9088–9100 5th St in Crawford, this property features two retrofitted manufactured homes that have never been moved, each with its own water and electric meter. 9100 5th St is a 2-bedroom, 2-bath home providing 1,176 sqft and is currently leased for $1,250 on a long-term lease. 9088 5th St is also a 2-bedroom, 2-bath home with 960 sqft and is leased for $1,050 on a long-term lease. Both units are already producing income, creating immediate cash flow from day one. The separate utilities, long-term tenants, and proven rental history make this a strong investment option. For owner-occupants, this setup also provides the ability to offset a mortgage with rental income. Located in a desirable area with strong demand and access to Crawford ISD, this property provides both stability and long-term upside.
Key facts
- Multi-family living
- 0.24 acre lot
- 2 parking spots
Tags
Neighborhood map
What this means for you Summary
Snapshot
- This is a 4-bed/4.0-bath manufactured listed at $190k.
Deal economics
- At list price, monthly cash flow is $275 ($3k/yr) — positive.
- The deal already cash-flows at list — no discount required.
- To meet the 1% rule (rent ≥ 1% of price), the offer needs to be $180k (5.2% below list).
- Recommended offer: $179k (6.0% below list) — sets the bar for market timing.
Location & tenants
- Location reads 66/100 on livability (#587 in TX) — a middle-class / working-renter tenant base. Strengths: cost of living A+, housing A+, schools A-; Watch: crime D+, amenities F, commute F.
- Crawford ISD (rural): math 65% / reading 69% proficiency, ranked #23 of 826 in TX (top 3%) — acceptable for families but not a draw, mixed tenant base, ~2y average lease; only 20% free/reduced lunch — higher-income household profile.
- Market conditions: 37 active listings in the ZIP; 1,014 units permitted in McLennan County in 2024 (200 in 5+ unit buildings).
Forward outlook
- Local home prices are declining (-3.0%/yr); year-one equity from $1k of loan paydown is wiped out by about $6k of value loss. Plan a longer hold.
- McLennan County population projected at +17% by 2050 — long-run rental-demand tailwind backs the buy-and-hold thesis.
Negotiation context
- It's been on market 80 days — a 6% lower offer ($179k) is reasonable based on typical stale-listing flexibility.
- 3 sale attempts since 4y ago with the ask held roughly flat each time — persistent listings suggest the price (not the market) is what's stuck; bring a comps-based counter.
Risks & watch-outs
- Climate carrying-cost: major wind risk, 57% chance of damaging wind over 30y; major wildfire risk; extreme-heat days projected 7→25/yr by 2055 (HVAC capex compounding) — expect insurance premiums to compound above CPI over the hold.
Questions for the listing agent
- It's been on market 80 days. Have you received any prior offers? Is the seller open to a 6% concession, seller financing, or rate buy-down credit?
- Why hasn't it sold? Are there any deal-killer items the seller is aware of (foundation, flood, title, zoning, code violations)?
- Is there a deadline driving the sale (1031 exchange, divorce, estate, relocation)? That informs how much negotiation room exists.
- Schools are A-rated — typically a magnet for longer-tenancy family renters. What's the average tenant stay here, and is there a school-zone premium baked into asking?
- Crime grade is D in this area — have there been break-ins, vandalism, or insurance claims at this property in the last 3 years? What carrier currently insures it and at what premium?
- What's the average days-on-market for RENTAL listings here right now (not sales)? A rising rental-DOM trend means longer vacancies and softer asking-rent achievability than the comps imply.
- What's the recent tenant-quality profile in this submarket — average credit score on applications, eviction rate, late-payment / NSF rate, and stable-employment percentage? A property-management company in the area should have these aggregated.
- How much new for-sale + rental construction is in the pipeline within 1–3 miles? Heavy new supply typically softens prices + rents 12–24 months out; constrained supply supports both.
Investment metrics
- 1% rule
- 0.95% ✗
- Cap rate
- 8.03%
- Cash-on-cash
- 6.21%
- DSCR
- 1.28
- GRM
- 8.8
CMA / ARV
No comps found within radius.
Projected returns pro-forma
-3.0% appreciation · 3.0% rent growth · sell at horizon
- IRR
- -6.8%
- Equity multiple
- 0.75×
- Total profit
- $-13,334
- Equity at exit
- $28,315
- IRR
- 2.8%
- Equity multiple
- 1.20×
- Total profit
- $10,637
- Equity at exit
- $16,419
Cash invested: $53,172 (down + closing). Projections, not guarantees.
Landlord ↔ Tenant lean methodology
- Overall (STATE)
- 87 Strongly Landlord-Friendly
- State Texas
- 87 Strongly Landlord-Friendly · R+5
- County
- — inherits STATE
- City
- — inherits STATE
ZIP-level market 76638
- Home prices YoY
- -21.4%
- Active inventory
- 37
- Price-to-rent
- 8.8×
Monthly cashflow live
- Estimated rent
- $1,801 medium interval (Pro) →
- Mortgage (P&I)
- −$996
- Tax from tax record
- −$73 /mo · $871/yr
- Insurance
- −$79
- HOA
- −$0
- Vacancy / Maint / Mgmt
- −$378
- Net cashflow
- $275
Break-even live
UW: 25.0% down · 7.5% · 30yr · 1.5% tax · 5.0% vac · 8.0% maint · 8.0% mgmt
Financing live
Cash to close
- Down payment
- $47,475
- Closing costs
- $5,697
- Reserves months
- —
- Total cash needed
- —
Loan-product check · same deal, 3 products live
Conventional
25% down · 7.5% · 30yr
- Down + closing
- —
- Monthly P&I
- —
- Monthly cashflow
- —
- DSCR
- —
- Eligible?
- —
Personal DTI + credit; lowest rate.
DSCR
20% down · 8.5% · 30yr
- Down + closing
- —
- Monthly P&I
- —
- Monthly cashflow
- —
- DSCR
- —
- Eligible?
- —
No personal income docs; deal must DSCR.
Hard money
10% down · 12.0% · 12mo
- Down + closing
- —
- Monthly P&I
- —
- Monthly cashflow
- —
- DSCR
- —
- Eligible?
- —
Short-term bridge; refi at stabilization.
Listing history 20 events
-
2026-06-18days on market $189,900 Active 80 DOM
-
2026-06-17days on market $189,900 Active 79 DOM
-
2026-06-16days on market $189,900 Active 78 DOM
-
2026-06-15days on market $189,900 Active 77 DOM
-
2026-06-14days on market $189,900 Active 75 DOM
-
2026-06-13days on market $189,900 Active 74 DOM
-
2026-06-10days on market $189,900 Active 72 DOM
-
2026-06-09days on market $189,900 Active 71 DOM
-
2026-06-08days on market $189,900 Active 70 DOM
-
2026-06-07days on market $189,900 Active 69 DOM
-
2026-06-03days on market $189,900 Active 65 DOM
-
2026-06-02days on market $189,900 Active 64 DOM
-
2026-06-01days on market $189,900 Active 63 DOM
-
2026-05-31days on market $189,900 Active 62 DOM
-
2026-05-30days on market $189,900 Active 61 DOM
-
2026-03-30$189,900 Active 865-char remark
Show marketing remark (865 chars)
2 for 1 opportunity in Crawford ISD. Located at 9088–9100 5th St in Crawford, this property features two retrofitted manufactured homes that have never been moved, each with its own water and electric meter. 9100 5th St is a 2-bedroom, 2-bath home providing 1,176 sqft and is currently leased for $1,250 on a long-term lease. 9088 5th St is also a 2-bedroom, 2-bath home with 960 sqft and is leased for $1,050 on a long-term lease. Both units are already producing income, creating immediate cash flow from day one. The separate utilities, long-term tenants, and proven rental history make this a strong investment option. For owner-occupants, this setup also provides the ability to offset a mortgage with rental income. Located in a desirable area with strong demand and access to Crawford ISD, this property provides both stability and long-term upside.
-
2025-09-24historical
-
2025-07-11$199,900 Active
-
2023-03-19historical
-
2022-10-10$141,000
ⓘ Source: listings_history table (triggers on properties + properties_extension) + one-shot
backfill from property_details.listing_events for pre-trigger history.
Tax reassessment forecast TX · Resets to sale price
- Current annual tax
- $871 · $73/mo
- Projected year-2 tax
- $3,475 · $290/mo
- Expected delta
- +$2,604/yr (+$217/mo · 298.8%)
ⓘ Screening estimate from a state-policy table — verify with the county assessor before closing.
Climate risk First Street
- Flood 1/10 Low FEMA zone X (unshaded) · 0% chance over 30 yrs
- Wildfire 6/10 Major
- Heat 7/10 Severe 7 d/yr ≥108°F today · 25 d/yr by 30 yrs out
- Wind 6/10 Major 57% chance of damaging wind over 30 yrs
- Air quality 2/10 Low 0 unhealthy d/yr today · 1 by 30 yrs out
Nearby sold comps map
Loading sold comps map…
Walkable amenities ~0.75 mi
Loading nearby amenities…
Taxation est. · year 1
- Rental income
- $21,608
- − Mortgage interest
- −$10,637
- − Property taxes
- −$871
- − Insurance
- −$950
- − Repairs & maintenance
- −$1,729
- − Management
- −$1,729
- − Depreciation
- −$5,524
- Taxable income
- $168
- Est. tax owed @ 24.0%
- −$40
- After-tax cash flow
- $3,259/yr
For passive investors: Depreciation is non-cash, so a rental often shows a tax loss while cash-flowing — sheltering income. Rental losses are passive: they offset passive income freely, and up to $25,000/yr can offset ordinary (W-2) income if you actively participate and your MAGI is under $100k (phasing out to $0 by $150k); unused losses carry forward. On sale, claimed depreciation is recaptured at up to 25%, and gains may owe capital-gains tax (a 1031 exchange can defer both). Figures are a year-1 estimate at your 24.0% rate — not tax advice; consult a CPA.
Schools (NCES district)
- District
- Crawford ISD
- NCES district ID
- 4815600
- Math proficiency
- 65% ▼ -9.00%
- Reading proficiency
- 69% ▼ -5.00%
- Median HH income
- $65,903
- Composite
- 58.39/100
- National rank
- #1006
- State rank
- #23 of 826 in TX
Livability — Crawford
- Score
- 66/100
- State rank
- #587
- US rank
- #11221
Category grades
Schools grade is shown separately in the Schools card above.
Census & demographics
- Census place
- Crawford, TX
- Population (ZIP)
- 3,395
Population outlook (McLennan County) Hauer SSP2
- Today (2025)
- 264,191 people
- By 2030
- 273,578 · +3.6%
- By 2040
- 291,506 · +10.3%
- By 2050
- 308,044 · +16.6%
- By 2075
- 349,648 · +32.3%
- By 2100
- 364,779 · +38.1%
Race, ethnicity, and origin ACS 2023
- Neighborhood character
- Predominantly White (87%)
- Race & ethnicity
- White 87% Hispanic / Latino 9% Two or more races 3% Black 2% Asian 1%
- Hispanic origin (detail)
- Mexican 9%
- Common ancestry
- Subsaharan African 2% Italian 2% Portuguese 2%
- Foreign-born
- 5% · Canada
- Languages at home
- 92% English-only · Spanish 5% Russian/Polish/Slavic 1% Other Asian/Pacific 1%
Political lean MEDSL · McLennan
- 2024 margin
- Solid R (+30.9) · D 34.0% · R 64.9% · Other 1.0%
- 2008→2024 swing
- -7.0pp toward R · 2008: -23.9pp · 2024: -30.9pp
- All cycles
- 2024: R+30.9 2020: R+23.4 2016: R+27.1 2012: R+29.8 2008: R+23.9
Not yet ingested
- Civics
- —
Market trends
- HPI YoY
- ▼ -69.31%
- Current HPI
- 254.5235
- Rent YoY
- —
- Metro
- —
- State GDP YoY
- ▲ 3.95%
- F500 in state
- 110
Industry mix (Fortune 500 HQ in TX)
| Industry | F500 HQs | Revenue |
|---|---|---|
| Energy | 16 | $1,198B |
|
||
| Technology | 5 | $198B |
|
||
| Engineering / Construction | 4 | $72B |
|
||
| Energy Services | 3 | $60B |
|
||
| Utilities | 3 | $41B |
|
||
| Healthcare | 2 | $330B |
|
||
Price history
+34.7% since first listed5 events — show timeline
- 2026-03-30 Listed $189,900 NTREIS
- 2025-09-24 Listing Removed — NTREIS
- 2025-07-11 Listed $199,900 NTREIS
- 2023-03-19 Listing Removed — NTREIS
- 2022-10-10 Listed $141,000 NTREIS
Property tax history
+9.0%/yrLatest (2025): $871 · -3.7% YoY. Source: county tax records.
Cash-flow waterfall
monthlySold comps — $/sqft
last 12 mo · ≤1 miLoading sold comps…