 Multi-family
247 Charlie Kie Rd · Delhi, LA
Flood risk 1/10 · Minimal
- FEMA flood zone
- X
- Chance of flooding over 30 yrs
- 0.0%
- Est. flood insurance / yr
- $507 – $1,088
Fire risk 5/10 · Moderate
- Est. fire insurance / yr
- $1,269 – $2,357
Heat risk 7/10 · Major
- Hot days now (above 109°F)
- 7 days/yr
- Hot days in 30 yrs
- 20 days/yr
Wind risk 8/10 · Major
- Chance of severe wind over 30 yrs
- 80.0%
Air-quality risk 1/10 · Minimal
- Unhealthy air days now
- 0 days/yr
- Unhealthy air days in 30 yrs
- 0 days/yr
Risk factors via First Street. Map © Google.
Why this score? — see what drove the D+ grade
The composite is a weighted blend of 9 inputs, each scored 0–100. Each bar is that input's sub-score; the figure is the points it added to the 100-point composite (weight × sub-score).
- Cash flow +15.0/30.0
- ARV discount +7.5/15.0
- Appreciation +7.1/10.0
- 1% rule +5.0/10.0
- DSCR +5.0/10.0
- Livability +3.0/5.0
- Rent growth +2.5/5.0
- Condition / age +2.5/5.0
- Schools +1.4/10.0
$61,200
🖨 Deal sheet 📄 Offer letter ✓ Due diligence
Multi-family units
County records classify this as Multi-Family (5+ Unit). Listing-text estimate: 1 unit. estimate disagrees with records
5+ unit building — per-unit beds/baths from public records are typically unavailable; the breakdown below (if shown) is an estimate from the listing text.
Listing remarks MLS
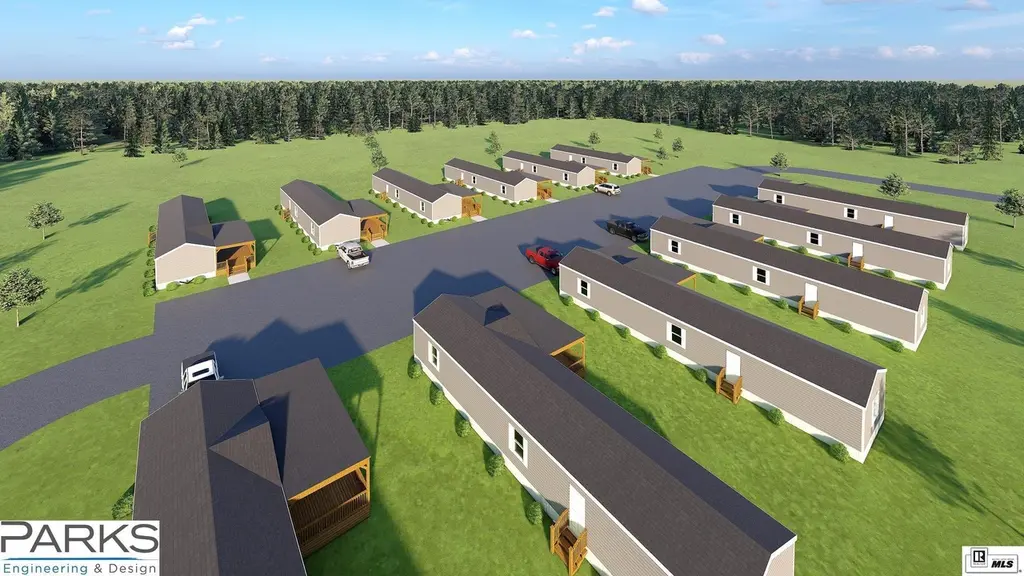
New twelve-unit housing development only six minutes from META data center. This property is being offered for lease or sale. The projected complete date is June 1st , 2026. The property will consist of twelve 3 Bed 2 bath mobile homes with full length porches situated on 4+- acres. This entire development is being offered for lease at $5,100.00 per month per unit fully furnished with Owner paying all utilities and maintenance. .
Key facts
- 4 acre lot
- 24 parking spots
- Built 2026
Neighborhood map
What this means for you Summary
Snapshot
- This is a 12-bed/?-bath multifamily listed at $61k.
Deal economics
- At list price, monthly cash flow is $7k ($89k/yr) — positive.
- The deal already cash-flows at list — no discount required.
- Meets the 1% rule at list price ($10k rent vs $61k).
- Recommended offer: $56k (9.0% below list) — sets the bar for market timing.
Location & tenants
- Location reads 60/100 on livability (#261 in LA) — a middle-class / working-renter tenant base. Strengths: cost of living A+, housing B+, crime B; Watch: schools D, health & safety D, amenities F.
- Richland Parish (rural): math 12% / reading 22% proficiency, ranked #73 of 98 in LA (top 74%) — low school quality limits family demand, transient renter base, plan for 1-2y turnover; 76% free/reduced lunch — lower-income household profile, screen leases tightly.
- Market conditions: 45 active listings in the ZIP; 27 units permitted in Richland Parish in 2024 (0 in 5+ unit buildings).
Forward outlook
- In year one you build about $3k of equity ($423 loan paydown + $3k appreciation (4.3% local appreciation)).
- Richland County population projected to shrink 9% by 2050 — rents likely to lag national; underwrite the cash flow, not the appreciation.
- At projected returns (4.3% appreciation + 3.0% rent growth), your $17k cash investment doubles in ~1 year — after that, you're playing with house money.
Negotiation context
- It's been on market 92 days — a 9% lower offer ($56k) is reasonable based on typical stale-listing flexibility.
- 2 sale attempts with the ask held roughly flat each time — persistent listings suggest the price (not the market) is what's stuck; bring a comps-based counter.
Risks & watch-outs
- Climate carrying-cost: severe wind risk, 80% chance of damaging wind over 30y; moderate wildfire risk; extreme-heat days projected 7→20/yr by 2055 (HVAC capex compounding) — expect insurance premiums to compound above CPI over the hold.
Questions for the listing agent
- It's been on market 92 days. Have you received any prior offers? Is the seller open to a 9% concession, seller financing, or rate buy-down credit?
- Why hasn't it sold? Are there any deal-killer items the seller is aware of (foundation, flood, title, zoning, code violations)?
- Is there a deadline driving the sale (1031 exchange, divorce, estate, relocation)? That informs how much negotiation room exists.
- Schools are D-rated, which usually means shorter tenancies and higher turnover. Who's the typical renter profile here, and what's been the actual vacancy rate?
- The area grade is low — what's the realistic commute time and amenity access for the typical tenant pool here? Any planned neighborhood developments (good or bad) we should know about?
- What's the average days-on-market for RENTAL listings here right now (not sales)? A rising rental-DOM trend means longer vacancies and softer asking-rent achievability than the comps imply.
- What's the recent tenant-quality profile in this submarket — average credit score on applications, eviction rate, late-payment / NSF rate, and stable-employment percentage? A property-management company in the area should have these aggregated.
- How much new apartment / multifamily construction is in the pipeline within 1–3 miles? Heavy new supply (>2% of stock underway) typically softens rents 12–24 months out; light construction supports rent growth.
Investment metrics
- 1% rule
- 16.18% ✓
- Cap rate
- 151.41%
- Cash-on-cash
- 518.29%
- DSCR
- 24.06
- GRM
- 0.5
CMA / ARV
No comps found within radius.
Projected returns pro-forma
4.27% appreciation · 3.0% rent growth · sell at horizon
- IRR
- —
- Equity multiple
- 29.19×
- Total profit
- $483,138
- Equity at exit
- $32,017
- IRR
- —
- Equity multiple
- 62.54×
- Total profit
- $1,054,570
- Equity at exit
- $53,169
Cash invested: $17,136 (down + closing). Projections, not guarantees.
Landlord ↔ Tenant lean methodology
- Overall (STATE)
- 90 Strongly Landlord-Friendly
- State Louisiana
- 90 Strongly Landlord-Friendly · R+12
- County
- — inherits STATE
- City
- — inherits STATE
ZIP-level market 71232
- Home prices YoY
- 3.4%
- Active inventory
- 45
- Price-to-rent
- 6.2×
Monthly cashflow live
- Estimated rent
- $9,904 medium interval (Pro) →
- Mortgage (P&I)
- −$321
- Tax est. 1.5%
- −$76 /mo · $918/yr
- Insurance
- −$26
- HOA
- −$0
- Vacancy / Maint / Mgmt
- −$2,080
- Net cashflow
- $7,401
Break-even live
12-unit breakdown (identical units grouped — click to expand)
| Units | Beds | Baths | Est. rent |
|---|---|---|---|
| 12× units | 3 | 2 | $9,900 |
| #1 | 3 | 2 | $825 |
| #2 | 3 | 2 | $825 |
| #3 | 3 | 2 | $825 |
| #4 | 3 | 2 | $825 |
| #5 | 3 | 2 | $825 |
| #6 | 3 | 2 | $825 |
| #7 | 3 | 2 | $825 |
| #8 | 3 | 2 | $825 |
| #9 | 3 | 2 | $825 |
| #10 | 3 | 2 | $825 |
| #11 | 3 | 2 | $825 |
| #12 | 3 | 2 | $825 |
| Total (12 units) | $9,904 | ||
UW: 25.0% down · 7.5% · 30yr · 1.5% tax · 5.0% vac · 8.0% maint · 8.0% mgmt
Financing live
Cash to close
- Down payment
- $15,300
- Closing costs
- $1,836
- Reserves months
- —
- Total cash needed
- —
Loan-product check · same deal, 3 products live
Conventional
25% down · 7.5% · 30yr
- Down + closing
- —
- Monthly P&I
- —
- Monthly cashflow
- —
- DSCR
- —
- Eligible?
- —
Personal DTI + credit; lowest rate.
DSCR
20% down · 8.5% · 30yr
- Down + closing
- —
- Monthly P&I
- —
- Monthly cashflow
- —
- DSCR
- —
- Eligible?
- —
No personal income docs; deal must DSCR.
Hard money
10% down · 12.0% · 12mo
- Down + closing
- —
- Monthly P&I
- —
- Monthly cashflow
- —
- DSCR
- —
- Eligible?
- —
Short-term bridge; refi at stabilization.
Listing history 17 events
-
2026-06-19days on market $61,200 Active 92 DOM
-
2026-06-18days on market $61,200 Active 91 DOM
-
2026-06-17days on market $61,200 Active 90 DOM
-
2026-06-16days on market $61,200 Active 89 DOM
-
2026-06-15days on market $61,200 Active 88 DOM
-
2026-06-14days on market $61,200 Active 86 DOM
-
2026-06-13days on market $61,200 Active 85 DOM
-
2026-06-10days on market $61,200 Active 83 DOM
-
2026-06-09days on market $61,200 Active 82 DOM
-
2026-06-08days on market $61,200 Active 81 DOM
-
2026-06-07days on market $61,200 Active 80 DOM
-
2026-06-02days on market $61,200 Active 75 DOM
-
2026-06-01days on market $61,200 Active 74 DOM
-
2026-05-31days on market $61,200 Active 73 DOM
-
2026-05-30days on market $61,200 Active 72 DOM
-
2026-03-19$3,200,000 Active 433-char remark
Show marketing remark (567 chars)
New twelve-unit housing development only six minutes from META data center. This property is being offered for lease or sale. The projected complete date is June 1st, 2026. The property will consist of twelve 3 Bed 2 Bath mobile homes with full length porches situated on 4+- acres. This is an all-inclusive lease opportunity with every unit being fully furnished and Landlord paying all utilities and maintenance. If your looking for a turnkey housing opportunity this is Your chance. Owner will consider selling this property, and the asking price is $3,200,000.00.
-
2026-03-19$61,200 Active 567-char remark
Show marketing remark (567 chars)
New twelve-unit housing development only six minutes from META data center. This property is being offered for lease or sale. The projected complete date is June 1st, 2026. The property will consist of twelve 3 Bed 2 Bath mobile homes with full length porches situated on 4+- acres. This is an all-inclusive lease opportunity with every unit being fully furnished and Landlord paying all utilities and maintenance. If your looking for a turnkey housing opportunity this is Your chance. Owner will consider selling this property, and the asking price is $3,200,000.00.
ⓘ Source: listings_history table (triggers on properties + properties_extension) + one-shot
backfill from property_details.listing_events for pre-trigger history.
Climate risk First Street
- Flood 1/10 Low FEMA zone X · 0% chance over 30 yrs
- Wildfire 5/10 Major
- Heat 7/10 Severe 7 d/yr ≥109°F today · 20 d/yr by 30 yrs out
- Wind 8/10 Severe 80% chance of damaging wind over 30 yrs
- Air quality 1/10 Low 0 unhealthy d/yr today · 0 by 30 yrs out
Nearby sold comps map
Loading sold comps map…
Walkable amenities ~0.75 mi
Loading nearby amenities…
Taxation est. · year 1
- Rental income
- $118,848
- − Mortgage interest
- −$3,428
- − Property taxes
- −$918
- − Insurance
- −$306
- − Repairs & maintenance
- −$9,508
- − Management
- −$9,508
- − Depreciation
- −$1,780
- Taxable income
- $93,400
- Est. tax owed @ 24.0%
- −$22,416
- After-tax cash flow
- $66,399/yr
For passive investors: Depreciation is non-cash, so a rental often shows a tax loss while cash-flowing — sheltering income. Rental losses are passive: they offset passive income freely, and up to $25,000/yr can offset ordinary (W-2) income if you actively participate and your MAGI is under $100k (phasing out to $0 by $150k); unused losses carry forward. On sale, claimed depreciation is recaptured at up to 25%, and gains may owe capital-gains tax (a 1031 exchange can defer both). Figures are a year-1 estimate at your 24.0% rate — not tax advice; consult a CPA.
Schools (NCES district)
- District
- Richland Parish
- NCES district ID
- 2201350
- Math proficiency
- 12% ▼ -36.00%
- Reading proficiency
- 22% ▼ -31.00%
- Median HH income
- $36,097
- Composite
- 14.06/100
- National rank
- #9464
- State rank
- #73 of 98 in LA
Livability — Delhi
- Score
- 60/100
- State rank
- #261
- US rank
- #19213
Category grades
Schools grade is shown separately in the Schools card above.
Census & demographics
- Population (ZIP)
- 6,003
Population outlook (Richland County) Hauer SSP2
- Today (2025)
- 20,283 people
- By 2030
- 19,990 · -1.4%
- By 2040
- 19,240 · -5.1%
- By 2050
- 18,497 · -8.8%
- By 2075
- 16,626 · -18.0%
- By 2100
- 14,204 · -30.0%
Race, ethnicity, and origin ACS 2023
- Neighborhood character
- Majority White (55%)
- Race & ethnicity
- White 55% Black 39% Two or more races 3% Hispanic / Latino 2%
- Common ancestry
- Lithuanian 2% Slovak 1% Italian 1%
- Foreign-born
- 2% · Canada
- Languages at home
- 97% English-only · Arabic 1% Spanish 1%
Political lean MEDSL · Richland
- 2024 margin
- Solid R (+39.4) · D 29.7% · R 69.1% · Other 1.2%
- 2008→2024 swing
- -12.8pp toward R · 2008: -26.6pp · 2024: -39.4pp
- All cycles
- 2024: R+39.4 2020: R+34.0 2016: R+32.6 2012: R+28.2 2008: R+26.6
Not yet ingested
- Civics
- —
Market trends
- HPI YoY
- ▲ 4.27%
- Current HPI
- 129.3086
- Rent YoY
- —
- Metro
- —
- State GDP YoY
- ▲ 3.29%
- F500 in state
- 10
Industry mix (Fortune 500 HQ in LA)
| Industry | F500 HQs | Revenue |
|---|---|---|
| Telecommunications | 2 | $23B |
|
||
| Utilities | 1 | $12B |
|
||
| Wholesale / Distribution | 1 | $5B |
|
||
| Advertising | 1 | $2B |
|
||
Price history
-98.1% since first listed2 events — show timeline
- 2026-03-19 Listed $61,200 NELABOR
- 2026-03-19 Listed $3,200,000 NELABOR
Cash-flow waterfall
monthlySold comps — $/sqft
last 12 mo · ≤1 miLoading sold comps…