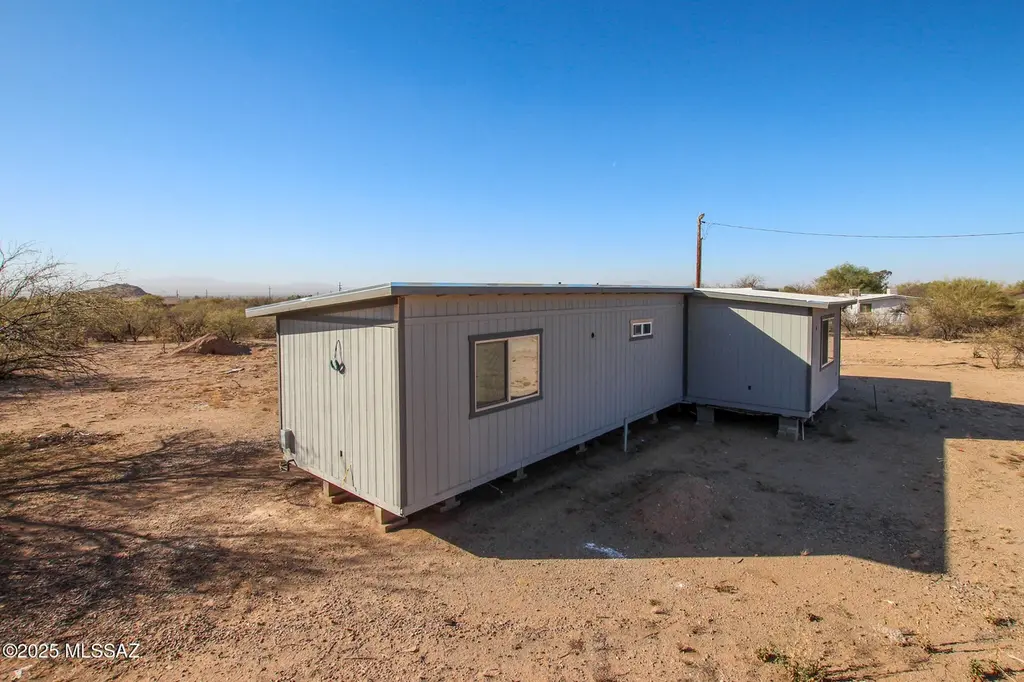
6855 W Kay Lynn Dr · Tucson Estates, AZ
Flood risk 1/10 · Minimal
- FEMA flood zone
- X (unshaded)
- Chance of flooding over 30 yrs
- 0.0%
- Est. flood insurance / yr
- $507 – $1,088
Fire risk 6/10 · Moderate
- Est. fire insurance / yr
- $610 – $1,132
Heat risk 8/10 · Major
- Hot days now (above 107°F)
- 7 days/yr
- Hot days in 30 yrs
- 20 days/yr
Wind risk 1/10 · Minimal
- Chance of severe wind over 30 yrs
- —
Air-quality risk 1/10 · Minimal
- Unhealthy air days now
- 0 days/yr
- Unhealthy air days in 30 yrs
- 0 days/yr
Risk factors via First Street. Map © Google.
Why this score? — see what drove the D grade
The composite is a weighted blend of 9 inputs, each scored 0–100. Each bar is that input's sub-score; the figure is the points it added to the 100-point composite (weight × sub-score).
- Cash flow +14.9/30.0
- ARV discount +9.1/15.0
- DSCR +4.6/10.0
- Livability +3.1/5.0
- 1% rule +2.8/10.0
- Rent growth +2.5/5.0
- Condition / age +2.5/5.0
- Schools +1.6/10.0
- Appreciation +0.0/10.0
$158,000
🖨 Deal sheet 📄 Offer letter ✓ Due diligence
Listing remarks MLS
**''Opportunity is knocking in Tucson's desirable Southwest area!** This affixed mobile home sits on an expansive 1.24-acre lot with the potential to accommodate a second home--perfect for multi-generational living, rental income, or future development. Major upgrades have already been completed, including new framework, sheetrock, electrical, and plumbing, along with a newer roof, new doors, and fresh interior and exterior paint. The heavy lifting is done now it's your chance to bring the vision to life. Whether you're an investor looking for your next project or a homeowner ready to customize your dream space, this property offers incredible upside, flexibility, and value. Don't miss the chance to turn this promising property into something truly special!
Key facts
- New plumbing
- New framework
- 1.24-acre lot
Tags
Neighborhood map
What this means for you Summary
Snapshot
- This is a 1-bed/1.0-bath manufactured listed at $158k.
Deal economics
- At list price, monthly cash flow is $46 ($550/yr) — positive.
- The deal already cash-flows at list — no discount required.
- To meet the 1% rule (rent ≥ 1% of price), the offer needs to be $123k (22.2% below list).
- Recommended offer: $123k (22.2% below list) — sets the bar for 1% rule.
- Cap rate 6.6% vs local median 4.4% in Tucson Estates — top-decile yield for the area; either an underpriced asset or a hidden risk that comps aren't pricing in. Stress-test before assuming the spread holds.
Location & tenants
- Location reads 62/100 on livability (#137 in AZ) — a middle-class / working-renter tenant base. Strengths: cost of living A+, housing A+; Watch: crime D, schools F, amenities F.
- Tucson Unified District (4403) (urban): math 14% / reading 23% proficiency, ranked #190 of 249 in AZ (top 76%) — low school quality limits family demand, transient renter base, plan for 1-2y turnover.
- Market conditions: 83 active listings in the ZIP; 5,268 units permitted in Pima County in 2024 (996 in 5+ unit buildings).
Forward outlook
- Local home prices are declining (-3.0%/yr); year-one equity from $1k of loan paydown is wiped out by about $5k of value loss. Plan a longer hold.
- Pima County population projected at +8% by 2050 — modest demand growth; plan on rents tracking national, not racing it.
Negotiation context
- It's been on market 57 days — a 3% lower offer ($153k) is reasonable based on typical stale-listing flexibility.
- 4 sale attempts since 4y ago with the ask held roughly flat each time — persistent listings suggest the price (not the market) is what's stuck; bring a comps-based counter.
- Current owner paid $105k; list at $158k implies a 50% gain — meaningful room to come down on a strong offer.
Risks & watch-outs
- Climate carrying-cost: major wildfire risk; extreme-heat days projected 7→20/yr by 2055 (HVAC capex compounding) — expect insurance premiums to compound above CPI over the hold.
Questions for the listing agent
- It's been on market 57 days. Have you received any prior offers? Is the seller open to a 22% concession, seller financing, or rate buy-down credit?
- Built in 1968 — when were the roof, HVAC, electrical panel, plumbing, and water heater last replaced?
- Is there a deadline driving the sale (1031 exchange, divorce, estate, relocation)? That informs how much negotiation room exists.
- Schools are F-rated, which usually means shorter tenancies and higher turnover. Who's the typical renter profile here, and what's been the actual vacancy rate?
- Crime grade is D in this area — have there been break-ins, vandalism, or insurance claims at this property in the last 3 years? What carrier currently insures it and at what premium?
- The area grade is low — what's the realistic commute time and amenity access for the typical tenant pool here? Any planned neighborhood developments (good or bad) we should know about?
- What's the average days-on-market for RENTAL listings here right now (not sales)? A rising rental-DOM trend means longer vacancies and softer asking-rent achievability than the comps imply.
- What's the recent tenant-quality profile in this submarket — average credit score on applications, eviction rate, late-payment / NSF rate, and stable-employment percentage? A property-management company in the area should have these aggregated.
- How much new for-sale + rental construction is in the pipeline within 1–3 miles? Heavy new supply typically softens prices + rents 12–24 months out; constrained supply supports both.
Investment metrics
- 1% rule
- 0.78% ✗
- Cap rate
- 6.64%
- Cash-on-cash
- 1.24%
- DSCR
- 1.06
- GRM
- 10.7
CMA / ARV
- ARV (median comp)
- $164,000
- List price
- $158,000
- Delta
- -3.66%
- Verdict
- FAIR
- Comps
- 3 within 1.0 mi
Projected returns pro-forma
-3.0% appreciation · 3.0% rent growth · sell at horizon
- IRR
- -14.4%
- Equity multiple
- 0.49×
- Total profit
- $-22,765
- Equity at exit
- $23,558
- IRR
- -5.7%
- Equity multiple
- 0.63×
- Total profit
- $-16,401
- Equity at exit
- $13,661
Cash invested: $44,240 (down + closing). Projections, not guarantees.
Landlord ↔ Tenant lean methodology
- Overall (STATE)
- 87 Strongly Landlord-Friendly
- State Arizona
- 87 Strongly Landlord-Friendly · R+3
- County
- — inherits STATE
- City
- — inherits STATE
ZIP-level market 85735
- Home prices YoY
- -16.4%
- Active inventory
- 83
- Price-to-rent
- 10.7×
Monthly cashflow live
- Estimated rent
- $1,230 medium interval (Pro) →
- Mortgage (P&I)
- −$829
- Tax from tax record
- −$31 /mo · $375/yr
- Insurance
- −$66
- HOA
- −$0
- Vacancy / Maint / Mgmt
- −$258
- Net cashflow
- $46
Break-even live
UW: 25.0% down · 7.5% · 30yr · 1.5% tax · 5.0% vac · 8.0% maint · 8.0% mgmt
Financing live
Cash to close
- Down payment
- $39,500
- Closing costs
- $4,740
- Reserves months
- —
- Total cash needed
- —
Loan-product check · same deal, 3 products live
Conventional
25% down · 7.5% · 30yr
- Down + closing
- —
- Monthly P&I
- —
- Monthly cashflow
- —
- DSCR
- —
- Eligible?
- —
Personal DTI + credit; lowest rate.
DSCR
20% down · 8.5% · 30yr
- Down + closing
- —
- Monthly P&I
- —
- Monthly cashflow
- —
- DSCR
- —
- Eligible?
- —
No personal income docs; deal must DSCR.
Hard money
10% down · 12.0% · 12mo
- Down + closing
- —
- Monthly P&I
- —
- Monthly cashflow
- —
- DSCR
- —
- Eligible?
- —
Short-term bridge; refi at stabilization.
Listing history 31 events
-
2026-06-18days on market $158,000 Active 57 DOM
-
2026-06-17days on market $158,000 Active 56 DOM
-
2026-06-16days on market $158,000 Active 55 DOM
-
2026-06-15days on market $158,000 Active 54 DOM
-
2026-06-13days on market $158,000 Active 52 DOM
-
2026-06-10days on market $158,000 Active 49 DOM
-
2026-06-09days on market $158,000 Active 48 DOM
-
2026-06-08days on market $158,000 Active 47 DOM
-
2026-06-07days on market $158,000 Active 46 DOM
-
2026-06-05days on market $158,000 Active 43 DOM
-
2026-06-03days on market $158,000 Active 42 DOM
-
2026-06-02days on market $158,000 Active 41 DOM
-
2026-06-01days on market $158,000 Active 40 DOM
-
2026-05-31days on market $158,000 Active 39 DOM
-
2026-04-22$160,000 Active 768-char remark
Show marketing remark (768 chars)
**''Opportunity is knocking in Tucson's desirable Southwest area!** This affixed mobile home sits on an expansive 1.24-acre lot with the potential to accommodate a second home--perfect for multi-generational living, rental income, or future development. Major upgrades have already been completed, including new framework, sheetrock, electrical, and plumbing, along with a newer roof, new doors, and fresh interior and exterior paint. The heavy lifting is done now it's your chance to bring the vision to life. Whether you're an investor looking for your next project or a homeowner ready to customize your dream space, this property offers incredible upside, flexibility, and value. Don't miss the chance to turn this promising property into something truly special!
-
2026-01-15historical
-
2025-09-04price $166,000
-
2025-06-21price $175,000
-
2025-04-19price $184,000
-
2025-01-22$195,000 Active
-
2023-02-10soldstatus $105,000 Closed
-
2023-02-10soldstatus $105,000
-
2023-02-06status Pending
-
2023-01-31historical Active Contingent
-
2023-01-18price $109,000
-
2023-01-04$119,000 Active
-
2022-12-07historical
-
2022-11-09price $129,000
-
2022-09-27price $145,000
-
2022-09-19price $154,000
-
2022-09-08$169,900 Active
ⓘ Source: listings_history table (triggers on properties + properties_extension) + one-shot
backfill from property_details.listing_events for pre-trigger history.
Tax reassessment forecast AZ · Resets to sale price
- Current annual tax
- $375 · $31/mo
- Projected year-2 tax
- $1,043 · $87/mo
- Expected delta
- +$668/yr (+$56/mo · 178.0%)
ⓘ Screening estimate from a state-policy table — verify with the county assessor before closing.
Climate risk First Street
- Flood 1/10 Low FEMA zone X (unshaded) · 0% chance over 30 yrs
- Wildfire 6/10 Major
- Heat 8/10 Severe 7 d/yr ≥107°F today · 20 d/yr by 30 yrs out
- Wind 1/10 Low
- Air quality 1/10 Low 0 unhealthy d/yr today · 0 by 30 yrs out
Nearby sold comps map
Loading sold comps map…
Walkable amenities ~0.75 mi
Loading nearby amenities…
Taxation est. · year 1
- Rental income
- $14,757
- − Mortgage interest
- −$8,850
- − Property taxes
- −$375
- − Insurance
- −$790
- − Repairs & maintenance
- −$1,181
- − Management
- −$1,181
- − Depreciation
- −$4,596
- Taxable loss
- −$2,216
- Est. tax savings @ 24.0%
- +$532
- After-tax cash flow
- $1,082/yr
For passive investors: Depreciation is non-cash, so a rental often shows a tax loss while cash-flowing — sheltering income. Rental losses are passive: they offset passive income freely, and up to $25,000/yr can offset ordinary (W-2) income if you actively participate and your MAGI is under $100k (phasing out to $0 by $150k); unused losses carry forward. On sale, claimed depreciation is recaptured at up to 25%, and gains may owe capital-gains tax (a 1031 exchange can defer both). Figures are a year-1 estimate at your 24.0% rate — not tax advice; consult a CPA.
Schools (NCES district)
- District
- Tucson Unified District (4403)
- NCES district ID
- 0408800
- Math proficiency
- 14% ▼ -17.00%
- Reading proficiency
- 23% ▼ -11.00%
- Median HH income
- $40,962
- Composite
- 15.78/100
- National rank
- #9270
- State rank
- #190 of 249 in AZ
Livability — Tucson Estates
- Score
- 62/100
- State rank
- #137
- US rank
- #16650
Category grades
Schools grade is shown separately in the Schools card above.
Census & demographics
- Census place
- Tucson Estates, AZ
- Population (ZIP)
- 10,893
Population outlook (Pima County) Hauer SSP2
- Today (2025)
- 1,066,056 people
- By 2030
- 1,086,684 · +1.9%
- By 2040
- 1,117,160 · +4.8%
- By 2050
- 1,149,778 · +7.9%
- By 2075
- 1,271,480 · +19.3%
- By 2100
- 1,321,160 · +23.9%
Race, ethnicity, and origin ACS 2023
- Neighborhood character
- Diverse neighborhood (Simpson 0.59)
- Race & ethnicity
- Hispanic / Latino 50% White 41% Two or more races 19% Native American 6%
- Hispanic origin (detail)
- Mexican 47%
- Common ancestry
- Lithuanian 2% Slovak 1% Romanian 1%
- Foreign-born
- 9% · Canada
- Languages at home
- 74% English-only · Spanish 25%
Political lean MEDSL · Pima
- 2024 margin
- D (+15.2) · D 57.0% · R 41.8% · Other 1.2%
- 2008→2024 swing
- +9.1pp toward D · 2008: 6.1pp · 2024: 15.2pp
- All cycles
- 2024: D+15.2 2020: D+18.7 2016: D+13.5 2012: D+5.8 2008: D+6.1
Not yet ingested
- Civics
- —
Market trends
- HPI YoY
- ▼ -59.03%
- Current HPI
- 301.1413
- Rent YoY
- —
- Metro
- —
- State GDP YoY
- ▲ 4.54%
- F500 in state
- 20
Industry mix (Fortune 500 HQ in AZ)
| Industry | F500 HQs | Revenue |
|---|---|---|
| Technology | 2 | $13B |
|
||
| Mining / Metals | 1 | $23B |
|
||
| Environmental Services | 1 | $16B |
|
||
| Metals / Steel | 1 | $14B |
|
||
| Technology Distribution | 1 | $9B |
|
||
| Homebuilding | 1 | $8B |
|
||
Price history
-5.8% since first listed17 events — show timeline
- 2026-04-22 Listed $160,000 MLSSAZ
- 2026-01-15 Listing Removed — MLSSAZ
- 2025-09-04 Price Changed $166,000 MLSSAZ
- 2025-06-21 Price Changed $175,000 MLSSAZ
- 2025-04-19 Price Changed $184,000 MLSSAZ
- 2025-01-22 Listed $195,000 MLSSAZ
- 2023-02-10 Sold (Public Records) $105,000 Public Records
- 2023-02-10 Sold (MLS) $105,000 MLSSAZ
- 2023-02-06 Pending — MLSSAZ
- 2023-01-31 Contingent — MLSSAZ
- 2023-01-18 Price Changed $109,000 MLSSAZ
- 2023-01-04 Listed $119,000 MLSSAZ
- 2022-12-07 Listing Removed — MLSSAZ
- 2022-11-09 Price Changed $129,000 MLSSAZ
- 2022-09-27 Price Changed $145,000 MLSSAZ
- 2022-09-19 Price Changed $154,000 MLSSAZ
- 2022-09-08 Listed $169,900 MLSSAZ
Property tax history
-5.6%/yrLatest (2025): $375 · +5.0% YoY. Source: county tax records.
Cash-flow waterfall
monthlySold comps — $/sqft
last 12 mo · ≤1 miLoading sold comps…