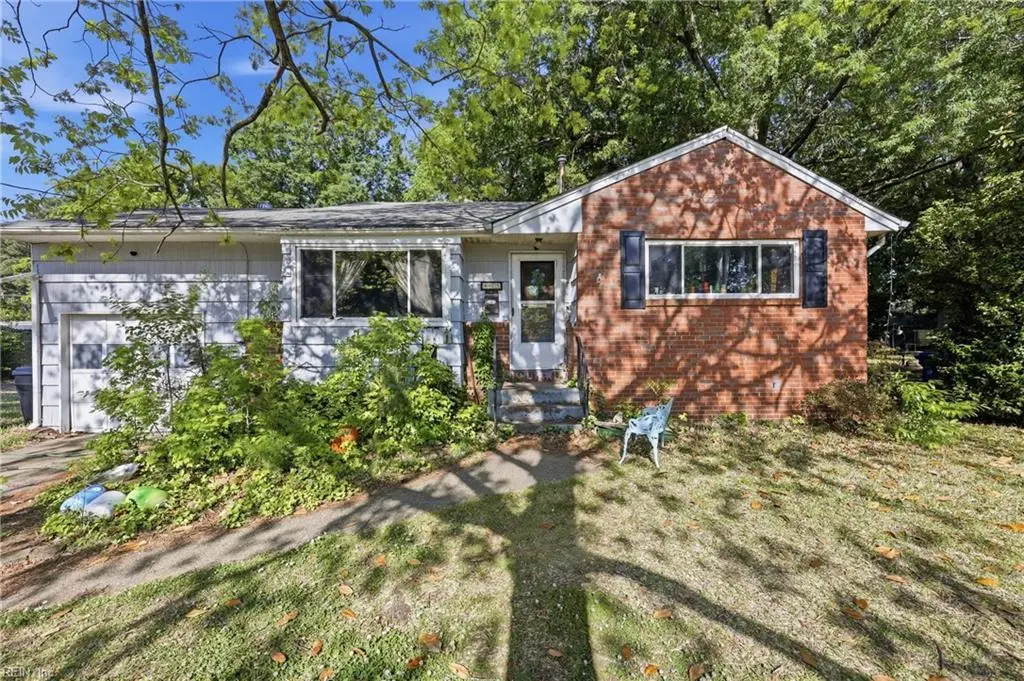
405 Taldan Ave · Virginia Beach, VA
Flood risk 1/10 · Minimal
- FEMA flood zone
- X (unshaded)
- Chance of flooding over 30 yrs
- 0.0%
- Est. flood insurance / yr
- $507 – $1,088
Fire risk 1/10 · Minimal
- Est. fire insurance / yr
- $666 – $1,236
Heat risk 9/10 · Severe
- Hot days now (above 105°F)
- 7 days/yr
- Hot days in 30 yrs
- 16 days/yr
Wind risk 8/10 · Major
- Chance of severe wind over 30 yrs
- 94.0%
Air-quality risk 3/10 · Minor
- Unhealthy air days now
- 2 days/yr
- Unhealthy air days in 30 yrs
- 4 days/yr
Risk factors via First Street. Map © Google.
Why this score? — see what drove the D+ grade
The composite is a weighted blend of 9 inputs, each scored 0–100. Each bar is that input's sub-score; the figure is the points it added to the 100-point composite (weight × sub-score).
- ARV discount +15.0/15.0
- Cash flow +11.3/30.0
- Schools +6.4/10.0
- Livability +4.2/5.0
- Rent growth +3.9/5.0
- DSCR +3.3/10.0
- 1% rule +2.6/10.0
- Condition / age +2.5/5.0
- Appreciation +0.0/10.0
$305,178
🖨 Deal sheet 📄 Offer letter ✓ Due diligence
Listing remarks
Sweat equity opportunity in highly sought-after Aragona! Priced well under market, this 4-bedroom, 2-bath tri-level sits on an oversized double lot (0.27 acres) in one of Virginia Beach's most established and desirable neighborhoods. At 1,403 sqft with a 1st-floor primary suite, cathedral ceilings, attached garage, and a storage shed, the bones are solid - bring your vision and build real equity from day one. Generous backyard, breakfast area, and a flexible tri-level layout offer room to grow. Sold AS-IS. Ideal for buyers willing to put in a little work, investors, or anyone using a renovation loan. Minutes to Pembroke, Town Center, I-264, and zoned for Bayside schools. Homes in Aragona do
Key facts
- Oversized double lot
- Generous backyard
- Garage
Tags
Property features AI
Finance
- HOA & community: No HOA fees reported
Exterior
- Parking: Attached 1-car garage (264 sq ft) with 1 parking space
- Utilities: City/County water; City/County sewer; Gas water heater; Electric service (standard)
- Home design: Detached property; Tri-level style; 3 stories / 3 living levels; Crawl foundation
- Construction: Asphalt shingle roof
- Exterior features: Shingle siding; Decorative fenced yard; Storage shed
Interior
- Kitchen: Dishwasher; Disposal; Microwave; Electric range
- Bedrooms: First-floor master bedroom; Master bedroom with bath
- Flooring: Carpet; Ceramic; Vinyl
- Bathrooms: 2 full bathrooms
- Heating & cooling: Forced hot air heating; Central air conditioning
- Interior features: Cathedral ceiling; Pull-down attic stairs; Cable hookup; Ceiling fan
- Laundry & utility: Utility room
Neighborhood map
What this means for you Summary
Snapshot
- This is a 4-bed/1.5-bath single-family listed at $305k.
Deal economics
- At list price, monthly cash flow is $-110 ($-1k/yr) — negative.
- To cash-flow at today's rent, offer at most $286k (6.4% below list).
- To meet the 1% rule (rent ≥ 1% of price), the offer needs to be $232k (24.0% below list).
- Recommended offer: $232k (24.0% below list) — sets the bar for 1% rule.
- Cap rate 5.9% vs local median 3.5% in Virginia Beach — top-decile yield for the area; either an underpriced asset or a hidden risk that comps aren't pricing in. Stress-test before assuming the spread holds.
Location & tenants
- Location reads 83/100 on livability (#38 in VA, #880 nationally) — a professional / high-income tenant draw. Strengths: amenities A+, employment A+, housing A+; Watch: cost of living C-, commute F.
- Va Beach City Public School District (urban): math 69% / reading 78% proficiency, ranked #10 of 131 in VA (top 8%) — strong family-tenant draw, lease renewals of 3-5y typical.
- Zoned schools: Pembroke Elementary (math 68% / reading 70%, grade A-, #351 of 1,108 statewide, top 32%, 522 students, 71% FRL); Bayside High (math 63% / reading 75%, grade B, #170 of 319 statewide, top 55%, 1,983 students, 65% FRL) — zoned schools average 68% FRL vs 28% district-wide (40 pts higher); higher-poverty schools than district average — tighter screening recommended.
- Market conditions: Rents rising fast (+5.6%/yr); 220 active listings in the ZIP; 31 comparable units currently listed for rent nearby; rentals at typical pace (median 21d on market — plan ~3-4 weeks tenant-placement turnaround); 666 units permitted in Virginia Beach city in 2024 (347 in 5+ unit buildings).
- This rent runs 40% of the median local income ($69k/yr) — at the standard rent-burdened threshold; future hikes will face affordability resistance.
Forward outlook
- Local home prices are declining (-3.0%/yr); year-one equity from $2k of loan paydown is wiped out by about $9k of value loss. Plan a longer hold.
- Virginia Beach County population projected at +6% by 2050 — modest demand growth; plan on rents tracking national, not racing it.
Negotiation context
- It's been on market 22 days — a 2% lower offer ($301k) is reasonable based on typical stale-listing flexibility.
- 2 sale attempts with the ask held roughly flat each time — persistent listings suggest the price (not the market) is what's stuck; bring a comps-based counter.
- Current owner paid $13k; list at $305k implies a 2162% gain — meaningful room to come down on a strong offer.
Risks & watch-outs
- Watch-outs: built in 1959 — expect roof / HVAC / electrical / plumbing capex.
- Climate carrying-cost: severe wind risk, 94% chance of damaging wind over 30y; extreme-heat days projected 7→16/yr by 2055 (HVAC capex compounding) — expect insurance premiums to compound above CPI over the hold.
Questions for the listing agent
- What do current leases actually rent for vs. the listed asking? Can we see a recent rent roll and the last 12 months of T-12 income?
- Built in 1959 — when were the roof, HVAC, electrical panel, plumbing, and water heater last replaced?
- Is there a deadline driving the sale (1031 exchange, divorce, estate, relocation)? That informs how much negotiation room exists.
- Schools are A-rated — typically a magnet for longer-tenancy family renters. What's the average tenant stay here, and is there a school-zone premium baked into asking?
- The area grade is low — what's the realistic commute time and amenity access for the typical tenant pool here? Any planned neighborhood developments (good or bad) we should know about?
- What's the average days-on-market for RENTAL listings here right now (not sales)? A rising rental-DOM trend means longer vacancies and softer asking-rent achievability than the comps imply.
- What's the recent tenant-quality profile in this submarket — average credit score on applications, eviction rate, late-payment / NSF rate, and stable-employment percentage? A property-management company in the area should have these aggregated.
- How much new for-sale + rental construction is in the pipeline within 1–3 miles? Heavy new supply typically softens prices + rents 12–24 months out; constrained supply supports both.
Investment metrics
- 1% rule
- 0.76% ✗
- Cap rate
- 5.86%
- Cash-on-cash
- -1.55%
- DSCR
- 0.93
- GRM
- 11.0
CMA / ARV
- ARV (on-the-fly)
- $391,437
- Comps found
- 12
Show comp detail 12 sales within ~0.75 mi
| Address | Dist | Beds/Ba | Sqft | Sold | Price | $/sf | Match |
|---|---|---|---|---|---|---|---|
| 4917 Carnation Ave | 0.35mi | 4/2.0 | 1,440 (+3%) | 2mo | $390,000 | $271 | 76 |
| 529 Longfellow Ave | 0.61mi | 4/1.5 | 1,403 (0%) | 2mo | $250,000 | $178 | 70 |
| 624 Cunningham Rd | 0.54mi | 4/2.0 | 1,380 (-2%) | 1mo | $405,000 | $293 | 69 |
| 404 Ticonderoga Rd | 0.20mi | 4/1.5 | 1,600 (+14%) | 0mo | $385,000 | $241 | 67 |
| 4504 Constitution Ct | 0.68mi | 4/2.0 | 1,403 (0%) | 1mo | $429,900 | $306 | 66 |
| 4516 Jeanne St | 0.61mi | 4/2.0 | 1,353 (-4%) | 2mo | $395,000 | $292 | 62 |
| 4900 Klamath Rd | 0.69mi | 4/1.0 | 1,338 (-5%) | 2mo | $340,000 | $254 | 57 |
| 509 Chownings Dr | 0.73mi | 3/2.0 (-1) | 1,365 (-3%) | 1mo | $330,000 | $242 | 54 |
| 4613 Hinsdale St | 0.51mi | 3/2.0 (-1) | 1,273 (-9%) | 2mo | $385,000 | $302 | 52 |
| 4505 William Pitt Ln | 0.64mi | 4/2.0 | 1,550 (+10%) | 2mo | $450,000 | $290 | 49 |
| 500 Southgate Ave | 0.50mi | 3/2.0 (-1) | 1,610 (+15%) | 1mo | $369,900 | $230 | 44 |
| 412 Lord North Rd | 0.62mi | 3/1.5 (-1) | 1,200 (-14%) | 1mo | $335,000 | $279 | 41 |
Match score weights: distance 35% · size 25% · config 20% · recency 20%. Top-matched comps best support the ARV.
Projected returns pro-forma
-3.0% appreciation · 5.61% rent growth · sell at horizon
- IRR
- -16.2%
- Equity multiple
- 0.41×
- Total profit
- $-50,308
- Equity at exit
- $45,503
- IRR
- -4.2%
- Equity multiple
- 0.69×
- Total profit
- $-26,088
- Equity at exit
- $26,386
Cash invested: $85,450 (down + closing). Projections, not guarantees.
Landlord ↔ Tenant lean methodology
- Overall (STATE)
- 55 Moderately Landlord-Leaning
- State Virginia
- 55 Moderately Landlord-Leaning · D+2
- County
- — inherits STATE
- City
- — inherits STATE
ZIP-level market 23462
- Rents YoY
- 5.6%
- Active inventory
- 220
- Price-to-rent
- 11.0×
Monthly cashflow live
- Estimated rent
- $2,319 high interval (Pro) →
- Mortgage (P&I)
- −$1,600
- Tax from tax record
- −$215 /mo · $2,582/yr
- Insurance
- −$127
- HOA
- −$0
- Vacancy / Maint / Mgmt
- −$487
- Net cashflow
- $-110
Break-even live
UW: 25.0% down · 7.5% · 30yr · 1.5% tax · 5.0% vac · 8.0% maint · 8.0% mgmt
Financing live
Cash to close
- Down payment
- $76,294
- Closing costs
- $9,155
- Reserves months
- —
- Total cash needed
- —
Loan-product check · same deal, 3 products live
Conventional
25% down · 7.5% · 30yr
- Down + closing
- —
- Monthly P&I
- —
- Monthly cashflow
- —
- DSCR
- —
- Eligible?
- —
Personal DTI + credit; lowest rate.
DSCR
20% down · 8.5% · 30yr
- Down + closing
- —
- Monthly P&I
- —
- Monthly cashflow
- —
- DSCR
- —
- Eligible?
- —
No personal income docs; deal must DSCR.
Hard money
10% down · 12.0% · 12mo
- Down + closing
- —
- Monthly P&I
- —
- Monthly cashflow
- —
- DSCR
- —
- Eligible?
- —
Short-term bridge; refi at stabilization.
Rent comps 31 comps
| Address | Beds | Baths | Sqft | Rent | $/sqft | DOM | Units | Dist |
|---|---|---|---|---|---|---|---|---|
| 4733 Adler Ave Virginia Beach, VA | 3.0 | 1.0 | 1150 | $1,995 | $1.73 | 21d | 1 | 0.33mi |
| 337 Dorset Ave Virginia Beach, VA | 3.0 | 1.0 | 1180 | $1,700 | $1.44 | 7d | 1 | 0.40mi |
| 5161 Weaver Dr Virginia Beach, VA | 2.0–3.0 | 1.0 | 971 | $1,675 | $1.73 | 4d | 4 | 0.70mi |
| 512 Featherstone Ct Unit 573F Virginia Beach, VA | 3.0 | 1.0 | 1047 | $1,675 | $1.60 | 23d | 1 | 0.76mi |
| 5206 Richard Rd Virginia Beach, VA | 3.0 | 1.5 | 1240 | $1,795 | $1.45 | 21d | 1 | 0.78mi |
| 5212 Richard Rd Virginia Beach, VA | 3.0 | 2.5 | 1372 | $2,100 | $1.53 | 21d | 1 | 0.79mi |
| 4409 Articles Ln Virginia Beach, VA | 3.0 | 1.5 | 1332 | $2,650 | $1.99 | 2d | 1 | 0.81mi |
| 449 Peregrine St Virginia Beach, VA | 3.0 | 2.0 | 1400 | $1,995 | $1.43 | 16d | 1 | 0.91mi |
| 326 Harrier St Virginia Beach, VA | 3.0 | 1.5 | 1178 | $1,995 | $1.69 | 16d | 1 | 0.91mi |
| 4884 Travertine Ave Unit 00 208203O Virginia Beach, VA | 3.0 | 2.0 | 1254 | $2,100 | $1.67 | 23d | 1 | 0.95mi |
| 4884 Travertine Ave Unit 00 216304M Virginia Beach, VA | 3.0 | 2.0 | 1254 | $2,250 | $1.79 | 17d | 1 | 0.95mi |
| 4968 Limestone Ave Unit 1 Virginia Beach, VA | 4.0 | 3.5 | 1815 | $3,000 | $1.65 | 23d | 1 | 1.03mi |
| 5509 Bulls Bay Dr Virginia Beach, VA | 3.0 | 2.5 | 1694 | $2,599 | $1.53 | 12d | 1 | 1.11mi |
| 5509 Bulls Bay Dr Unit 1 Virginia Beach, VA | 3.0 | 2.0 | 1694 | $2,599 | $1.53 | 4d | 1 | 1.11mi |
| 814 Gable Way Virginia Beach, VA | 3.0 | 2.5 | 1452 | $2,200 | $1.52 | 23d | 1 | 1.20mi |
| 5416 Sweetwater Ct Virginia Beach, VA | 4.0 | 2.5 | 1704 | $2,495 | $1.46 | 23d | 1 | 1.21mi |
| 5421 Sweetwater Ct Virginia Beach, VA | 3.0 | 2.5 | 1704 | $2,500 | $1.47 | 2d | 1 | 1.22mi |
| 825 Crossing Ct Virginia Beach, VA | 1.0–3.0 | 1.0–2.0 | 937 | $2,499 | $2.67 | 23d | 1 | 1.26mi |
| 412 Kenley Rd Virginia Beach, VA | 3.0 | 3.0 | 1424 | $2,400 | $1.69 | 12d | 1 | 1.32mi |
| 113 S Parliament Dr Virginia Beach, VA | 3.0 | 2.0 | 1770 | $2,600 | $1.47 | 23d | 1 | 1.33mi |
| 104 S Palm Ave Virginia Beach, VA | 3.0 | 2.5 | 1700 | $2,900 | $1.71 | 23d | 1 | 1.33mi |
| 4905 Windbrooke Ct Virginia Beach, VA | 3.0 | 2.5 | 1600 | $2,000 | $1.25 | 14d | 1 | 1.36mi |
| 5416 Safe Harbour Way Virginia Beach, VA | 3.0 | 2.5 | 1686 | $2,500 | $1.48 | 1d | 1 | 1.36mi |
| 202 Stonehall Ct Virginia Beach, VA | 3.0 | 2.5 | 1614 | $2,200 | $1.36 | 17d | 1 | 1.37mi |
| 202 Stonehall Ct Virginia Beach, VA | 3.0 | 2.5 | 1614 | $2,200 | $1.36 | 4d | 1 | 1.37mi |
| 800 Saint Denis Ct Virginia Beach, VA | 3.0 | 2.5 | 1750 | $1,950 | $1.11 | 23d | 1 | 1.40mi |
| 4863 Woods Edge Rd Virginia Beach, VA | 3.0 | 2.0 | 1239 | $2,100 | $1.69 | 4d | 1 | 1.41mi |
| 4800 Deming Ct Virginia Beach, VA | 3.0 | 2.0 | 1239 | $2,200 | $1.78 | 21d | 1 | 1.43mi |
| 616 Aubrey Dr Virginia Beach, VA | 3.0 | 1.5 | 1266 | $1,995 | $1.58 | 23d | 1 | 1.44mi |
| 317 Elderwood Ct Virginia Beach, VA | 3.0 | 2.5 | 1668 | $2,000 | $1.20 | 23d | 1 | 1.46mi |
| 4932 Westgrove Rd Virginia Beach, VA | 4.0 | 2.5 | 1400 | $2,450 | $1.75 | 23d | 1 | 1.47mi |
Listing history 12 events
-
2026-06-08days on market $305,178 Active 22 DOM
-
2026-06-07days on market $305,178 Active 21 DOM
-
2026-06-03days on market $305,178 Active 17 DOM
-
2026-06-02days on market $305,178 Active 16 DOM
-
2026-06-01days on market $305,178 Active 15 DOM
-
2026-05-31days on market $305,178 Active 14 DOM
-
2026-05-24status Active
-
2026-05-11status Under Contract
-
2026-05-08price $285,000
-
2026-05-08price $305,178
-
2026-05-04$299,999 Active
-
1959-05-28soldstatus $13,490
ⓘ Source: listings_history table (triggers on properties + properties_extension) + one-shot
backfill from property_details.listing_events for pre-trigger history.
Tax reassessment forecast VA · Resets to sale price
- Current annual tax
- $2,582 · $215/mo
- Projected year-2 tax
- $2,582 · $215/mo
- Expected delta
- $0/yr ($0/mo · 0.0%)
ⓘ Screening estimate from a state-policy table — verify with the county assessor before closing.
Climate risk First Street
- Flood 1/10 Low FEMA zone X (unshaded) · 0% chance over 30 yrs
- Wildfire 1/10 Low
- Heat 9/10 Extreme 7 d/yr ≥105°F today · 16 d/yr by 30 yrs out
- Wind 8/10 Severe 94% chance of damaging wind over 30 yrs
- Air quality 3/10 Moderate 2 unhealthy d/yr today · 4 by 30 yrs out
Nearby sold comps map
Loading sold comps map…
Walkable amenities ~0.75 mi
Loading nearby amenities…
Taxation est. · year 1
- Rental income
- $27,831
- − Mortgage interest
- −$17,095
- − Property taxes
- −$2,582
- − Insurance
- −$1,526
- − Repairs & maintenance
- −$2,226
- − Management
- −$2,226
- − Depreciation
- −$8,878
- Taxable loss
- −$6,702
- Est. tax savings @ 24.0%
- +$1,609
- After-tax cash flow
- $283/yr
For passive investors: Depreciation is non-cash, so a rental often shows a tax loss while cash-flowing — sheltering income. Rental losses are passive: they offset passive income freely, and up to $25,000/yr can offset ordinary (W-2) income if you actively participate and your MAGI is under $100k (phasing out to $0 by $150k); unused losses carry forward. On sale, claimed depreciation is recaptured at up to 25%, and gains may owe capital-gains tax (a 1031 exchange can defer both). Figures are a year-1 estimate at your 24.0% rate — not tax advice; consult a CPA.
Schools (NCES district)
- District
- Va Beach City Public School District
- NCES district ID
- 5103840
- Math proficiency
- 69% ▼ -19.00%
- Reading proficiency
- 78% ▼ -7.00%
- Median HH income
- $66,452
- Composite
- 63.81/100
- National rank
- #594
- State rank
- #10 of 131 in VA
Livability — Virginia Beach
- Score
- 83/100
- State rank
- #38
- US rank
- #880
Category grades
Schools grade is shown separately in the Schools card above.
Census & demographics
- Census place
- Virginia Beach, VA
- County
- Virginia Beach City · 448,227 people
- City population
- 448,227
- Metro
- Virginia Beach-Norfolk-Newport News, VA-NC
- Population (ZIP)
- 66,151
- Household income
- $69,040
- Rent vs Own
- Severe rent burden
- 3906.0
Population outlook (Virginia Beach County) Hauer SSP2
- Today (2025)
- 480,401 people
- By 2030
- 491,221 · +2.3%
- By 2040
- 504,882 · +5.1%
- By 2050
- 508,847 · +5.9%
- By 2075
- 504,831 · +5.1%
- By 2100
- 465,867 · -3.0%
Race, ethnicity, and origin ACS 2023
- Neighborhood character
- Diverse neighborhood (Simpson 0.68)
- Race & ethnicity
- White 45% Black 32% Hispanic / Latino 12% Two or more races 10% Asian 5%
- Hispanic origin (detail)
- Mexican 4% Puerto Rican 3%
- Common ancestry
- Romanian 2% Italian 1% Slovak 1%
- Foreign-born
- 9% · Canada, China, Vietnam
- Languages at home
- 87% English-only · Spanish 6% Tagalog/Filipino 2% Other Asian/Pacific 1%
Political lean MEDSL · Virginia Beach
- 2024 margin
- Toss-up / Even · D 50.7% · R 48.0% · Other 1.3%
- 2008→2024 swing
- +3.4pp toward D · 2008: -0.7pp · 2024: 2.6pp
- All cycles
- 2024: D+2.6 2020: D+5.4 2016: R+4.5 2012: R+2.5 2008: R+0.7
Not yet ingested
- Civics
- —
Market trends
- HPI YoY
- ▼ -269.19%
- Current HPI
- 333.1908
- Rent YoY
- ▲ 5.61%
- Metro
- Virginia Beach-Norfolk-Newport News, VA-NC
- State GDP YoY
- ▲ 2.40%
- F500 in state
- 50
Industry mix (Fortune 500 HQ in VA)
| Industry | F500 HQs | Revenue |
|---|---|---|
| Aerospace / Defense | 4 | $236B |
|
||
| Technology / Defense | 3 | $32B |
|
||
| Financial Services | 2 | $176B |
|
||
| Utilities | 2 | $27B |
|
||
| Insurance | 2 | $25B |
|
||
| Technology | 2 | $15B |
|
||
Price history
+2012.7% since first listed6 events — show timeline
- 2026-05-24 Relisted — REINMLS
- 2026-05-11 Pending — REINMLS
- 2026-05-08 Price Changed $285,000 REINMLS
- 2026-05-08 Price Changed $305,178 REINMLS
- 2026-05-04 Listed $299,999 REINMLS
- 1959-05-28 Sold (Public Records) $13,490 Public Records
Property tax history
+3.5%/yrLatest (2025): $2,582 · +2.7% YoY. Source: county tax records.
Cash-flow waterfall
monthlySold comps — $/sqft
last 12 mo · ≤1 miLoading sold comps…