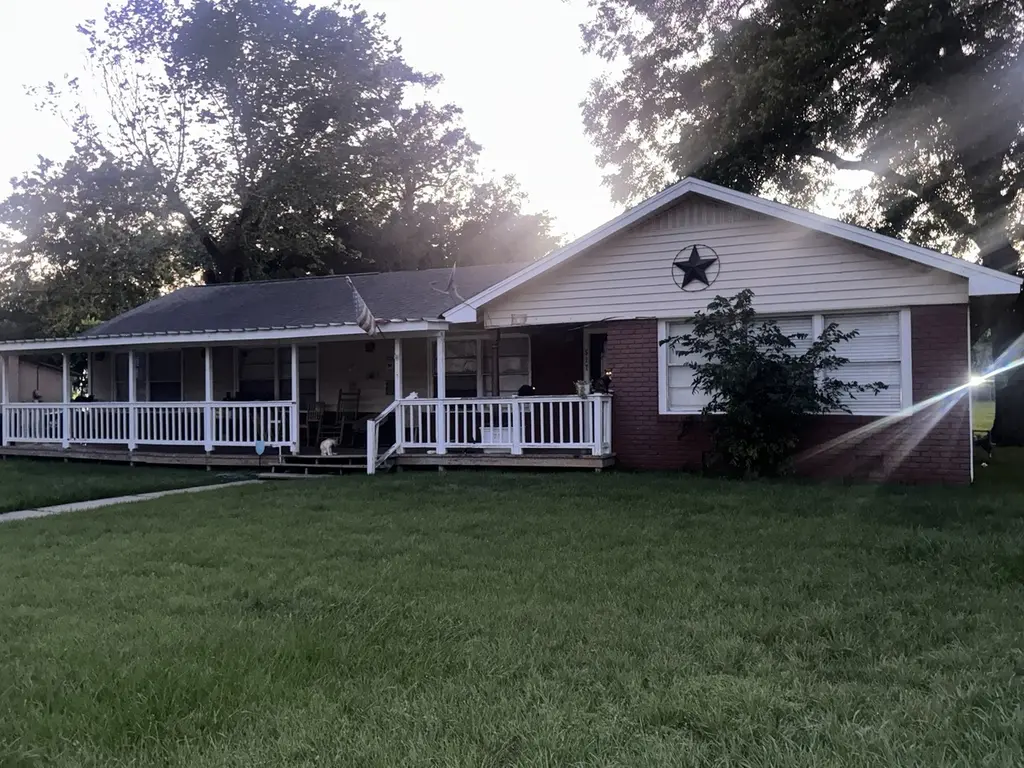
517 N Lake Ave · Eagle Lake, TX
Flood risk 1/10 · Minimal
- FEMA flood zone
- X (unshaded)
- Chance of flooding over 30 yrs
- 0.0%
- Est. flood insurance / yr
- $507 – $1,088
Fire risk 3/10 · Minor
- Est. fire insurance / yr
- $1,222 – $2,270
Heat risk 8/10 · Major
- Hot days now (above 112°F)
- 7 days/yr
- Hot days in 30 yrs
- 22 days/yr
Wind risk 9/10 · Severe
- Chance of severe wind over 30 yrs
- 99.0%
Air-quality risk 1/10 · Minimal
- Unhealthy air days now
- 0 days/yr
- Unhealthy air days in 30 yrs
- 0 days/yr
Risk factors via First Street. Map © Google.
Why this score? — see what drove the C grade
The composite is a weighted blend of 9 inputs, each scored 0–100. Each bar is that input's sub-score; the figure is the points it added to the 100-point composite (weight × sub-score).
- ARV discount +15.0/15.0
- Cash flow +14.9/30.0
- Appreciation +5.7/10.0
- 1% rule +5.2/10.0
- DSCR +4.5/10.0
- Livability +3.1/5.0
- Schools +2.8/10.0
- Rent growth +2.5/5.0
- Condition / age +2.5/5.0
$140,000
🖨 Deal sheet 📄 Offer letter ✓ Due diligence
Listing remarks
Charming property located in the heart of Eagle Lake offering space, character, and endless potential. Featuring over 2,100 square feet of living space situated on a generously sized lot, this home presents an excellent opportunity for families looking for room to grow, buyers wanting to personalize and add long term value over time, or investors searching for a property with strong upside potential. The spacious layout provides flexibility for everyday living, entertaining, or future improvements, while the large lot offers additional possibilities for outdoor enjoyment. Conveniently located near local schools, shopping, dining, and major roadways, this property combines small town charm w
Key facts
- Near dining
- Near shopping
- Generously sized lot
Tags
Property features AI
Finance
- Financial info: Lease not considered
Exterior
- Parking: Detached garage; 2-car garage
- Utilities: Public water; Public sewer
- Home design: Residential property; Built in 1955
- Exterior features: Lot approximately 0.3211 acres (about 13,987 square feet); Other lot features
Interior
- Bathrooms: 2 full bathrooms
- Interior features: 3 total rooms
Neighborhood map
What this means for you Summary
Snapshot
- This is a 3-bed/2.0-bath single-family listed at $140k.
Deal economics
- At list price, monthly cash flow is $40 ($479/yr) — positive.
- The deal already cash-flows at list — no discount required.
- Meets the 1% rule at list price ($1k rent vs $140k).
- Recommended offer: $136k (3.0% below list) — sets the bar for market timing.
- Cap rate 6.6% vs local median 3.7% in Eagle Lake — top-decile yield for the area; either an underpriced asset or a hidden risk that comps aren't pricing in. Stress-test before assuming the spread holds.
Location & tenants
- Location reads 62/100 on livability (#913 in TX) — a middle-class / working-renter tenant base. Strengths: cost of living A+, crime A-, housing B+; Watch: amenities F, commute F, employment D-.
- Rice CISD (rural): math 34% / reading 32% proficiency, ranked #574 of 826 in TX (top 70%) — families likely to look elsewhere, expect single-tenant / working-renter base with shorter leases; 68% free/reduced lunch — lower-income household profile, screen leases tightly.
- Zoned schools: Eagle Lake Int (math 37% / reading 27%, grade F, #2,268 of 4,322 statewide, top 55%, 180 students, 87% FRL) — zoned schools average 87% FRL vs 68% district-wide (19 pts higher); higher-poverty schools than district average — tighter screening recommended.
- Market conditions: 59 active listings in the ZIP; 29 units permitted in Colorado County in 2024 (0 in 5+ unit buildings).
Forward outlook
- In year one you build about $3k of equity ($968 loan paydown + $2k appreciation (1.3% local appreciation)).
- At projected returns (1.3% appreciation + 3.0% rent growth), your $39k cash investment doubles in ~9 years — after that, you're playing with house money.
Negotiation context
- It's been on market 36 days — a 3% lower offer ($136k) is reasonable based on typical stale-listing flexibility.
Risks & watch-outs
- Watch-outs: property tax is 2.5% of price; built in 1955 — expect roof / HVAC / electrical / plumbing capex.
- Climate carrying-cost: severe wind risk, 99% chance of damaging wind over 30y; extreme-heat days projected 7→22/yr by 2055 (HVAC capex compounding) — expect insurance premiums to compound above CPI over the hold.
Questions for the listing agent
- It's been on market 36 days. Have you received any prior offers? Is the seller open to a 3% concession, seller financing, or rate buy-down credit?
- Built in 1955 — when were the roof, HVAC, electrical panel, plumbing, and water heater last replaced?
- Property tax is high relative to price — has the assessment been appealed recently, and will the sale trigger a re-assessment?
- Is there a deadline driving the sale (1031 exchange, divorce, estate, relocation)? That informs how much negotiation room exists.
- Schools are F-rated, which usually means shorter tenancies and higher turnover. Who's the typical renter profile here, and what's been the actual vacancy rate?
- What's the average days-on-market for RENTAL listings here right now (not sales)? A rising rental-DOM trend means longer vacancies and softer asking-rent achievability than the comps imply.
- What's the recent tenant-quality profile in this submarket — average credit score on applications, eviction rate, late-payment / NSF rate, and stable-employment percentage? A property-management company in the area should have these aggregated.
- How much new for-sale + rental construction is in the pipeline within 1–3 miles? Heavy new supply typically softens prices + rents 12–24 months out; constrained supply supports both.
Investment metrics
- 1% rule
- 1.02% ✓
- Cap rate
- 6.63%
- Cash-on-cash
- 1.22%
- DSCR
- 1.05
- GRM
- 8.2
CMA / ARV
- ARV (median comp)
- $221,077
- List price
- $140,000
- Delta
- -36.67%
- Verdict
- UNDERPRICED
- Comps
- 20 within 1.0 mi
Show comp detail 8 sales within ~0.75 mi
| Address | Dist | Beds/Ba | Sqft | Sold | Price | $/sf | Match |
|---|---|---|---|---|---|---|---|
| 105 W Stockbridge St | 0.26mi | 2/2.0 (-1) | 2,003 (-7%) | 3mo | $225,000 | $112 | 69 |
| 601 Willow Ln | 0.54mi | 3/2.0 | 2,169 (+0%) | 7mo | $299,900 | $138 | 68 |
| 209 W Davitt St | 0.32mi | 4/3.5 (+1) | 2,132 (-1%) | 23mo | $305,000 | $143 | 53 |
| 401 E Harbert Ave | 0.24mi | 2/4.5 (-1) | 2,205 (+2%) | 22mo | $269,900 | $122 | 52 |
| 302 N Strickland Ave | 0.18mi | 4/3.0 (+1) | 2,476 (+15%) | 8mo | $299,000 | $121 | 51 |
| 500 W Post Office St | 0.49mi | 4/2.0 (+1) | 2,400 (+11%) | 7mo | $399,990 | $167 | 48 |
| 207 W Main St | 0.43mi | 3/2.0 | 1,933 (-10%) | 20mo | $250,000 | $129 | 45 |
| 333 W Prairie Ave | 0.35mi | 4/2.0 (+1) | 2,399 (+11%) | 23mo | $219,000 | $91 | 41 |
Match score weights: distance 35% · size 25% · config 20% · recency 20%. Top-matched comps best support the ARV.
Projected returns pro-forma
1.3% appreciation · 3.0% rent growth · sell at horizon
- IRR
- 3.6%
- Equity multiple
- 1.19×
- Total profit
- $7,327
- Equity at exit
- $49,998
- IRR
- 7.9%
- Equity multiple
- 1.99×
- Total profit
- $38,917
- Equity at exit
- $68,182
Cash invested: $39,200 (down + closing). Projections, not guarantees.
Landlord ↔ Tenant lean methodology
- Overall (STATE)
- 87 Strongly Landlord-Friendly
- State Texas
- 87 Strongly Landlord-Friendly · R+5
- County
- — inherits STATE
- City
- — inherits STATE
ZIP-level market 77434
- Home prices YoY
- 0.7%
- Active inventory
- 59
- Price-to-rent
- 8.2×
Monthly cashflow live
- Estimated rent
- $1,430 medium interval (Pro) →
- Mortgage (P&I)
- −$734
- Tax from tax record
- −$297 /mo · $3,565/yr
- Insurance
- −$58
- HOA
- −$0
- Vacancy / Maint / Mgmt
- −$300
- Net cashflow
- $40
Break-even live
UW: 25.0% down · 7.5% · 30yr · 1.5% tax · 5.0% vac · 8.0% maint · 8.0% mgmt
Financing live
Cash to close
- Down payment
- $35,000
- Closing costs
- $4,200
- Reserves months
- —
- Total cash needed
- —
Loan-product check · same deal, 3 products live
Conventional
25% down · 7.5% · 30yr
- Down + closing
- —
- Monthly P&I
- —
- Monthly cashflow
- —
- DSCR
- —
- Eligible?
- —
Personal DTI + credit; lowest rate.
DSCR
20% down · 8.5% · 30yr
- Down + closing
- —
- Monthly P&I
- —
- Monthly cashflow
- —
- DSCR
- —
- Eligible?
- —
No personal income docs; deal must DSCR.
Hard money
10% down · 12.0% · 12mo
- Down + closing
- —
- Monthly P&I
- —
- Monthly cashflow
- —
- DSCR
- —
- Eligible?
- —
Short-term bridge; refi at stabilization.
Listing history 17 events
-
2026-06-18days on market $140,000 Active 36 DOM
-
2026-06-17days on market $140,000 Active 35 DOM
-
2026-06-16days on market $140,000 Active 34 DOM
-
2026-06-15days on market $140,000 Active 33 DOM
-
2026-06-15days on market $140,000 Active 32 DOM
-
2026-06-13days on market $140,000 Active 31 DOM
-
2026-06-12days on market $140,000 Active 30 DOM
-
2026-06-09days on market $140,000 Active 27 DOM
-
2026-06-08days on market $140,000 Active 26 DOM
-
2026-06-08days on market $140,000 Active 25 DOM
-
2026-06-05days on market $140,000 Active 23 DOM
-
2026-06-03days on market $140,000 Active 21 DOM
-
2026-06-02days on market $140,000 Active 20 DOM
-
2026-06-01days on market $140,000 Active 19 DOM
-
2026-05-31days on market $140,000 Active 18 DOM
-
2026-05-13$160,000 Active 841-char remark
-
2019-10-29soldstatus
ⓘ Source: listings_history table (triggers on properties + properties_extension) + one-shot
backfill from property_details.listing_events for pre-trigger history.
Tax reassessment forecast TX · Resets to sale price
- Current annual tax
- $3,565 · $297/mo
- Projected year-2 tax
- $3,565 · $297/mo
- Expected delta
- $0/yr ($0/mo · 0.0%)
ⓘ Screening estimate from a state-policy table — verify with the county assessor before closing.
Climate risk First Street
- Flood 1/10 Low FEMA zone X (unshaded) · 0% chance over 30 yrs
- Wildfire 3/10 Moderate
- Heat 8/10 Severe 7 d/yr ≥112°F today · 22 d/yr by 30 yrs out
- Wind 9/10 Extreme 99% chance of damaging wind over 30 yrs
- Air quality 1/10 Low 0 unhealthy d/yr today · 0 by 30 yrs out
Nearby sold comps map
Loading sold comps map…
Walkable amenities ~0.75 mi
Loading nearby amenities…
Taxation est. · year 1
- Rental income
- $17,156
- − Mortgage interest
- −$7,842
- − Property taxes
- −$3,565
- − Insurance
- −$700
- − Repairs & maintenance
- −$1,373
- − Management
- −$1,373
- − Depreciation
- −$4,073
- Taxable loss
- −$1,768
- Est. tax savings @ 24.0%
- +$424
- After-tax cash flow
- $903/yr
For passive investors: Depreciation is non-cash, so a rental often shows a tax loss while cash-flowing — sheltering income. Rental losses are passive: they offset passive income freely, and up to $25,000/yr can offset ordinary (W-2) income if you actively participate and your MAGI is under $100k (phasing out to $0 by $150k); unused losses carry forward. On sale, claimed depreciation is recaptured at up to 25%, and gains may owe capital-gains tax (a 1031 exchange can defer both). Figures are a year-1 estimate at your 24.0% rate — not tax advice; consult a CPA.
Schools (NCES district)
- District
- Rice CISD
- NCES district ID
- 4836970
- Math proficiency
- 34% ▼ -9.00%
- Reading proficiency
- 32% ▼ -2.00%
- Median HH income
- $39,704
- Composite
- 27.72/100
- National rank
- #6907
- State rank
- #574 of 826 in TX
Livability — Eagle Lake
- Score
- 62/100
- State rank
- #913
- US rank
- #16344
Category grades
Schools grade is shown separately in the Schools card above.
Census & demographics
- Census place
- Eagle Lake, TX
- Population (ZIP)
- 4,037
Population outlook (Colorado County) Hauer SSP2
- Today (2025)
- 20,932 people
- By 2030
- 20,803 · -0.6%
- By 2040
- 20,518 · -2.0%
- By 2050
- 20,325 · -2.9%
- By 2075
- 20,086 · -4.0%
- By 2100
- 18,228 · -12.9%
Race, ethnicity, and origin ACS 2023
- Neighborhood character
- Diverse neighborhood (Simpson 0.57)
- Race & ethnicity
- Hispanic / Latino 58% White 22% Black 19% Two or more races 16% Native American 2%
- Hispanic origin (detail)
- Mexican 54%
- Common ancestry
- Lithuanian 4% Italian 1%
- Foreign-born
- 9% · Canada
- Languages at home
- 68% English-only · Spanish 32%
Political lean MEDSL · Colorado
- 2024 margin
- Solid R (+57.2) · D 21.1% · R 78.3%
- 2008→2024 swing
- -17.9pp toward R · 2008: -39.4pp · 2024: -57.2pp
- All cycles
- 2024: R+57.2 2020: R+50.6 2016: R+51.2 2012: R+49.3 2008: R+39.4
Not yet ingested
- Civics
- —
Market trends
- HPI YoY
- ▲ 1.30%
- Current HPI
- 179.6872
- Rent YoY
- —
- Metro
- —
- State GDP YoY
- ▲ 3.95%
- F500 in state
- 110
Industry mix (Fortune 500 HQ in TX)
| Industry | F500 HQs | Revenue |
|---|---|---|
| Energy | 16 | $1,198B |
|
||
| Technology | 5 | $198B |
|
||
| Engineering / Construction | 4 | $72B |
|
||
| Energy Services | 3 | $60B |
|
||
| Utilities | 3 | $41B |
|
||
| Healthcare | 2 | $330B |
|
||
Price history
-12.5% since first listed3 events — show timeline
- 2026-05-29 Price Changed $140,000 HARMLS
- 2026-05-13 Listed $160,000 HARMLS
- 2019-10-29 Sold (Public Records) — Public Records
Property tax history
+5.7%/yrLatest (2025): $3,565 · +7.5% YoY. Source: county tax records.
Cash-flow waterfall
monthlySold comps — $/sqft
last 12 mo · ≤1 miLoading sold comps…