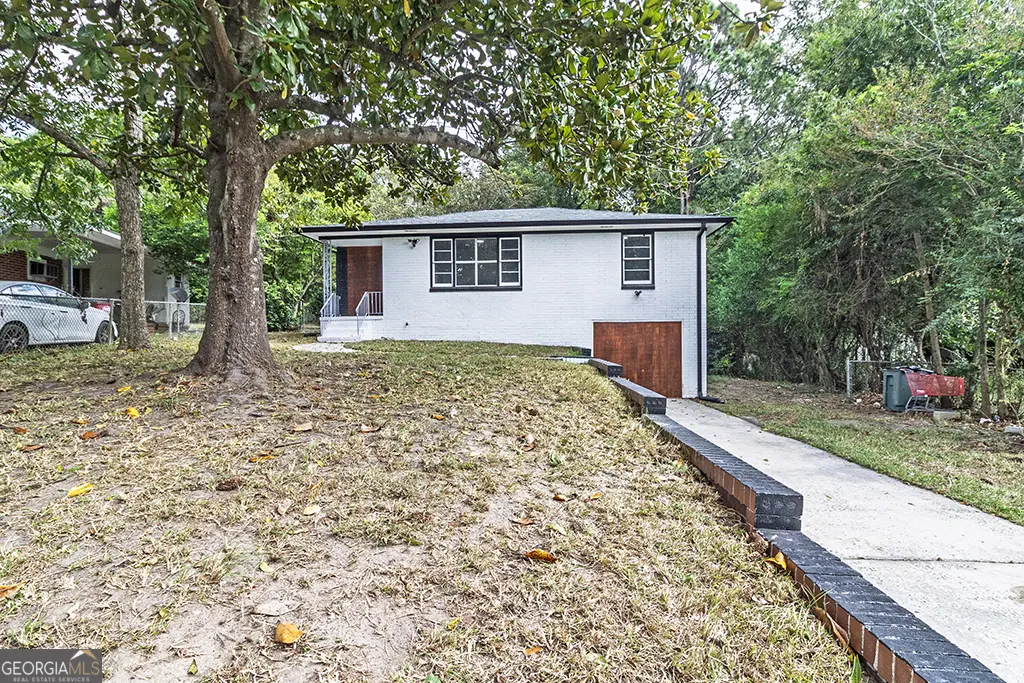
1124 N Beddingfield Dr · Macon-Bibb County, GA
Flood risk 1/10 · Minimal
- FEMA flood zone
- X (unshaded)
- Chance of flooding over 30 yrs
- 0.0%
- Est. flood insurance / yr
- $473 – $860
Fire risk 1/10 · Minimal
- Est. fire insurance / yr
- $963 – $1,789
Heat risk 7/10 · Major
- Hot days now (above 109°F)
- 7 days/yr
- Hot days in 30 yrs
- 17 days/yr
Wind risk 6/10 · Moderate
- Chance of severe wind over 30 yrs
- 68.0%
Air-quality risk 3/10 · Minor
- Unhealthy air days now
- 3 days/yr
- Unhealthy air days in 30 yrs
- 4 days/yr
Risk factors via First Street. Map © Google.
Why this score? — see what drove the D- grade
The composite is a weighted blend of 9 inputs, each scored 0–100. Each bar is that input's sub-score; the figure is the points it added to the 100-point composite (weight × sub-score).
- Cash flow +13.8/30.0
- ARV discount +7.5/15.0
- DSCR +4.2/10.0
- Rent growth +3.8/5.0
- 1% rule +2.6/10.0
- Livability +2.5/5.0
- Condition / age +2.5/5.0
- Schools +1.2/10.0
- Appreciation +0.0/10.0
$129,900
🖨 Deal sheet 📄 Offer letter ✓ Due diligence
Listing remarks
Presenting this beautifully renovated 4 bedroom, 2 bath home offering almost 1,300 SQFT of well designed living space. Nestled on a 0.27 acre lot, this property features a long driveway, a huge front yard, and an equally spacious backyard perfect for gatherings, gardening, or simply enjoying the outdoors. The exterior boasts classic 4 sided brick construction, complemented by fresh paint, new gutters, and a roof in great condition, giving this home both durability and curb appeal. Step inside to find a bright, welcoming interior that has been thoughtfully updated from top to bottom. The freshly stained hardwood floors flow beautifully throughout, enhancing the home's warmth and character. T
Key facts
- Renovated home
- Spacious backyard
- Fresh paint
Tags
Neighborhood map
What this means for you Summary
Snapshot
- This is a 2-bed/1.0-bath single-family listed at $130k.
Deal economics
- At list price, monthly cash flow is $12 ($148/yr) — positive.
- The deal already cash-flows at list — no discount required.
- To meet the 1% rule (rent ≥ 1% of price), the offer needs to be $98k (24.5% below list).
- Recommended offer: $98k (24.5% below list) — sets the bar for 1% rule.
Location & tenants
- Location reads: area grade D — affects rentability + tenant quality, not the cash-flow math above.
- Bibb County (urban): math 11% / reading 18% proficiency, ranked #161 of 174 in GA (top 92%) — low school quality limits family demand, transient renter base, plan for 1-2y turnover; 75% free/reduced lunch — lower-income household profile, screen leases tightly.
- Market conditions: Rents rising fast (+5.0%/yr); 207 active listings in the ZIP; 29 comparable units currently listed for rent nearby; rentals lingering (median 44d on market — plan ~5-8 weeks vacancy on turnover, expect pricing pressure); 69% of comp listings sitting > 30 days — soft ceiling on asking rent; lower-income renter base — watch delinquency; 154 units permitted in Bibb County in 2024 (0 in 5+ unit buildings).
- This rent runs 39% of the median local income ($30k/yr) — at the standard rent-burdened threshold; future hikes will face affordability resistance.
Forward outlook
- Local home prices are declining (-3.0%/yr); year-one equity from $898 of loan paydown is wiped out by about $4k of value loss. Plan a longer hold.
- Bibb County population projected at -12% by 2050 — secular population decline; favor cash flow + early exit over multi-decade hold.
Negotiation context
- It's been on market 21 days — a 2% lower offer ($128k) is reasonable based on typical stale-listing flexibility.
- 7 sale attempts since 2y ago; this cycle's ask has dropped $20k (13%) from the opening price — seller is motivated, your offer sets the floor, not the list.
- Current owner paid $35k; list at $130k implies a 271% gain — meaningful room to come down on a strong offer.
Risks & watch-outs
- Watch-outs: built in 1957 — expect roof / HVAC / electrical / plumbing capex.
- Climate carrying-cost: major wind risk, 68% chance of damaging wind over 30y; extreme-heat days projected 7→17/yr by 2055 (HVAC capex compounding) — expect insurance premiums to compound above CPI over the hold.
Questions for the listing agent
- Built in 1957 — when were the roof, HVAC, electrical panel, plumbing, and water heater last replaced?
- Is there a deadline driving the sale (1031 exchange, divorce, estate, relocation)? That informs how much negotiation room exists.
- The area grade is low — what's the realistic commute time and amenity access for the typical tenant pool here? Any planned neighborhood developments (good or bad) we should know about?
- What's the average days-on-market for RENTAL listings here right now (not sales)? A rising rental-DOM trend means longer vacancies and softer asking-rent achievability than the comps imply.
- What's the recent tenant-quality profile in this submarket — average credit score on applications, eviction rate, late-payment / NSF rate, and stable-employment percentage? A property-management company in the area should have these aggregated.
- How much new for-sale + rental construction is in the pipeline within 1–3 miles? Heavy new supply typically softens prices + rents 12–24 months out; constrained supply supports both.
Investment metrics
- 1% rule
- 0.76% ✗
- Cap rate
- 6.41%
- Cash-on-cash
- 0.41%
- DSCR
- 1.02
- GRM
- 11.0
CMA / ARV
- ARV (median comp)
- $74,601
- List price
- $129,900
- Delta
- 80.83%
- Verdict
- OVERPRICED
- Comps
- 20 within 1.0 mi
Show comp detail 12 sales within ~0.75 mi
| Address | Dist | Beds/Ba | Sqft | Sold | Price | $/sf | Match |
|---|---|---|---|---|---|---|---|
| 3366 Pio Nono Cir | 0.32mi | 3/1.0 (+1) | 962 (-2%) | 8mo | $106,000 | $110 | 70 |
| 3366 Pio Nono Cir | 0.32mi | 3/1.0 (+1) | 962 (-2%) | 8mo | $106,000 | $110 | 70 |
| 826 W Grenada Ter | 0.31mi | 2/1.0 | 1,075 (+9%) | 4mo | $35,000 | $33 | 67 |
| 1138 Newberg Ave | 0.27mi | 3/1.0 (+1) | 1,106 (+12%) | 6mo | $82,000 | $74 | 57 |
| 1162 Ruben Drive Dr Unit m | 0.71mi | 2/1.0 | 960 (-2%) | 8mo | $19,500 | $20 | 56 |
| 1162 Ruben Dr | 0.71mi | 2/1.0 | 960 (-2%) | 8mo | $19,500 | $20 | 56 |
| 1527 Hurley Cir | 0.57mi | 3/1.0 (+1) | 1,056 (+7%) | 6mo | $58,900 | $56 | 51 |
| 3480 Travis Blvd | 0.67mi | 3/1.0 (+1) | 1,056 (+7%) | 1mo | $50,000 | $47 | 51 |
| 1322 Triple Hill Dr | 0.60mi | 2/1.0 | 1,117 (+14%) | 6mo | $27,500 | $25 | 44 |
| 3874 St. Charles Pl | 0.71mi | 2/1.0 | 864 (-12%) | 5mo | $20,000 | $23 | 42 |
| 3778 Spencer Cir | 0.64mi | 3/1.0 (+1) | 864 (-12%) | 5mo | $45,000 | $52 | 41 |
| 3229 Harrel St | 0.66mi | 3/2.5 (+1) | 1,064 (+8%) | 8mo | $6,200 | $6 | 38 |
Match score weights: distance 35% · size 25% · config 20% · recency 20%. Top-matched comps best support the ARV.
Projected returns pro-forma
-3.0% appreciation · 5.03% rent growth · sell at horizon
- IRR
- -13.8%
- Equity multiple
- 0.50×
- Total profit
- $-18,289
- Equity at exit
- $19,369
- IRR
- -2.4%
- Equity multiple
- 0.82×
- Total profit
- $-6,447
- Equity at exit
- $11,231
Cash invested: $36,372 (down + closing). Projections, not guarantees.
Landlord ↔ Tenant lean methodology
- Overall (STATE)
- 90 Strongly Landlord-Friendly
- State Georgia
- 90 Strongly Landlord-Friendly · R+3
- County
- — inherits STATE
- City
- — inherits STATE
ZIP-level market 31206
- Rents YoY
- 5.0%
- Active inventory
- 207
- Price-to-rent
- 11.0×
Monthly cashflow live
- Estimated rent
- $981 high interval (Pro) →
- Mortgage (P&I)
- −$681
- Tax from tax record
- −$28 /mo · $330/yr
- Insurance
- −$54
- HOA
- −$0
- Vacancy / Maint / Mgmt
- −$206
- Net cashflow
- $12
Break-even live
UW: 25.0% down · 7.5% · 30yr · 1.5% tax · 5.0% vac · 8.0% maint · 8.0% mgmt
Financing live
Cash to close
- Down payment
- $32,475
- Closing costs
- $3,897
- Reserves months
- —
- Total cash needed
- —
Loan-product check · same deal, 3 products live
Conventional
25% down · 7.5% · 30yr
- Down + closing
- —
- Monthly P&I
- —
- Monthly cashflow
- —
- DSCR
- —
- Eligible?
- —
Personal DTI + credit; lowest rate.
DSCR
20% down · 8.5% · 30yr
- Down + closing
- —
- Monthly P&I
- —
- Monthly cashflow
- —
- DSCR
- —
- Eligible?
- —
No personal income docs; deal must DSCR.
Hard money
10% down · 12.0% · 12mo
- Down + closing
- —
- Monthly P&I
- —
- Monthly cashflow
- —
- DSCR
- —
- Eligible?
- —
Short-term bridge; refi at stabilization.
Rent comps 29 comps
| Address | Beds | Baths | Sqft | Rent | $/sqft | DOM | Units | Dist |
|---|---|---|---|---|---|---|---|---|
| 1148 N Beddingfield Dr Macon, GA | 3.0 | 1.0 | 1076 | $825 | $0.77 | 43d | 1 | 0.20mi |
| 1164 Newberg Ave Macon, GA | 3.0 | 1.0 | 1100 | $1,195 | $1.09 | 43d | 1 | 0.26mi |
| 3238 Somerset Dr Macon, GA | 3.0 | 1.0 | 1100 | $975 | $0.89 | 13d | 1 | 0.30mi |
| 837 Newberg Ave Macon, GA | 3.0 | 1.0 | 966 | $750 | $0.78 | 43d | 1 | 0.38mi |
| 3149 Somerset Dr Macon, GA | 2.0 | 1.0 | 897 | $745 | $0.83 | 43d | 1 | 0.43mi |
| 1156 Triple Hill Dr Macon, GA | 2.0 | 1.0 | 980 | $875 | $0.89 | 13d | 1 | 0.49mi |
| 1089 Brisbane St Macon, GA | 3.0 | 1.0 | 816 | $1,075 | $1.32 | 13d | 1 | 0.61mi |
| 3778 Spencer Cir Macon, GA | 3.0 | 1.0 | 864 | $1,300 | $1.50 | 20d | 1 | 0.62mi |
| 3423 Flamingo Dr Macon, GA | 3.0 | 1.0 | 1048 | $895 | $0.85 | 43d | 1 | 0.62mi |
| 3080 Rice Mill Rd Unit M-5 Macon, GA | 1.0 | 1.0 | 875 | $750 | $0.86 | 43d | 1 | 0.66mi |
| 3080 Rice Mill Rd Unit C-1 Macon, GA | 3.0 | 1.5 | 1100 | $925 | $0.84 | 20d | 1 | 0.66mi |
| 3080 Rice Mill Rd Macon, GA | 3.0 | 1.0 | 1100 | $950 | $0.86 | 43d | 1 | 0.66mi |
| 3837 Spencer Cir Macon, GA | 3.0 | 1.0 | 1080 | $1,300 | $1.20 | 43d | 1 | 0.73mi |
| 3823 Saint Charles Pl Macon, GA | 3.0 | 1.0 | 1020 | $1,150 | $1.13 | 43d | 1 | 0.75mi |
| 4196 Mikado Ave Unit A Macon, GA | 1.0 | 1.0 | 897 | $950 | $1.06 | 43d | 1 | 0.77mi |
| 4196 Mikado Ave Unit B Macon, GA | 1.0 | 1.0 | 890 | $900 | $1.01 | 43d | 1 | 0.77mi |
| 1332 Hillridge Dr Macon, GA | 3.0 | 2.0 | 1050 | $1,050 | $1.00 | 13d | 1 | 0.80mi |
| 534 Lynmore Ave Macon, GA | 2.0 | 1.0 | 864 | $925 | $1.07 | 43d | 1 | 0.84mi |
| 4028 Saint Charles Pl Macon, GA | 3.0 | 1.0 | 900 | $800 | $0.89 | 20d | 1 | 0.84mi |
| 614 Cleveland St Macon, GA | 1.0 | 1.0 | 650 | $800 | $1.23 | 43d | 1 | 0.89mi |
| 558 Cleveland St Macon, GA | 2.0 | 1.0 | 924 | $925 | $1.00 | 43d | 1 | 0.96mi |
| 906 Thomas St Macon, GA | 2.0 | 1.0 | 800 | $650 | $0.81 | 43d | 1 | 1.13mi |
| 955 Putnam St Unit 1 Macon, GA | 3.0 | 1.0 | 950 | $1,199 | $1.26 | 43d | 1 | 1.19mi |
| 1260 Auburn Dr Macon, GA | 3.0 | 1.0 | 864 | $1,295 | $1.50 | 20d | 1 | 1.24mi |
| 1260 Auburn Dr Macon, GA | 3.0 | 1.0 | 864 | $1,075 | $1.24 | 43d | 1 | 1.24mi |
| 2445 Lowe St Macon, GA | 2.0 | 1.0 | 940 | $890 | $0.95 | 43d | 1 | 1.26mi |
| 2349 Mason St Macon, GA | 1.0 | 1.0 | 552 | $625 | $1.13 | 43d | 1 | 1.26mi |
| 806 Armory Dr Unit B Macon, GA | 3.0 | 1.0 | 1100 | $975 | $0.89 | 43d | 1 | 1.35mi |
| 672 Bowden St Macon, GA | 2.0 | 1.0 | 1076 | $900 | $0.84 | 20d | 1 | 1.40mi |
Listing history 37 events
-
2026-06-19days on market $129,900 Active 21 DOM
-
2026-06-18days on market $129,900 Active 20 DOM
-
2026-06-17days on market $129,900 Active 19 DOM
-
2026-06-16days on market $129,900 Active 18 DOM
-
2026-06-15days on market $129,900 Active 17 DOM
-
2026-06-14days on market $129,900 Active 15 DOM
-
2026-06-13statusdays on market $129,900 Active 14 DOM
-
2026-06-10days on market $129,900 New 12 DOM
-
2026-06-09days on market $129,900 New 11 DOM
-
2026-06-08days on market $129,900 New 10 DOM
-
2026-06-07days on market $129,900 New 9 DOM
-
2026-06-03days on market $129,900 New 5 DOM
-
2026-06-02days on market $129,900 New 4 DOM
-
2026-06-01days on market $129,900 New 3 DOM
-
2026-05-31days on market $129,900 New 2 DOM
-
2026-05-30pricestatusdays on market $129,900 New 1 DOM
-
2026-02-28historical
-
2025-12-17price $134,900
-
2025-11-26historical
-
2025-11-20price $144,900
-
2025-10-11$134,900 New
-
2025-10-11$139,900 New
-
2025-10-11$149,900 New
-
2024-11-05soldstatus $35,000
-
2024-11-01soldstatus $35,000 Sold
-
2024-10-17status Under Contract
-
2024-10-15historical
-
2024-10-14$36,000 New
-
2024-10-14historical
-
2024-10-02price $39,900
-
2024-10-02price $39,900
-
2024-09-27price $44,900
-
2024-09-27price $43,900
-
2024-09-14$48,900 Active
-
2024-09-14$48,900 New
-
2024-07-15historical
-
2024-06-06$47,000 New
ⓘ Source: listings_history table (triggers on properties + properties_extension) + one-shot
backfill from property_details.listing_events for pre-trigger history.
Tax reassessment forecast GA · Resets to sale price
- Current annual tax
- $330 · $28/mo
- Projected year-2 tax
- $1,195 · $100/mo
- Expected delta
- +$865/yr (+$72/mo · 261.7%)
ⓘ Screening estimate from a state-policy table — verify with the county assessor before closing.
Climate risk First Street
- Flood 1/10 Low FEMA zone X (unshaded) · 0% chance over 30 yrs
- Wildfire 1/10 Low
- Heat 7/10 Severe 7 d/yr ≥109°F today · 17 d/yr by 30 yrs out
- Wind 6/10 Major 68% chance of damaging wind over 30 yrs
- Air quality 3/10 Moderate 3 unhealthy d/yr today · 4 by 30 yrs out
Nearby sold comps map
Loading sold comps map…
Walkable amenities ~0.75 mi
Loading nearby amenities…
Taxation est. · year 1
- Rental income
- $11,775
- − Mortgage interest
- −$7,276
- − Property taxes
- −$330
- − Insurance
- −$650
- − Repairs & maintenance
- −$942
- − Management
- −$942
- − Depreciation
- −$3,779
- Taxable loss
- −$2,144
- Est. tax savings @ 24.0%
- +$515
- After-tax cash flow
- $662/yr
For passive investors: Depreciation is non-cash, so a rental often shows a tax loss while cash-flowing — sheltering income. Rental losses are passive: they offset passive income freely, and up to $25,000/yr can offset ordinary (W-2) income if you actively participate and your MAGI is under $100k (phasing out to $0 by $150k); unused losses carry forward. On sale, claimed depreciation is recaptured at up to 25%, and gains may owe capital-gains tax (a 1031 exchange can defer both). Figures are a year-1 estimate at your 24.0% rate — not tax advice; consult a CPA.
Schools (NCES district)
- District
- Bibb County
- NCES district ID
- 1300420
- Math proficiency
- 11% ▼ -14.00%
- Reading proficiency
- 18% ▼ -11.00%
- Median HH income
- $37,426
- Composite
- 12.13/100
- National rank
- #9654
- State rank
- #161 of 174 in GA
Livability — Macon-Bibb County
No livability data for this city. (Only ~50 U.S. cities are tracked.)
Census & demographics
- Census place
- Macon-Bibb County, GA
- County
- Bibb County · 164,332 people
- City population
- 143,186
- Metro
- Macon-Bibb County, GA
- Population (ZIP)
- 24,310
- Household income
- $30,042
- Rent vs Own
- Severe rent burden
- 1335.0
Population outlook (Bibb County) Hauer SSP2
- Today (2025)
- 148,772 people
- By 2030
- 145,904 · -1.9%
- By 2040
- 139,404 · -6.3%
- By 2050
- 131,603 · -11.5%
- By 2075
- 111,050 · -25.4%
- By 2100
- 83,346 · -44.0%
Race, ethnicity, and origin ACS 2023
- Neighborhood character
- Predominantly Black (76%)
- Race & ethnicity
- Black 76% White 12% Hispanic / Latino 8% Two or more races 4%
- Hispanic origin (detail)
- Mexican 5% Puerto Rican 1%
- Common ancestry
- Lithuanian 1% Italian 1%
- Foreign-born
- 4% · Canada
- Languages at home
- 91% English-only · Spanish 8%
Political lean MEDSL · Bibb
- 2024 margin
- Strong D (+22.4) · D 61.0% · R 38.5%
- 2008→2024 swing
- +4.4pp toward D · 2008: 18.0pp · 2024: 22.4pp
- All cycles
- 2024: D+22.4 2020: D+23.8 2016: D+20.2 2012: D+20.0 2008: D+18.0
Not yet ingested
- Civics
- —
Market trends
- HPI YoY
- ▼ -80.17%
- Current HPI
- 148.6765
- Rent YoY
- ▲ 5.03%
- Metro
- Macon-Bibb County, GA
- State GDP YoY
- ▲ 2.66%
- F500 in state
- 28
Industry mix (Fortune 500 HQ in GA)
| Industry | F500 HQs | Revenue |
|---|---|---|
| Paper / Packaging | 2 | $29B |
|
||
| Retail | 1 | $160B |
|
||
| Transportation / Logistics | 1 | $91B |
|
||
| Airlines | 1 | $62B |
|
||
| Consumer Goods | 1 | $47B |
|
||
| Utilities | 1 | $25B |
|
||
Price history
+187.0% since first listed21 events — show timeline
- 2026-02-28 Listing Removed — GAMLS
- 2025-12-17 Price Changed $134,900 GAMLS
- 2025-11-26 Listing Removed — GAMLS
- 2025-11-20 Price Changed $144,900 GAMLS
- 2025-10-11 Listed $149,900 GAMLS
- 2025-10-11 Listed $139,900 GAMLS
- 2025-10-11 Listed $134,900 GAMLS
- 2024-11-05 Sold (Public Records) $35,000 Public Records
- 2024-11-01 Sold (MLS) $35,000 GAMLS
- 2024-10-17 Pending — GAMLS
- 2024-10-15 Listing Removed — FMLS
- 2024-10-14 Listing Removed — GAMLS
- 2024-10-14 Listed $36,000 GAMLS
- 2024-10-02 Price Changed $39,900 GAMLS
- 2024-10-02 Price Changed $39,900 FMLS
- 2024-09-27 Price Changed $44,900 GAMLS
- 2024-09-27 Price Changed $43,900 FMLS
- 2024-09-14 Listed $48,900 GAMLS
- 2024-09-14 Listed $48,900 FMLS
- 2024-07-15 Listing Removed — GAMLS
- 2024-06-06 Listed $47,000 GAMLS
Property tax history
+12.6%/yrLatest (2025): $330 · -13.5% YoY. Source: county tax records.
Cash-flow waterfall
monthlySold comps — $/sqft
last 12 mo · ≤1 miLoading sold comps…