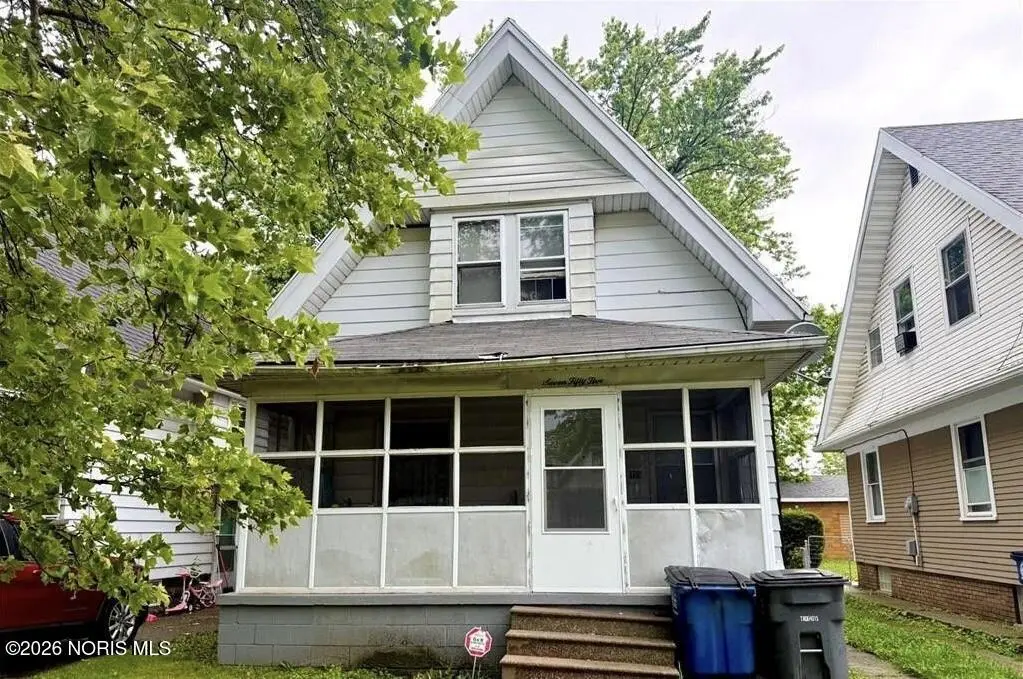
755 Dearborn Ave · Toledo, OH
Flood risk 1/10 · Minimal
- FEMA flood zone
- X (unshaded)
- Chance of flooding over 30 yrs
- 0.0%
- Est. flood insurance / yr
- $473 – $860
Fire risk 1/10 · Minimal
- Est. fire insurance / yr
- $713 – $1,323
Heat risk 3/10 · Minor
- Hot days now (above 100°F)
- 7 days/yr
- Hot days in 30 yrs
- 16 days/yr
Wind risk 2/10 · Minimal
- Chance of severe wind over 30 yrs
- —
Air-quality risk 2/10 · Minimal
- Unhealthy air days now
- 1 days/yr
- Unhealthy air days in 30 yrs
- 2 days/yr
Risk factors via First Street. Map © Google.
Why this score? — see what drove the C+ grade
The composite is a weighted blend of 9 inputs, each scored 0–100. Each bar is that input's sub-score; the figure is the points it added to the 100-point composite (weight × sub-score).
- Cash flow +30.0/30.0
- DSCR +10.0/10.0
- 1% rule +9.7/10.0
- Rent growth +3.8/5.0
- Livability +3.3/5.0
- Condition / age +2.5/5.0
- ARV discount +1.7/15.0
- Schools +1.6/10.0
- Appreciation +0.0/10.0
$75,000
🖨 Deal sheet 📄 Offer letter ✓ Due diligence
Listing remarks MLS
Attention Investors! Listed at $75,000, this property presents a great opportunity for investors seeking steady cash flow. Currently rented at $975/month with the tenant responsible for all utilities. Showings are preferred after an accepted offer. Available individually or as part of a package with 4244 North Lockwood Ave and 1013 Clymena Street. No seller financing.
Key facts
- 4,000 sq ft lot
- Parking
- Built 1915
Neighborhood map
What this means for you Summary
Snapshot
- This is a 3-bed/1.0-bath single-family listed at $75k.
Deal economics
- At list price, monthly cash flow is $374 ($4k/yr) — positive.
- The deal already cash-flows at list — no discount required.
- Meets the 1% rule at list price ($1k rent vs $75k).
- Recommended offer: $66k (12.0% below list) — sets the bar for market timing.
- Cap rate 12.3% vs local median 7.6% in Toledo — top-decile yield for the area; either an underpriced asset or a hidden risk that comps aren't pricing in. Stress-test before assuming the spread holds.
Location & tenants
- Location reads 66/100 on livability (#645 in OH) — a middle-class / working-renter tenant base. Strengths: cost of living A+, housing A+, health & safety A+; Watch: amenities C-, schools D-, crime F.
- Toledo City (urban): math 15% / reading 24% proficiency, ranked #634 of 656 in OH (top 97%) — low school quality limits family demand, transient renter base, plan for 1-2y turnover; 72% free/reduced lunch — lower-income household profile, screen leases tightly.
- Market conditions: Rents rising fast (+5.4%/yr); 117 active listings in the ZIP; 38 comparable units currently listed for rent nearby; rentals at typical pace (median 24d on market — plan ~3-4 weeks tenant-placement turnaround); 42% of comp listings sitting > 30 days — soft ceiling on asking rent; lower-income renter base — watch delinquency; 415 units permitted in Lucas County in 2024 (122 in 5+ unit buildings).
- This rent runs 34% of the median local income ($39k/yr) — at the standard rent-burdened threshold; future hikes will face affordability resistance.
Forward outlook
- Local home prices are declining (-3.0%/yr); year-one equity from $519 of loan paydown is wiped out by about $2k of value loss. Plan a longer hold.
- Lucas County population projected at -16% by 2050 — secular population decline; favor cash flow + early exit over multi-decade hold.
- At projected returns (-3.0% appreciation + 5.4% rent growth), your $21k cash investment doubles in ~6 years — after that, you're playing with house money.
Negotiation context
- It's been on market 143 days — a 12% lower offer ($66k) is reasonable based on typical stale-listing flexibility.
- 4 sale attempts since 2y ago; this cycle's ask has dropped $10k (12%) from the opening price — seller is motivated, your offer sets the floor, not the list.
Risks & watch-outs
- Watch-outs: built in 1915 — expect roof / HVAC / electrical / plumbing capex.
Questions for the listing agent
- It's been on market 143 days. Have you received any prior offers? Is the seller open to a 12% concession, seller financing, or rate buy-down credit?
- Built in 1915 — when were the roof, HVAC, electrical panel, plumbing, and water heater last replaced?
- Why hasn't it sold? Are there any deal-killer items the seller is aware of (foundation, flood, title, zoning, code violations)?
- Is there a deadline driving the sale (1031 exchange, divorce, estate, relocation)? That informs how much negotiation room exists.
- Schools are D-rated, which usually means shorter tenancies and higher turnover. Who's the typical renter profile here, and what's been the actual vacancy rate?
- Crime grade is F in this area — have there been break-ins, vandalism, or insurance claims at this property in the last 3 years? What carrier currently insures it and at what premium?
- What's the average days-on-market for RENTAL listings here right now (not sales)? A rising rental-DOM trend means longer vacancies and softer asking-rent achievability than the comps imply.
- What's the recent tenant-quality profile in this submarket — average credit score on applications, eviction rate, late-payment / NSF rate, and stable-employment percentage? A property-management company in the area should have these aggregated.
- How much new for-sale + rental construction is in the pipeline within 1–3 miles? Heavy new supply typically softens prices + rents 12–24 months out; constrained supply supports both.
Investment metrics
- 1% rule
- 1.47% ✓
- Cap rate
- 12.28%
- Cash-on-cash
- 21.37%
- DSCR
- 1.95
- GRM
- 5.7
CMA / ARV
- ARV (median comp)
- $66,487
- List price
- $75,000
- Delta
- 12.80%
- Verdict
- OVERPRICED
- Comps
- 20 within 1.0 mi
Show comp detail 12 sales within ~0.75 mi
| Address | Dist | Beds/Ba | Sqft | Sold | Price | $/sf | Match |
|---|---|---|---|---|---|---|---|
| 429 Dover Pl | 0.05mi | 3/1.0 | 1,155 (-4%) | 6mo | $66,000 | $57 | 87 |
| 1940 Hurd St | 0.33mi | 3/1.0 | 1,200 (+0%) | 4mo | $99,900 | $83 | 82 |
| 2017 Kelsey Ave | 0.24mi | 3/1.0 | 1,152 (-4%) | 1mo | $119,900 | $104 | 81 |
| 2003 Idaho St | 0.33mi | 3/1.0 | 1,172 (-2%) | 5mo | $120,000 | $102 | 77 |
| 256 Midvale Ave | 0.37mi | 3/1.0 | 1,180 (-2%) | 4mo | $137,300 | $116 | 77 |
| 590 Sylvandale Ave | 0.51mi | 3/1.0 | 1,193 (-0%) | 4mo | $180,000 | $151 | 72 |
| 1130 Earlwood Ave | 0.59mi | 3/1.5 | 1,191 (-1%) | 1mo | $185,000 | $155 | 69 |
| 463 Howland Ave | 0.25mi | 3/1.0 | 1,027 (-14%) | 4mo | $65,000 | $63 | 61 |
| 444 Raymer Blvd | 0.52mi | 2/1.5 (-1) | 1,283 (+7%) | 5mo | $90,000 | $70 | 53 |
| 130 Burger St | 0.74mi | 2/2.0 (-1) | 1,242 (+4%) | 3mo | $134,000 | $108 | 48 |
| 2601 Randall Dr | 0.70mi | 2/1.5 (-1) | 1,308 (+9%) | 6mo | $210,700 | $161 | 40 |
| 1133 Nevada St | 0.72mi | 2/1.0 (-1) | 1,044 (-13%) | 4mo | $36,000 | $34 | 37 |
Match score weights: distance 35% · size 25% · config 20% · recency 20%. Top-matched comps best support the ARV.
Projected returns pro-forma
-3.0% appreciation · 5.37% rent growth · sell at horizon
- IRR
- 16.5%
- Equity multiple
- 1.68×
- Total profit
- $14,368
- Equity at exit
- $11,183
- IRR
- 26.7%
- Equity multiple
- 3.61×
- Total profit
- $54,818
- Equity at exit
- $6,485
Cash invested: $21,000 (down + closing). Projections, not guarantees.
Landlord ↔ Tenant lean methodology
- Overall (STATE)
- 73 Landlord-Friendly
- State Ohio
- 73 Landlord-Friendly · R+6
- County
- — inherits STATE
- City
- — inherits STATE
ZIP-level market 43605
- Home prices YoY
- -25.6%
- Rents YoY
- 5.4%
- Active inventory
- 117
- Price-to-rent
- 5.7×
Monthly cashflow live
- Estimated rent
- $1,105 high interval (Pro) →
- Mortgage (P&I)
- −$393
- Tax from tax record
- −$74 /mo · $889/yr
- Insurance
- −$31
- HOA
- −$0
- Vacancy / Maint / Mgmt
- −$232
- Net cashflow
- $374
Break-even live
UW: 25.0% down · 7.5% · 30yr · 1.5% tax · 5.0% vac · 8.0% maint · 8.0% mgmt
Financing live
Cash to close
- Down payment
- $18,750
- Closing costs
- $2,250
- Reserves months
- —
- Total cash needed
- —
Loan-product check · same deal, 3 products live
Conventional
25% down · 7.5% · 30yr
- Down + closing
- —
- Monthly P&I
- —
- Monthly cashflow
- —
- DSCR
- —
- Eligible?
- —
Personal DTI + credit; lowest rate.
DSCR
20% down · 8.5% · 30yr
- Down + closing
- —
- Monthly P&I
- —
- Monthly cashflow
- —
- DSCR
- —
- Eligible?
- —
No personal income docs; deal must DSCR.
Hard money
10% down · 12.0% · 12mo
- Down + closing
- —
- Monthly P&I
- —
- Monthly cashflow
- —
- DSCR
- —
- Eligible?
- —
Short-term bridge; refi at stabilization.
Rent comps 38 comps
| Address | Beds | Baths | Sqft | Rent | $/sqft | DOM | Units | Dist |
|---|---|---|---|---|---|---|---|---|
| 2074 Starr Ave Toledo, OH | 3.0 | 1.0 | 1115 | $1,025 | $0.92 | 23d | 1 | 0.04mi |
| 2129 Nevada St Toledo, OH | 3.0 | 1.0 | 1352 | $1,200 | $0.89 | 14d | 1 | 0.23mi |
| 508 Howland Ave Toledo, OH | 3.0 | 1.0 | 840 | $1,000 | $1.19 | 43d | 1 | 0.29mi |
| 571 Howland Ave Toledo, OH | 2.0 | 1.0 | 874 | $875 | $1.00 | 43d | 1 | 0.31mi |
| 722 Coyne Ave Toledo, OH | 2.0 | 1.0 | 900 | $1,000 | $1.11 | 14d | 1 | 0.38mi |
| 732 Coyne Ave Toledo, OH | 3.0 | 1.0 | 968 | $1,145 | $1.18 | 14d | 1 | 0.40mi |
| 1614 Nevada St Toledo, OH | 2.0 | 1.0 | 1172 | $1,000 | $0.85 | 21d | 1 | 0.46mi |
| 557 Valleywood Dr Toledo, OH | 3.0 | 1.0 | 848 | $1,100 | $1.30 | 43d | 1 | 0.46mi |
| 223 Valleywood Dr Toledo, OH | 2.0 | 1.0 | 1098 | $1,099 | $1.00 | 23d | 1 | 0.54mi |
| 1505 Navarre Ave Toledo, OH | 3.0 | 1.0 | 1331 | $1,145 | $0.86 | 43d | 1 | 0.66mi |
| 1123 Nevada St Toledo, OH | 2.0 | 1.0 | 792 | $900 | $1.14 | 14d | 1 | 0.73mi |
| 724 Plymouth St Toledo, OH | 2.0 | 1.0 | 819 | $750 | $0.92 | 43d | 1 | 0.75mi |
| 948 White St Toledo, OH | 3.0 | 1.0 | 1024 | $1,135 | $1.11 | 14d | 1 | 0.80mi |
| 653 Oswald St Toledo, OH | 2.0 | 1.0 | 920 | $800 | $0.87 | 43d | 1 | 0.84mi |
| 1106 White St Toledo, OH | 3.0 | 1.0 | 1200 | $1,015 | $0.85 | 14d | 1 | 0.87mi |
| 221 Licking St Unit 2 Toledo, OH | 3.0 | 1.0 | 1048 | $1,099 | $1.05 | 23d | 1 | 0.89mi |
| 1306 Mott Ave Toledo, OH | 3.0 | 1.5 | 1282 | $1,149 | $0.90 | 43d | 1 | 0.94mi |
| 1305 Mott Ave Toledo, OH | 3.0 | 1.0 | 1080 | $1,000 | $0.93 | 43d | 1 | 0.96mi |
| 128 Carbon St Toledo, OH | 3.0 | 1.0 | 1113 | $1,200 | $1.08 | 23d | 1 | 1.00mi |
| 420 Platt St Toledo, OH | 2.0 | 1.0 | 1499 | $685 | $0.46 | 21d | 1 | 1.04mi |
| 29 Garfield Pl Toledo, OH | 4.0 | 2.0 | 1300 | $1,250 | $0.96 | 14d | 1 | 1.04mi |
| 414 Platt St Unit ST-3 Toledo, OH | 3.0 | 1.0 | 1500 | $1,150 | $0.77 | 23d | 1 | 1.04mi |
| 1848 Genesee St Toledo, OH | 3.0 | 1.0 | 1069 | $1,200 | $1.12 | 43d | 1 | 1.04mi |
| 1848 Genesee St Toledo, OH | 3.0 | 1.0 | 1069 | $1,300 | $1.22 | 23d | 1 | 1.04mi |
| 908 Forsythe St Unit Upstairs Toledo, OH | 2.0 | 1.0 | 1164 | $900 | $0.77 | 14d | 1 | 1.08mi |
| 908 Forsythe St Unit Downstairs Toledo, OH | 3.0 | 1.0 | 1164 | $950 | $0.82 | 43d | 1 | 1.08mi |
| 1964 Burr St Toledo, OH | 3.0 | 1.0 | 1159 | $1,250 | $1.08 | 43d | 1 | 1.10mi |
| 921 Berry St Toledo, OH | 4.0 | 1.0 | 1204 | $1,350 | $1.12 | 14d | 1 | 1.13mi |
| 1103 S Wheeling St Oregon, OH | 2.0 | 1.0 | 825 | $1,049 | $1.27 | 43d | 1 | 1.14mi |
| 1205 Liberty St Unit NA Toledo, OH | 3.0 | 1.0 | 864 | $1,195 | $1.38 | 43d | 1 | 1.20mi |
| 470 2nd St Unit 1 Toledo, OH | 2.0 | 1.0 | 950 | $799 | $0.84 | 43d | 1 | 1.22mi |
| 537 Potter St Toledo, OH | 2.0 | 1.0 | 1200 | $625 | $0.52 | 23d | 1 | 1.26mi |
| 946 Butler St Toledo, OH | 2.0 | 1.0 | 944 | $650 | $0.69 | 43d | 1 | 1.33mi |
| 2750 Pickle Rd Oregon, OH | 2.0 | 1.0 | 800 | $1,434 | $1.79 | 23d | 1 | 1.39mi |
| 2750 Pickle Rd Oregon, OH | 2.0 | 1.0 | 800 | $953 | $1.19 | 14d | 1 | 1.39mi |
| 625 Riverside Dr Toledo, OH | 1.0–2.0 | 1.0–2.0 | 860 | $1,767 | $2.05 | 14d | 37 | 1.42mi |
| 834 Oak St Toledo, OH | 3.0 | 1.0 | 1064 | $900 | $0.85 | 43d | 1 | 1.43mi |
| 1537 Carlyle St Toledo, OH | 2.0 | 1.0 | 800 | $800 | $1.00 | 23d | 1 | 1.49mi |
Listing history 25 events
-
2026-06-18days on market $75,000 Active 143 DOM
-
2026-06-17days on market $75,000 Active 142 DOM
-
2026-06-16days on market $75,000 Active 141 DOM
-
2026-06-15days on market $75,000 Active 140 DOM
-
2026-06-14days on market $75,000 Active 138 DOM
-
2026-06-10days on market $75,000 Active 135 DOM
-
2026-06-09days on market $75,000 Active 134 DOM
-
2026-06-08days on market $75,000 Active 133 DOM
-
2026-06-07days on market $75,000 Active 132 DOM
-
2026-06-05days on market $75,000 Active 129 DOM
-
2026-06-03days on market $75,000 Active 128 DOM
-
2026-06-02days on market $75,000 Active 127 DOM
-
2026-06-01days on market $75,000 Active 126 DOM
-
2026-05-31days on market $75,000 Active 125 DOM
-
2026-05-30days on market $75,000 Active 124 DOM
-
2026-05-05price $75,000 370-char remark
Show marketing remark (370 chars)
Attention Investors! Listed at $75,000, this property presents a great opportunity for investors seeking steady cash flow. Currently rented at $975/month with the tenant responsible for all utilities. Showings are preferred after an accepted offer. Available individually or as part of a package with 4244 North Lockwood Ave and 1013 Clymena Street. No seller financing.
-
2026-01-26$84,900 Active 370-char remark
Show marketing remark (370 chars)
Attention Investors! Listed at $75,000, this property presents a great opportunity for investors seeking steady cash flow. Currently rented at $975/month with the tenant responsible for all utilities. Showings are preferred after an accepted offer. Available individually or as part of a package with 4244 North Lockwood Ave and 1013 Clymena Street. No seller financing.
-
2025-10-16status Active
-
2025-09-18status Pending
-
2025-09-17historical
-
2025-06-24$84,900 Active
-
2024-11-30historical
-
2024-05-06$84,900 Active
-
2022-12-05soldstatus $67,900
-
2019-01-16soldstatus $422,000
ⓘ Source: listings_history table (triggers on properties + properties_extension) + one-shot
backfill from property_details.listing_events for pre-trigger history.
Tax reassessment forecast OH · Partial reset (capped growth)
- Current annual tax
- $889 · $74/mo
- Projected year-2 tax
- $1,030 · $86/mo
- Expected delta
- +$140/yr (+$12/mo · 15.8%)
ⓘ Screening estimate from a state-policy table — verify with the county assessor before closing.
Climate risk First Street
- Flood 1/10 Low FEMA zone X (unshaded) · 0% chance over 30 yrs
- Wildfire 1/10 Low
- Heat 3/10 Moderate 7 d/yr ≥100°F today · 16 d/yr by 30 yrs out
- Wind 2/10 Low
- Air quality 2/10 Low 1 unhealthy d/yr today · 2 by 30 yrs out
Nearby sold comps map
Loading sold comps map…
Walkable amenities ~0.75 mi
Loading nearby amenities…
Taxation est. · year 1
- Rental income
- $13,256
- − Mortgage interest
- −$4,201
- − Property taxes
- −$889
- − Insurance
- −$375
- − Repairs & maintenance
- −$1,060
- − Management
- −$1,060
- − Depreciation
- −$2,182
- Taxable income
- $3,488
- Est. tax owed @ 24.0%
- −$837
- After-tax cash flow
- $3,651/yr
For passive investors: Depreciation is non-cash, so a rental often shows a tax loss while cash-flowing — sheltering income. Rental losses are passive: they offset passive income freely, and up to $25,000/yr can offset ordinary (W-2) income if you actively participate and your MAGI is under $100k (phasing out to $0 by $150k); unused losses carry forward. On sale, claimed depreciation is recaptured at up to 25%, and gains may owe capital-gains tax (a 1031 exchange can defer both). Figures are a year-1 estimate at your 24.0% rate — not tax advice; consult a CPA.
Schools (NCES district)
- District
- Toledo City
- NCES district ID
- 3904490
- Math proficiency
- 15% ▼ -16.00%
- Reading proficiency
- 24% ▼ -13.00%
- Median HH income
- $32,137
- Composite
- 15.76/100
- National rank
- #9276
- State rank
- #634 of 656 in OH
Livability — Toledo
- Score
- 66/100
- State rank
- #645
- US rank
- #11442
Category grades
Schools grade is shown separately in the Schools card above.
Census & demographics
- Census place
- Toledo, OH
- County
- Lucas County · 380,724 people
- City population
- 280,811
- Metro
- Toledo, OH
- Population (ZIP)
- 24,441
- Household income
- $39,118
- Rent vs Own
- Severe rent burden
- 1257.0
Population outlook (Lucas County) Hauer SSP2
- Today (2025)
- 420,751 people
- By 2030
- 410,187 · -2.5%
- By 2040
- 384,019 · -8.7%
- By 2050
- 355,125 · -15.6%
- By 2075
- 291,683 · -30.7%
- By 2100
- 233,670 · -44.5%
Race, ethnicity, and origin ACS 2023
- Neighborhood character
- Diverse neighborhood (Simpson 0.61)
- Race & ethnicity
- White 57% Hispanic / Latino 21% Black 14% Two or more races 14%
- Hispanic origin (detail)
- Mexican 17% Puerto Rican 2%
- Common ancestry
- Romanian 3% Lithuanian 2% Portuguese 1%
- Foreign-born
- 3% · Canada
- Languages at home
- 91% English-only · Spanish 7% Arabic 1%
Political lean MEDSL · Lucas
- 2024 margin
- D (+12.6) · D 55.8% · R 43.2%
- 2008→2024 swing
- -18.9pp toward R · 2008: 31.4pp · 2024: 12.6pp
- All cycles
- 2024: D+12.6 2020: D+16.8 2016: D+17.4 2012: D+30.4 2008: D+31.4
Not yet ingested
- Civics
- —
Market trends
- HPI YoY
- ▼ -47.85%
- Current HPI
- 138.6894
- Rent YoY
- ▲ 5.37%
- Metro
- Toledo, OH
- State GDP YoY
- ▲ 1.98%
- F500 in state
- 48
Industry mix (Fortune 500 HQ in OH)
| Industry | F500 HQs | Revenue |
|---|---|---|
| Insurance | 3 | $145B |
|
||
| Industrial Machinery | 3 | $49B |
|
||
| Financial Services | 3 | $24B |
|
||
| Consumer Goods | 2 | $93B |
|
||
| Aerospace / Defense | 2 | $47B |
|
||
| Utilities | 2 | $33B |
|
||
Price history
-82.2% since first listed10 events — show timeline
- 2026-05-05 Price Changed $75,000 NORIS
- 2026-01-26 Listed $84,900 NORIS
- 2025-10-16 Relisted — NORIS
- 2025-09-18 Pending — NORIS
- 2025-09-17 Listing Removed — NORIS
- 2025-06-24 Listed $84,900 NORIS
- 2024-11-30 Listing Removed — NORIS
- 2024-05-06 Listed $84,900 NORIS
- 2022-12-05 Sold (Public Records) $67,900 Public Records
- 2019-01-16 Sold (Public Records) $422,000 Public Records
Property tax history
+3.3%/yrLatest (2025): $889 · +15.3% YoY. Source: county tax records.
Cash-flow waterfall
monthlySold comps — $/sqft
last 12 mo · ≤1 miLoading sold comps…