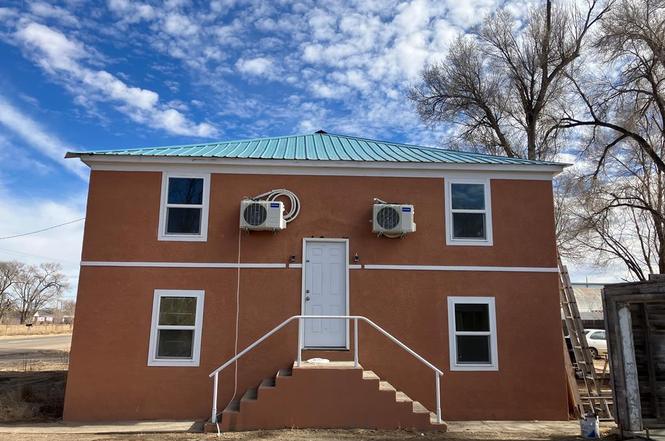
 Fourplex
18902 Hwy 50 · Rocky Ford, CO
Flood risk 3/10 · Minor
- FEMA flood zone
- X
- Chance of flooding over 30 yrs
- 0.2%
- Est. flood insurance / yr
- $507 – $1,088
Fire risk 5/10 · Moderate
- Est. fire insurance / yr
- $939 – $1,743
Heat risk 4/10 · Minor
- Hot days now (above 98°F)
- 6 days/yr
- Hot days in 30 yrs
- 17 days/yr
Wind risk 2/10 · Minimal
- Chance of severe wind over 30 yrs
- —
Air-quality risk 2/10 · Minimal
- Unhealthy air days now
- 1 days/yr
- Unhealthy air days in 30 yrs
- 1 days/yr
Risk factors via First Street. Map © Google.
Why this score? — see what drove the B- grade
The composite is a weighted blend of 9 inputs, each scored 0–100. Each bar is that input's sub-score; the figure is the points it added to the 100-point composite (weight × sub-score).
- Cash flow +28.6/30.0
- DSCR +10.0/10.0
- 1% rule +7.9/10.0
- ARV discount +7.5/15.0
- Livability +3.9/5.0
- Rent growth +2.5/5.0
- Condition / age +2.5/5.0
- Schools +2.4/10.0
- Appreciation +0.0/10.0
$239,000
🖨 Deal sheet (PDF) 📄 Offer letter ✓ Due diligence
Multi-family units
County records classify this as Multi-Family (2-4 Unit). Listing-text estimate: 4 units. confirmed
Listing remarks
Here is one for the investors! A 4-plex that has been totally remodeled! This property is located close to downtown Rocky Ford. Driving distance to many of the surrounding towns is only 10-15 minutes. It has 4 one bed/1 bath units. Also, there is possible garage covering (entrance approximately 8' wide, depth approximately 17')for 4 vehicles that are on the smaller side, or these garage areas can be used for storage. With rentals in high demand, you wont want to pass this up!
Key facts
- Totally remodeled
- 0.55 acre lot
- Built 1909
Tags
Property features AI
Finance
- Other: Zoning: C-1
- HOA & community: No association amenities
Exterior
- Utilities: Public water; Public sewer
- Home design: Residential income property — quadruplex (fourplex); 2 stories
- Construction: Frame and stucco construction; Metal roof
- Exterior features: Irregular lot
Interior
- Kitchen: Electric range
- Bedrooms: Four 1-bedroom units (each currently vacant)
- Bathrooms: 4 full bathrooms
- Heating & cooling: Baseboard electric heating
- Interior features: Double-pane windows; Electric range
- Laundry & utility: No on-site laundry indicated
Neighborhood map
What this means for you Summary
Snapshot
- This is a 4 × 1-bed/1.0-bath units multifamily listed at $239k.
Deal economics
- At list price, monthly cash flow is $790 ($9k/yr) — positive. Per door: $198/mo.
- The deal already cash-flows at list — no discount required.
- Meets the 1% rule at list price ($3k rent vs $239k).
- Recommended offer: $210k (12.0% below list) — sets the bar for market timing.
- Cap rate 10.3% vs local median 4.5% in Rocky Ford — top-decile yield for the area; either an underpriced asset or a hidden risk that comps aren't pricing in. Stress-test before assuming the spread holds.
Location & tenants
- Location reads 78/100 on livability (#22 in CO, #2,671 nationally) — a middle-class / working-renter tenant base. Strengths: crime A+, cost of living A+, health & safety A+; Watch: amenities D+, schools F, employment F.
- Rocky Ford School District No. R2 (town): math 24% / reading 36% proficiency, ranked #58 of 86 in CO (top 67%) — families likely to look elsewhere, expect single-tenant / working-renter base with shorter leases; 67% free/reduced lunch — lower-income household profile, screen leases tightly.
- Market conditions: 41 active listings in the ZIP; 11 units permitted in Otero County in 2024 (0 in 5+ unit buildings).
Forward outlook
- Local home prices are declining (-3.0%/yr); year-one equity from $2k of loan paydown is wiped out by about $7k of value loss. Plan a longer hold.
- Otero County population projected at -17% by 2050 — secular population decline; favor cash flow + early exit over multi-decade hold.
- At projected returns (-3.0% appreciation + 3.0% rent growth), your $67k cash investment doubles in ~9 years — after that, you're playing with house money.
Negotiation context
- It's been on market 206 days — a 12% lower offer ($210k) is reasonable based on typical stale-listing flexibility.
- 3 sale attempts since 2y ago; this cycle's ask has dropped $40k (14%) from the opening price — seller is motivated, your offer sets the floor, not the list.
Risks & watch-outs
- Watch-outs: built in 1909 — expect roof / HVAC / electrical / plumbing capex.
- Climate carrying-cost: moderate wildfire risk — expect insurance premiums to compound above CPI over the hold.
Questions for the listing agent
- It's been on market 206 days. Have you received any prior offers? Is the seller open to a 12% concession, seller financing, or rate buy-down credit?
- Can we see the unit-by-unit rent roll, current vacancy, and any below-market leases? What's the average tenancy length?
- What capital expenditures (roof, boiler, parking lot, exteriors) have been made in the last 5 years, and what's planned in the next 2?
- Built in 1909 — when were the roof, HVAC, electrical panel, plumbing, and water heater last replaced?
- Why hasn't it sold? Are there any deal-killer items the seller is aware of (foundation, flood, title, zoning, code violations)?
- Is there a deadline driving the sale (1031 exchange, divorce, estate, relocation)? That informs how much negotiation room exists.
- Schools are F-rated, which usually means shorter tenancies and higher turnover. Who's the typical renter profile here, and what's been the actual vacancy rate?
- What's the average days-on-market for RENTAL listings here right now (not sales)? A rising rental-DOM trend means longer vacancies and softer asking-rent achievability than the comps imply.
- What's the recent tenant-quality profile in this submarket — average credit score on applications, eviction rate, late-payment / NSF rate, and stable-employment percentage? A property-management company in the area should have these aggregated.
- How much new apartment / multifamily construction is in the pipeline within 1–3 miles? Heavy new supply (>2% of stock underway) typically softens rents 12–24 months out; light construction supports rent growth.
Investment metrics
- 1% rule
- 1.29% ✓
- Cap rate
- 10.26%
- Cash-on-cash
- 14.17%
- DSCR
- 1.63
- GRM
- 6.4
CMA / ARV
No comps found within radius.
Projected returns pro-forma
-3.0% appreciation · 3.0% rent growth · sell at horizon
- IRR
- 4.5%
- Equity multiple
- 1.17×
- Total profit
- $11,648
- Equity at exit
- $35,636
- IRR
- 14.0%
- Equity multiple
- 2.12×
- Total profit
- $75,139
- Equity at exit
- $20,664
Cash invested: $66,920 (down + closing). Projections, not guarantees.
Landlord ↔ Tenant lean methodology
- Overall (STATE)
- 38 Tenant-Leaning
- State Colorado
- 38 Tenant-Leaning · D+4
- County
- — inherits STATE
- City
- — inherits STATE
ZIP-level market 81067
- Home prices YoY
- -25.2%
- Active inventory
- 41
- Price-to-rent
- 25.8×
Monthly cashflow live
- Estimated rent
- $3,091 medium interval (Pro) →
- Mortgage (P&I)
- −$1,253
- Tax est. 1.5%
- −$299 /mo · $3,585/yr
- Insurance
- −$100
- HOA
- −$0
- Vacancy / Maint / Mgmt
- −$649
- Net cashflow
- $790
Break-even live
Sensitivity live
| Price | -10% $955 | -5% $873 | +0% $790 | +5% $708 | +10% $625 |
|---|---|---|---|---|---|
| Rent | -10% $546 | -5% $668 | +0% $790 | +5% $912 | +10% $1,034 |
| Rate | -1.0pp $911 | -0.5pp $851 | base $790 | +0.5pp $728 | +1.0pp $665 |
4-unit breakdown (identical units grouped — click to expand)
| Units | Beds | Baths | Est. rent |
|---|---|---|---|
| 4× units | 1 | 1 | $3,092 |
| #1 | 1 | 1 | $773 |
| #2 | 1 | 1 | $773 |
| #3 | 1 | 1 | $773 |
| #4 | 1 | 1 | $773 |
| Total (4 units) | $3,091 | ||
UW: 25.0% down · 7.5% · 30yr · 1.5% tax · 5.0% vac · 8.0% maint · 8.0% mgmt
Financing live
Cash to close
- Down payment
- $59,750
- Closing costs
- $7,170
- Reserves months
- —
- Total cash needed
- —
Loan-product check · same deal, 3 products live
Conventional
25% down · 7.5% · 30yr
- Down + closing
- —
- Monthly P&I
- —
- Monthly cashflow
- —
- DSCR
- —
- Eligible?
- —
Personal DTI + credit; lowest rate.
DSCR
20% down · 8.5% · 30yr
- Down + closing
- —
- Monthly P&I
- —
- Monthly cashflow
- —
- DSCR
- —
- Eligible?
- —
No personal income docs; deal must DSCR.
Hard money
10% down · 12.0% · 12mo
- Down + closing
- —
- Monthly P&I
- —
- Monthly cashflow
- —
- DSCR
- —
- Eligible?
- —
Short-term bridge; refi at stabilization.
Listing history 21 events
-
2026-06-21days on market $239,000 Active 206 DOM
-
2026-06-18days on market $239,000 Active 204 DOM
-
2026-06-17days on market $239,000 Active 203 DOM
-
2026-06-16days on market $239,000 Active 202 DOM
-
2026-06-15days on market $239,000 Active 201 DOM
-
2026-06-13days on market $239,000 Active 199 DOM
-
2026-06-12days on market $239,000 Active 198 DOM
-
2026-06-09days on market $239,000 Active 195 DOM
-
2026-06-08days on market $239,000 Active 194 DOM
-
2026-06-07days on market $239,000 Active 193 DOM
-
2026-06-07days on market $239,000 Active 192 DOM
-
2026-06-04days on market $239,000 Active 189 DOM
-
2026-06-02days on market $239,000 Active 188 DOM
-
2026-06-01days on market $239,000 Active 187 DOM
-
2026-05-31days on market $239,000 Active 186 DOM
-
2026-05-31days on market $239,000 Active 185 DOM
-
2026-05-04price $239,000
-
2026-05-04status Active
-
2026-04-22historical Active Under Contract
-
2025-11-27$279,000 Active
-
2024-02-14$329,000 Active
ⓘ Source: listings_history table (triggers on properties + properties_extension) + one-shot
backfill from property_details.listing_events for pre-trigger history.
Climate risk First Street
- Flood 3/10 Moderate FEMA zone X · 20% chance over 30 yrs
- Wildfire 5/10 Major
- Heat 4/10 Moderate 6 d/yr ≥98°F today · 17 d/yr by 30 yrs out
- Wind 2/10 Low
- Air quality 2/10 Low 1 unhealthy d/yr today · 1 by 30 yrs out
Nearby sold comps map
Loading sold comps map…
Walkable amenities ~0.75 mi
Loading nearby amenities…
Taxation est. · year 1
- Rental income
- $37,092
- − Mortgage interest
- −$13,388
- − Property taxes
- −$3,585
- − Insurance
- −$1,195
- − Repairs & maintenance
- −$2,967
- − Management
- −$2,967
- − Depreciation
- −$6,953
- Taxable income
- $6,037
- Est. tax owed @ 24.0%
- −$1,449
- After-tax cash flow
- $8,034/yr
For passive investors: Depreciation is non-cash, so a rental often shows a tax loss while cash-flowing — sheltering income. Rental losses are passive: they offset passive income freely, and up to $25,000/yr can offset ordinary (W-2) income if you actively participate and your MAGI is under $100k (phasing out to $0 by $150k); unused losses carry forward. On sale, claimed depreciation is recaptured at up to 25%, and gains may owe capital-gains tax (a 1031 exchange can defer both). Figures are a year-1 estimate at your 24.0% rate — not tax advice; consult a CPA.
Schools (NCES district)
- District
- Rocky Ford School District No. R2
- NCES district ID
- 0806270
- Math proficiency
- 24% ▲ 2.00%
- Reading proficiency
- 36% ▼ -3.00%
- Median HH income
- $31,077
- Composite
- 24.35/100
- National rank
- #7694
- State rank
- #58 of 86 in CO
Livability — Rocky Ford
- Score
- 78/100
- State rank
- #22
- US rank
- #2671
Category grades
Schools grade is shown separately in the Schools card above.
Census & demographics
- Population (ZIP)
- 5,590
Population outlook (Otero County) Hauer SSP2
- Today (2025)
- 17,363 people
- By 2030
- 16,776 · -3.4%
- By 2040
- 15,534 · -10.5%
- By 2050
- 14,467 · -16.7%
- By 2075
- 12,054 · -30.6%
- By 2100
- 9,392 · -45.9%
Race, ethnicity, and origin ACS 2023
- Neighborhood character
- Majority Hispanic (56%)
- Race & ethnicity
- Hispanic / Latino 56% White 40% Two or more races 22%
- Hispanic origin (detail)
- Mexican 45%
- Common ancestry
- Iranian 1% Italian 1% Slovak 1%
- Foreign-born
- 4% · Canada, South Korea
- Languages at home
- 82% English-only · Spanish 17%
Political lean MEDSL · Otero
- 2024 margin
- Strong R (+26.4) · D 35.5% · R 61.9% · Other 2.7%
- 2008→2024 swing
- -15.9pp toward R · 2008: -10.5pp · 2024: -26.4pp
- All cycles
- 2024: R+26.4 2020: R+22.5 2016: R+25.2 2012: R+9.3 2008: R+10.5
Not yet ingested
- Civics
- —
Market trends
- HPI YoY
- ▼ -72.32%
- Current HPI
- 214.2931
- Rent YoY
- —
- Metro
- —
- State GDP YoY
- ▲ 1.95%
- F500 in state
- 14
Industry mix (Fortune 500 HQ in CO)
| Industry | F500 HQs | Revenue |
|---|---|---|
| Technology Distribution | 1 | $31B |
|
||
| Food / Agriculture | 1 | $18B |
|
||
| Packaging | 1 | $14B |
|
||
| Healthcare | 1 | $13B |
|
||
| Energy | 1 | $10B |
|
||
| Technology | 1 | $4B |
|
||
Price history
-27.4% since first listed5 events — show timeline
- 2026-05-04 Price Changed $239,000 PARMLS
- 2026-05-04 Relisted — PARMLS
- 2026-04-22 Contingent — PARMLS
- 2025-11-27 Listed $279,000 PARMLS
- 2024-02-14 Listed $329,000 PARMLS
Cash-flow waterfall
monthlySold comps — $/sqft
last 12 mo · ≤1 miLoading sold comps…