 🏷️ Likely Rental
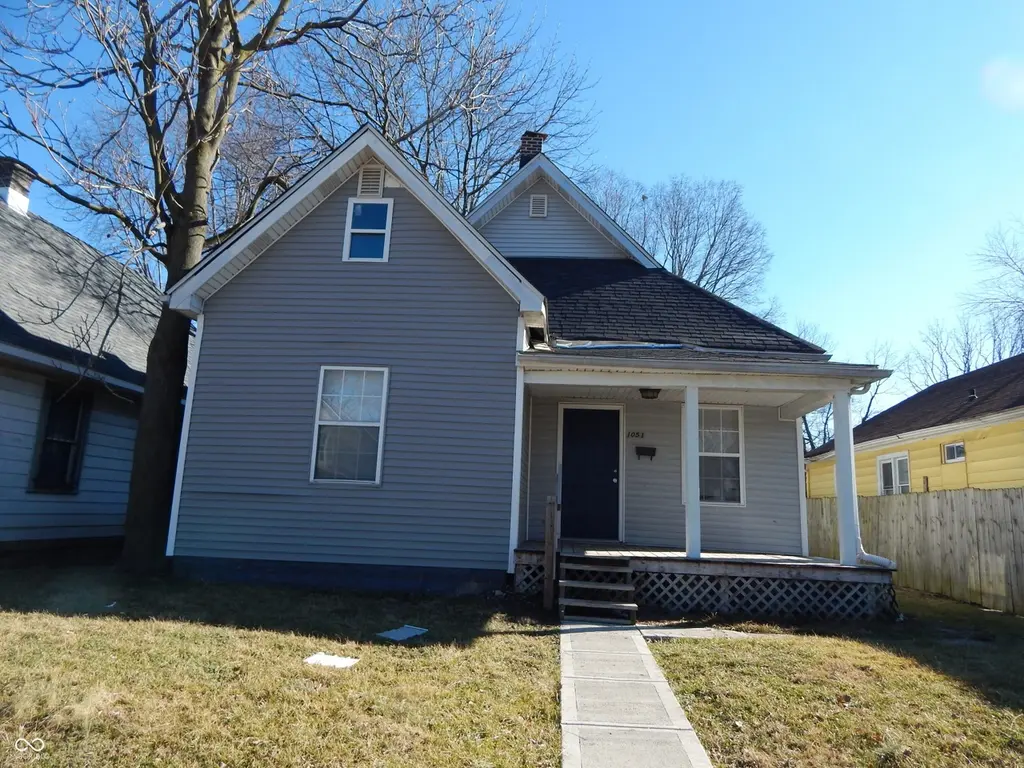
1051 N Holmes Ave · Indianapolis city (balance), IN
Flood risk 1/10 · Minimal
- FEMA flood zone
- X (unshaded)
- Chance of flooding over 30 yrs
- 0.0%
- Est. flood insurance / yr
- $473 – $860
Fire risk 1/10 · Minimal
- Est. fire insurance / yr
- $717 – $1,331
Heat risk 4/10 · Minor
- Hot days now (above 102°F)
- 7 days/yr
- Hot days in 30 yrs
- 19 days/yr
Wind risk 2/10 · Minimal
- Chance of severe wind over 30 yrs
- 0.0%
Air-quality risk 4/10 · Minor
- Unhealthy air days now
- 5 days/yr
- Unhealthy air days in 30 yrs
- 7 days/yr
Risk factors via First Street. Map © Google.
Why this score? — see what drove the B- grade
The composite is a weighted blend of 9 inputs, each scored 0–100. Each bar is that input's sub-score; the figure is the points it added to the 100-point composite (weight × sub-score).
- Cash flow +25.8/30.0
- ARV discount +15.0/15.0
- DSCR +8.6/10.0
- 1% rule +8.0/10.0
- Rent growth +3.1/5.0
- Livability +2.5/5.0
- Condition / age +2.5/5.0
- Schools +1.4/10.0
- Appreciation +0.0/10.0
$119,900
🖨 Deal sheet 📄 Offer letter ✓ Due diligence
Listing remarks MLS
Excellent investment opportunity on Indy's Westside! Last rent was $985/month. Property needs some work but near parks and minutes from Speedway or Downtown! Additional 7 properties available from same seller/agent, also vacant, varying condition. Property is sold in Receivership - requires UNITED STATES DISTRICT COURT FOR THE SOUTHERN DISTRICT OF NEW YORK approval of contract prior to closing. Buyer to be responsible for all costs on the settlement statement except for Seller paid commissions and management fees. Please see the attached documents. The Seller Addendum must be executed and delivered with all Purchase Offers along with all disclosures and proof of funds. Property is sold as-is. Seller will not assume responsibility for any required repairs to the home to qualify for financing. Utilities are inactive and the home is winterized.
Key facts
- 5,750 sq ft lot
- Garage
- Built 1908
Neighborhood map
What this means for you Summary
Snapshot
- This is a 3-bed/1.0-bath single-family listed at $120k.
Deal economics
- At list price, monthly cash flow is $292 ($4k/yr) — positive.
- The deal already cash-flows at list — no discount required.
- Meets the 1% rule at list price ($2k rent vs $120k).
- Recommended offer: $106k (12.0% below list) — sets the bar for market timing.
- Cap rate 9.2% vs local median 4.4% in Indianapolis city (balance) — top-decile yield for the area; either an underpriced asset or a hidden risk that comps aren't pricing in. Stress-test before assuming the spread holds.
Location & tenants
- Location reads: area grade B — affects rentability + tenant quality, not the cash-flow math above.
- Indianapolis Public Schools (urban): math 14% / reading 20% proficiency, ranked #286 of 301 in IN (top 95%) — low school quality limits family demand, transient renter base, plan for 1-2y turnover; 77% free/reduced lunch — lower-income household profile, screen leases tightly.
- Market conditions: Rents rising (+2.5%/yr); 170 active listings in the ZIP; 27 comparable units currently listed for rent nearby; rentals at typical pace (median 22d on market — plan ~3-4 weeks tenant-placement turnaround); 1,906 units permitted in Marion County in 2024 (621 in 5+ unit buildings).
- This rent runs 37% of the median local income ($51k/yr) — at the standard rent-burdened threshold; future hikes will face affordability resistance.
Forward outlook
- Local home prices are declining (-3.0%/yr); year-one equity from $829 of loan paydown is wiped out by about $4k of value loss. Plan a longer hold.
- Marion County population projected at +18% by 2050 — long-run rental-demand tailwind backs the buy-and-hold thesis.
Negotiation context
- It's been on market 205 days — a 12% lower offer ($106k) is reasonable based on typical stale-listing flexibility.
- 6 sale attempts since 26y ago; this cycle's ask has dropped $10k (8%) from the opening price — seller is motivated, your offer sets the floor, not the list.
- Current owner paid $14k; list at $120k implies a 741% gain — meaningful room to come down on a strong offer.
Risks & watch-outs
- Watch-outs: property tax is 2.6% of price; built in 1908 — expect roof / HVAC / electrical / plumbing capex.
Questions for the listing agent
- It's been on market 205 days. Have you received any prior offers? Is the seller open to a 12% concession, seller financing, or rate buy-down credit?
- Built in 1908 — when were the roof, HVAC, electrical panel, plumbing, and water heater last replaced?
- Property tax is high relative to price — has the assessment been appealed recently, and will the sale trigger a re-assessment?
- Why hasn't it sold? Are there any deal-killer items the seller is aware of (foundation, flood, title, zoning, code violations)?
- Is there a deadline driving the sale (1031 exchange, divorce, estate, relocation)? That informs how much negotiation room exists.
- What's the average days-on-market for RENTAL listings here right now (not sales)? A rising rental-DOM trend means longer vacancies and softer asking-rent achievability than the comps imply.
- What's the recent tenant-quality profile in this submarket — average credit score on applications, eviction rate, late-payment / NSF rate, and stable-employment percentage? A property-management company in the area should have these aggregated.
- How much new for-sale + rental construction is in the pipeline within 1–3 miles? Heavy new supply typically softens prices + rents 12–24 months out; constrained supply supports both.
Investment metrics
- 1% rule
- 1.30% ✓
- Cap rate
- 9.21%
- Cash-on-cash
- 10.43%
- DSCR
- 1.46
- GRM
- 6.4
CMA / ARV
- ARV (median comp)
- $154,236
- List price
- $119,900
- Delta
- -22.26%
- Verdict
- UNDERPRICED
- Comps
- 20 within 1.0 mi
Show comp detail 12 sales within ~0.75 mi
| Address | Dist | Beds/Ba | Sqft | Sold | Price | $/sf | Match |
|---|---|---|---|---|---|---|---|
| 1137 Winfield Ave | 0.14mi | 3/2.0 | 1,560 (-9%) | 4mo | $195,000 | $125 | 72 |
| 1325 Sharon Ave | 0.30mi | 2/1.5 (-1) | 1,782 (+4%) | 2mo | $145,000 | $81 | 70 |
| 1152 Winfield Ave | 0.17mi | 3/2.0 | 1,560 (-9%) | 4mo | $195,000 | $125 | 70 |
| 1142 Sharon Ave | 0.21mi | 3/2.0 | 1,560 (-9%) | 4mo | $165,000 | $106 | 68 |
| 1148 Winfield Ave | 0.17mi | 3/2.0 | 1,560 (-9%) | 6mo | $195,000 | $125 | 68 |
| 1254 N Belmont Ave | 0.48mi | 3/2.0 | 1,728 (+1%) | 7mo | $200,000 | $116 | 66 |
| 745 N Pershing Ave | 0.41mi | 3/2.0 | 1,640 (-4%) | 6mo | $198,000 | $121 | 65 |
| 1425 Sharon Ave | 0.35mi | 2/1.0 (-1) | 1,611 (-6%) | 6mo | $108,000 | $67 | 64 |
| 1911 Sharon Ave | 0.71mi | 2/1.0 (-1) | 1,636 (-4%) | 1mo | $125,000 | $76 | 54 |
| 405 N Holmes Ave | 0.65mi | 2/1.5 (-1) | 1,920 (+12%) | 0mo | $69,900 | $36 | 42 |
| 417 N Goodlet Ave | 0.75mi | 3/2.5 | 1,896 (+11%) | 2mo | $187,000 | $99 | 39 |
| 1062 N Berwick Ave | 0.74mi | 4/1.0 (+1) | 1,886 (+10%) | 5mo | $133,000 | $71 | 39 |
Match score weights: distance 35% · size 25% · config 20% · recency 20%. Top-matched comps best support the ARV.
Projected returns pro-forma
-3.0% appreciation · 2.46% rent growth · sell at horizon
- IRR
- -1.3%
- Equity multiple
- 0.95×
- Total profit
- $-1,594
- Equity at exit
- $17,877
- IRR
- 7.8%
- Equity multiple
- 1.58×
- Total profit
- $19,497
- Equity at exit
- $10,367
Cash invested: $33,572 (down + closing). Projections, not guarantees.
Landlord ↔ Tenant lean methodology
- Overall (STATE)
- 90 Strongly Landlord-Friendly
- State Indiana
- 90 Strongly Landlord-Friendly · R+11
- County
- — inherits STATE
- City
- — inherits STATE
ZIP-level market 46222
- Home prices YoY
- -16.7%
- Rents YoY
- 2.5%
- Active inventory
- 170
- Price-to-rent
- 6.4×
Monthly cashflow live
- Estimated rent
- $1,560 high interval (Pro) →
- Mortgage (P&I)
- −$629
- Tax from tax record
- −$262 /mo · $3,144/yr
- Insurance
- −$50
- HOA
- −$0
- Vacancy / Maint / Mgmt
- −$328
- Net cashflow
- $292
Break-even live
UW: 25.0% down · 7.5% · 30yr · 1.5% tax · 5.0% vac · 8.0% maint · 8.0% mgmt
Financing live
Cash to close
- Down payment
- $29,975
- Closing costs
- $3,597
- Reserves months
- —
- Total cash needed
- —
Loan-product check · same deal, 3 products live
Conventional
25% down · 7.5% · 30yr
- Down + closing
- —
- Monthly P&I
- —
- Monthly cashflow
- —
- DSCR
- —
- Eligible?
- —
Personal DTI + credit; lowest rate.
DSCR
20% down · 8.5% · 30yr
- Down + closing
- —
- Monthly P&I
- —
- Monthly cashflow
- —
- DSCR
- —
- Eligible?
- —
No personal income docs; deal must DSCR.
Hard money
10% down · 12.0% · 12mo
- Down + closing
- —
- Monthly P&I
- —
- Monthly cashflow
- —
- DSCR
- —
- Eligible?
- —
Short-term bridge; refi at stabilization.
Rent comps 27 comps
| Address | Beds | Baths | Sqft | Rent | $/sqft | DOM | Units | Dist |
|---|---|---|---|---|---|---|---|---|
| 1118 King Ave Indianapolis, IN | 3.0 | 1.0 | 1560 | $1,299 | $0.83 | 16d | 1 | 0.09mi |
| 1023 N Pershing Ave Indianapolis, IN | 3.0 | 1.5 | 1182 | $1,350 | $1.14 | 24d | 1 | 0.31mi |
| 742 N Sheffield Ave Unit 1228636P Indianapolis, IN | 4.0 | 2.0 | 1851 | $3,472 | $1.88 | 2d | 1 | 0.44mi |
| 955 N Traub Ave Indianapolis, IN | 3.0 | 2.0 | 1300 | $1,449 | $1.11 | 44d | 1 | 0.52mi |
| 545 N Goodlet Ave Indianapolis, IN | 3.0 | 1.0 | 1664 | $1,250 | $0.75 | 24d | 1 | 0.57mi |
| 326 N Warman Ave Indianapolis, IN | 3.0 | 2.5 | 1804 | $2,150 | $1.19 | 2d | 1 | 0.77mi |
| 3531 Garden Ave Indianapolis, IN | 3.0 | 1.0 | 1264 | $1,200 | $0.95 | 24d | 1 | 0.81mi |
| 3531 Garden Ave Indianapolis, IN | 3.0 | 1.0 | 1264 | $1,200 | $0.95 | 44d | 1 | 0.81mi |
| 2952 W New York St Indianapolis, IN | 2.0 | 2.5 | 1867 | $2,000 | $1.07 | 22d | 1 | 0.82mi |
| 2952 W New York St Indianapolis, IN | 2.0 | 2.5 | 1882 | $2,000 | $1.06 | 2d | 1 | 0.82mi |
| 264 N Holmes Ave Indianapolis, IN | 2.0 | 1.0 | 1092 | $1,200 | $1.10 | 11d | 1 | 0.85mi |
| 264 N Holmes Ave Indianapolis, IN | 2.0 | 1.0 | 1540 | $1,199 | $0.78 | 24d | 1 | 0.85mi |
| 240 N Warman Ave Indianapolis, IN | 2.0–3.0 | 1.0–2.0 | 1052 | $1,400 | $1.33 | 20d | 5 | 0.89mi |
| 261 N Pershing Ave Indianapolis, IN | 2.0 | 2.0 | 1764 | $1,600 | $0.91 | 24d | 1 | 0.90mi |
| 234 N Addison St Indianapolis, IN | 3.0 | 2.0 | 1892 | $1,900 | $1.00 | 44d | 1 | 0.90mi |
| 925 N Somerset Ave Indianapolis, IN | 3.0 | 1.0 | 1061 | $1,300 | $1.23 | 8d | 1 | 0.91mi |
| 156 Haugh St Indianapolis, IN | 3.0 | 2.5 | 1800 | $2,000 | $1.11 | 44d | 1 | 0.99mi |
| 1410 Breedlove Ln Indianapolis, IN | 2.0 | 1.0–2.0 | 886 | $2,557 | $2.88 | 2d | 63 | 1.09mi |
| 210 N Richland St Indianapolis, IN | 4.0 | 2.0 | 1062 | $1,625 | $1.53 | 14d | 1 | 1.13mi |
| 1228 W 18th St Indianapolis, IN | 2.0 | 1.0 | 1050 | $1,200 | $1.14 | 44d | 1 | 1.28mi |
| 1920 Sugar Grove Ave Indianapolis, IN | 3.0 | 1.5 | 1378 | $1,175 | $0.85 | 3d | 1 | 1.32mi |
| 1201 Indiana Ave Indianapolis, IN | 1.0–3.0 | 1.0–3.5 | 967 | $2,404 | $2.49 | 2d | 36 | 1.35mi |
| 3621 Lawnview Ln Indianapolis, IN | 1.0–4.0 | 1.0–1.5 | 1012 | $1,162 | $1.15 | 2d | 13 | 1.39mi |
| 1449 Montcalm St Indianapolis, IN | 3.0 | 1.0 | 1300 | $1,900 | $1.46 | 44d | 1 | 1.39mi |
| 2602 Mansion Dr Indianapolis, IN | 2.0–3.0 | 2.0 | 1850 | $1,675 | $0.91 | 8d | 6 | 1.40mi |
| 2248 N Harding St Indianapolis, IN | 2.0 | 1.0 | 1100 | $899 | $0.82 | 24d | 1 | 1.48mi |
| 1367 W Pruitt St Indianapolis, IN | 3.0 | 1.0 | 1088 | $1,450 | $1.33 | 44d | 1 | 1.49mi |
Listing history 27 events
-
2026-06-18days on market $119,900 Active 205 DOM
-
2026-06-17days on market $119,900 Active 204 DOM
-
2026-06-16days on market $119,900 Active 203 DOM
-
2026-06-15days on market $119,900 Active 202 DOM
-
2026-06-13days on market $119,900 Active 200 DOM
-
2026-06-13days on market $119,900 Active 199 DOM
-
2026-06-09days on market $119,900 Active 196 DOM
-
2026-06-08days on market $119,900 Active 195 DOM
-
2026-06-07days on market $119,900 Active 194 DOM
-
2026-06-03days on market $119,900 Active 190 DOM
-
2026-06-02days on market $119,900 Active 189 DOM
-
2026-06-01days on market $119,900 Active 188 DOM
-
2026-05-31days on market $119,900 Active 187 DOM
-
2026-03-17price $119,900 853-char remark
Show marketing remark (853 chars)
Excellent investment opportunity on Indy's Westside! Last rent was $985/month. Property needs some work but near parks and minutes from Speedway or Downtown! Additional 7 properties available from same seller/agent, also vacant, varying condition. Property is sold in Receivership - requires UNITED STATES DISTRICT COURT FOR THE SOUTHERN DISTRICT OF NEW YORK approval of contract prior to closing. Buyer to be responsible for all costs on the settlement statement except for Seller paid commissions and management fees. Please see the attached documents. The Seller Addendum must be executed and delivered with all Purchase Offers along with all disclosures and proof of funds. Property is sold as-is. Seller will not assume responsibility for any required repairs to the home to qualify for financing. Utilities are inactive and the home is winterized.
-
2026-01-19price $124,900 853-char remark
Show marketing remark (853 chars)
Excellent investment opportunity on Indy's Westside! Last rent was $985/month. Property needs some work but near parks and minutes from Speedway or Downtown! Additional 7 properties available from same seller/agent, also vacant, varying condition. Property is sold in Receivership - requires UNITED STATES DISTRICT COURT FOR THE SOUTHERN DISTRICT OF NEW YORK approval of contract prior to closing. Buyer to be responsible for all costs on the settlement statement except for Seller paid commissions and management fees. Please see the attached documents. The Seller Addendum must be executed and delivered with all Purchase Offers along with all disclosures and proof of funds. Property is sold as-is. Seller will not assume responsibility for any required repairs to the home to qualify for financing. Utilities are inactive and the home is winterized.
-
2025-11-24$129,900 Active 853-char remark
Show marketing remark (853 chars)
Excellent investment opportunity on Indy's Westside! Last rent was $985/month. Property needs some work but near parks and minutes from Speedway or Downtown! Additional 7 properties available from same seller/agent, also vacant, varying condition. Property is sold in Receivership - requires UNITED STATES DISTRICT COURT FOR THE SOUTHERN DISTRICT OF NEW YORK approval of contract prior to closing. Buyer to be responsible for all costs on the settlement statement except for Seller paid commissions and management fees. Please see the attached documents. The Seller Addendum must be executed and delivered with all Purchase Offers along with all disclosures and proof of funds. Property is sold as-is. Seller will not assume responsibility for any required repairs to the home to qualify for financing. Utilities are inactive and the home is winterized.
-
2024-01-05status Active
-
2023-12-31historical
-
2023-12-11price $120,800
-
2023-10-19price $120,900
-
2023-09-05$121,000 Active
-
2008-11-20historical
-
2008-04-29$42,200
-
2005-08-10soldstatus $14,250
-
2005-03-17$17,590
-
2000-10-29historical
-
2000-05-19$34,900
ⓘ Source: listings_history table (triggers on properties + properties_extension) + one-shot
backfill from property_details.listing_events for pre-trigger history.
Tax reassessment forecast IN · Partial reset (capped growth)
- Current annual tax
- $3,144 · $262/mo
- Projected year-2 tax
- $3,144 · $262/mo
- Expected delta
- $0/yr ($0/mo · 0.0%)
ⓘ Screening estimate from a state-policy table — verify with the county assessor before closing.
Climate risk First Street
- Flood 1/10 Low FEMA zone X (unshaded) · 0% chance over 30 yrs
- Wildfire 1/10 Low
- Heat 4/10 Moderate 7 d/yr ≥102°F today · 19 d/yr by 30 yrs out
- Wind 2/10 Low 0% chance of damaging wind over 30 yrs
- Air quality 4/10 Moderate 5 unhealthy d/yr today · 7 by 30 yrs out
Nearby sold comps map
Loading sold comps map…
Walkable amenities ~0.75 mi
Loading nearby amenities…
Taxation est. · year 1
- Rental income
- $18,722
- − Mortgage interest
- −$6,716
- − Property taxes
- −$3,144
- − Insurance
- −$600
- − Repairs & maintenance
- −$1,498
- − Management
- −$1,498
- − Depreciation
- −$3,488
- Taxable income
- $1,779
- Est. tax owed @ 24.0%
- −$427
- After-tax cash flow
- $3,075/yr
For passive investors: Depreciation is non-cash, so a rental often shows a tax loss while cash-flowing — sheltering income. Rental losses are passive: they offset passive income freely, and up to $25,000/yr can offset ordinary (W-2) income if you actively participate and your MAGI is under $100k (phasing out to $0 by $150k); unused losses carry forward. On sale, claimed depreciation is recaptured at up to 25%, and gains may owe capital-gains tax (a 1031 exchange can defer both). Figures are a year-1 estimate at your 24.0% rate — not tax advice; consult a CPA.
Schools (NCES district)
- District
- Indianapolis Public Schools
- NCES district ID
- 1804770
- Math proficiency
- 14% ▼ -7.00%
- Reading proficiency
- 20% ▼ -3.00%
- Median HH income
- $32,034
- Composite
- 13.69/100
- National rank
- #9499
- State rank
- #286 of 301 in IN
Livability — Indianapolis city (balance)
No livability data for this city. (Only ~50 U.S. cities are tracked.)
Census & demographics
- Census place
- Indianapolis city (balance), IN
- County
- Marion County · 998,460 people
- City population
- 881,119
- Metro
- Indianapolis-Carmel-Anderson, IN
- Population (ZIP)
- 38,887
- Household income
- $50,783
- Rent vs Own
- Severe rent burden
- 1750.0
Population outlook (Marion County) Hauer SSP2
- Today (2025)
- 1,025,572 people
- By 2030
- 1,065,727 · +3.9%
- By 2040
- 1,141,577 · +11.3%
- By 2050
- 1,208,920 · +17.9%
- By 2075
- 1,367,288 · +33.3%
- By 2100
- 1,438,201 · +40.2%
Race, ethnicity, and origin ACS 2023
- Neighborhood character
- Highly diverse neighborhood (Simpson 0.72)
- Race & ethnicity
- White 32% Black 30% Hispanic / Latino 30% Two or more races 12% Asian 2%
- Hispanic origin (detail)
- Mexican 24% Puerto Rican 1%
- Common ancestry
- Lithuanian 1% Iranian 1% Slovak 1%
- Foreign-born
- 21% · Canada, Jamaica
- Languages at home
- 67% English-only · Spanish 25% Other Indo-European 3% Arabic 2%
Political lean MEDSL · Marion
- 2024 margin
- Strong D (+27.7) · D 63.0% · R 35.3% · Other 1.7%
- 2008→2024 swing
- -0.7pp no change · 2008: 28.4pp · 2024: 27.7pp
- All cycles
- 2024: D+27.7 2020: D+29.1 2016: D+22.8 2012: D+22.2 2008: D+28.4
Not yet ingested
- Civics
- —
Market trends
- HPI YoY
- ▼ -75.47%
- Current HPI
- 375.8479
- Rent YoY
- ▲ 2.46%
- Metro
- Indianapolis-Carmel-Anderson, IN
- State GDP YoY
- ▲ 2.90%
- F500 in state
- 18
Industry mix (Fortune 500 HQ in IN)
| Industry | F500 HQs | Revenue |
|---|---|---|
| Industrial Machinery | 2 | $37B |
|
||
| Healthcare | 1 | $177B |
|
||
| Pharmaceuticals | 1 | $45B |
|
||
| Metals / Steel | 1 | $18B |
|
||
| Agriculture | 1 | $17B |
|
||
| Packaging | 1 | $12B |
|
||
Price history
+243.6% since first listed14 events — show timeline
- 2026-03-17 Price Changed $119,900 MIBOR as Distributed by MLS Grid
- 2026-01-19 Price Changed $124,900 MIBOR as Distributed by MLS Grid
- 2025-11-24 Listed $129,900 MIBOR as Distributed by MLS Grid
- 2024-01-05 Relisted — MIBOR as Distributed by MLS Grid
- 2023-12-31 Listing Removed — MIBOR as Distributed by MLS Grid
- 2023-12-11 Price Changed $120,800 MIBOR as Distributed by MLS Grid
- 2023-10-19 Price Changed $120,900 MIBOR as Distributed by MLS Grid
- 2023-09-05 Listed $121,000 MIBOR as Distributed by MLS Grid
- 2008-11-20 Listing Removed — MIBOR as Distributed by MLS Grid
- 2008-04-29 Listed $42,200 MIBOR as Distributed by MLS Grid
- 2005-08-10 Sold (MLS) $14,250 MIBOR as Distributed by MLS Grid
- 2005-03-17 Listed $17,590 MIBOR as Distributed by MLS Grid
- 2000-10-29 Listing Removed — MIBOR as Distributed by MLS Grid
- 2000-05-19 Listed $34,900 MIBOR as Distributed by MLS Grid
Property tax history
+17.1%/yrLatest (2025): $3,144 · +29.3% YoY. Source: county tax records.
Cash-flow waterfall
monthlySold comps — $/sqft
last 12 mo · ≤1 miLoading sold comps…