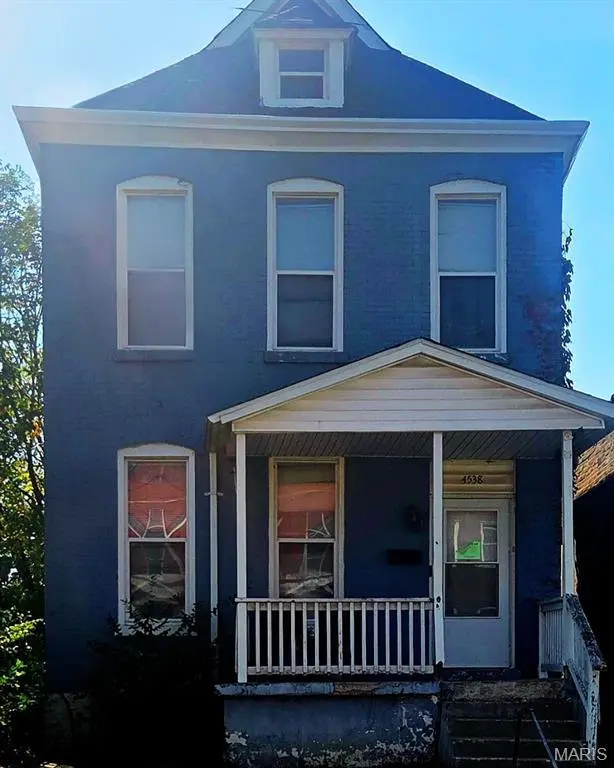
4538 San Francisco Ave · St. Louis, MO
Flood risk 1/10 · Minimal
- FEMA flood zone
- X (unshaded)
- Chance of flooding over 30 yrs
- 0.0%
- Est. flood insurance / yr
- $473 – $860
Fire risk 1/10 · Minimal
- Est. fire insurance / yr
- $1,054 – $1,958
Heat risk 5/10 · Moderate
- Hot days now (above 107°F)
- 7 days/yr
- Hot days in 30 yrs
- 21 days/yr
Wind risk 2/10 · Minimal
- Chance of severe wind over 30 yrs
- 1.0%
Air-quality risk 4/10 · Minor
- Unhealthy air days now
- 5 days/yr
- Unhealthy air days in 30 yrs
- 6 days/yr
Risk factors via First Street. Map © Google.
Why this score? — see what drove the B- grade
The composite is a weighted blend of 9 inputs, each scored 0–100. Each bar is that input's sub-score; the figure is the points it added to the 100-point composite (weight × sub-score).
- Cash flow +30.0/30.0
- 1% rule +10.0/10.0
- DSCR +10.0/10.0
- ARV discount +7.5/15.0
- Appreciation +3.3/10.0
- Rent growth +2.5/5.0
- Livability +2.5/5.0
- Condition / age +2.5/5.0
- Schools +1.2/10.0
$68,000
🖨 Deal sheet 📄 Offer letter ✓ Due diligence
Listing remarks MLS
Loads of updates to this charming brick 2 story with great covered porch. 2 large bedrooms on the second floor and 3rd upstairs. 2 full baths (one on main and one on second floor) Kitchen has oak cabinets, formica counters, side-by-side refrigerator, electric range/hood and double bowl stainless sink. The basement is divided into 2 rooms with the back room for laundry, furnace, water heater and walkout to the level back yard. Additional storage in storage shed and parking pad as well. Roof-2017, Windows-2007, Electric service-2007, Furnace-2015, Air conditioner-2015, Water heater-2008, Plumbing-completely redone in 2008, updated kitchen in 2022, Updated Kitchen floor, new fridge 2015. Bathroom finishes-tub, tile, shower, faucet updates in 2020 and 2022. Sewer pipe under basement floor—scoped and videoed with clear result is 2/22. As-Is.
Key facts
- Fenced yard
- Newer roof
- Walk-out basement
Tags
Property features AI
Finance
- Financial info: No second mortgage reported
Exterior
- Parking: One carport space
- Utilities: Public water; Public sewer; Electric service by Ameren; Electricity and natural gas available and connected
- Home design: Single-family residence; Two levels; Residential property
- Construction: Brick construction
- Exterior features: Back yard
Interior
- Bedrooms: Two bedrooms, both on the main level
- Bathrooms: One full bathroom; One half bathroom
- Heating & cooling: Forced air heating; Central air conditioning
- Interior features: Basement with poured walls (8+ ft)
Neighborhood map
What this means for you Summary
Snapshot
- This is a 2-bed/1.0-bath single-family listed at $68k.
Deal economics
- At list price, monthly cash flow is $400 ($5k/yr) — positive.
- The deal already cash-flows at list — no discount required.
- Meets the 1% rule at list price ($1k rent vs $68k).
- Recommended offer: $67k (1.5% below list) — sets the bar for market timing.
- Cap rate 13.4% vs local median 5.0% in St. Louis — top-decile yield for the area; either an underpriced asset or a hidden risk that comps aren't pricing in. Stress-test before assuming the spread holds.
Location & tenants
- Location reads: area grade B — affects rentability + tenant quality, not the cash-flow math above.
- St. Louis City (urban): math 10% / reading 18% proficiency, ranked #312 of 324 in MO (top 96%) — low school quality limits family demand, transient renter base, plan for 1-2y turnover; 80% free/reduced lunch — lower-income household profile, screen leases tightly.
- Zoned schools: Hickey Elem. (math 2% / reading 8%, grade F, #1,072 of 1,115 statewide, top 98%, 273 students, 99% FRL); Sumner High (math 2% / reading 2%, grade F, #520 of 521 statewide, top 100%, 264 students, 99% FRL) — zoned schools average 99% FRL vs 80% district-wide (18 pts higher); higher-poverty schools than district average — tighter screening recommended.
- Market conditions: 97 active listings in the ZIP; 16 comparable units currently listed for rent nearby; rentals lingering (median 44d on market — plan ~5-8 weeks vacancy on turnover, expect pricing pressure); 50% of comp listings sitting > 30 days — soft ceiling on asking rent; lower-income renter base — watch delinquency; 294 units permitted in St. Louis city in 2024 (227 in 5+ unit buildings).
Forward outlook
- Local home prices are declining (-3.0%/yr); year-one equity from $470 of loan paydown is wiped out by about $2k of value loss. Plan a longer hold.
- St. Louis County population projected to shrink 6% by 2050 — rents likely to lag national; underwrite the cash flow, not the appreciation.
- At projected returns (-3.0% appreciation + 3.0% rent growth), your $19k cash investment doubles in ~5 years — after that, you're playing with house money.
Negotiation context
- It's been on market 16 days — a 2% lower offer ($67k) is reasonable based on typical stale-listing flexibility.
- 3 sale attempts since 3y ago with the ask held roughly flat each time — persistent listings suggest the price (not the market) is what's stuck; bring a comps-based counter.
- Current owner paid $45k; list at $68k implies a 51% gain — meaningful room to come down on a strong offer.
Risks & watch-outs
- Watch-outs: built in 1880 — expect roof / HVAC / electrical / plumbing capex.
- Climate carrying-cost: extreme-heat days projected 7→21/yr by 2055 (HVAC capex compounding) — expect insurance premiums to compound above CPI over the hold.
Questions for the listing agent
- Built in 1880 — when were the roof, HVAC, electrical panel, plumbing, and water heater last replaced?
- Is there a deadline driving the sale (1031 exchange, divorce, estate, relocation)? That informs how much negotiation room exists.
- What's the average days-on-market for RENTAL listings here right now (not sales)? A rising rental-DOM trend means longer vacancies and softer asking-rent achievability than the comps imply.
- What's the recent tenant-quality profile in this submarket — average credit score on applications, eviction rate, late-payment / NSF rate, and stable-employment percentage? A property-management company in the area should have these aggregated.
- How much new for-sale + rental construction is in the pipeline within 1–3 miles? Heavy new supply typically softens prices + rents 12–24 months out; constrained supply supports both.
Investment metrics
- 1% rule
- 1.51% ✓
- Cap rate
- 13.36%
- Cash-on-cash
- 25.24%
- DSCR
- 2.12
- GRM
- 5.5
CMA / ARV
- ARV (on-the-fly)
- $34,560
- Comps found
- 12
Show comp detail 12 sales within ~0.75 mi
| Address | Dist | Beds/Ba | Sqft | Sold | Price | $/sf | Match |
|---|---|---|---|---|---|---|---|
| 4472 Natural Bridge Ave | 0.15mi | 2/1.0 | 1,338 (+4%) | 9mo | $25,000 | $19 | 78 |
| 4533 Lexington Ave | 0.15mi | 3/1.0 (+1) | 1,175 (-8%) | 3mo | $105,900 | $90 | 72 |
| 4416 San Francisco Ave | 0.23mi | 2/1.5 | 1,167 (-9%) | 6mo | $29,900 | $26 | 68 |
| 4400 San Francisco Ave | 0.26mi | 2/1.0 | 1,167 (-9%) | 8mo | $7,000 | $6 | 67 |
| 4814 Calvin Ave | 0.62mi | 3/1.0 (+1) | 1,257 (-2%) | 8mo | $20,000 | $16 | 56 |
| 4843 Lee Ave | 0.49mi | 3/1.0 (+1) | 1,170 (-9%) | 2mo | $71,500 | $61 | 56 |
| 4430 Sexauer Ave | 0.65mi | 2/1.0 | 1,212 (-5%) | 6mo | $64,500 | $53 | 56 |
| 4853 Lee Ave | 0.51mi | 2/1.0 | 1,092 (-15%) | 3mo | $29,900 | $27 | 49 |
| 4470 Dryden Ave | 0.69mi | 3/2.0 (+1) | 1,323 (+3%) | 8mo | $21,500 | $16 | 47 |
| 4941 Lexington Ave | 0.65mi | 3/2.0 (+1) | 1,240 (-3%) | 11mo | $124,900 | $101 | 47 |
| 4514 Bircher Blvd | 0.72mi | 3/2.0 (+1) | 1,222 (-4%) | 4mo | $30,000 | $25 | 46 |
| 4250 E Kossuth Ave | 0.58mi | 3/1.0 (+1) | 1,100 (-14%) | 4mo | $70,000 | $64 | 41 |
Match score weights: distance 35% · size 25% · config 20% · recency 20%. Top-matched comps best support the ARV.
Projected returns pro-forma
-3.0% appreciation · 3.0% rent growth · sell at horizon
- IRR
- 18.7%
- Equity multiple
- 1.76×
- Total profit
- $14,467
- Equity at exit
- $10,139
- IRR
- 27.1%
- Equity multiple
- 3.38×
- Total profit
- $45,356
- Equity at exit
- $5,879
Cash invested: $19,040 (down + closing). Projections, not guarantees.
Landlord ↔ Tenant lean methodology
- Overall (STATE)
- 81 Strongly Landlord-Friendly
- State Missouri
- 81 Strongly Landlord-Friendly · R+10
- County
- — inherits STATE
- City
- — inherits STATE
ZIP-level market 63115
- Home prices YoY
- -2.6%
- Active inventory
- 97
- Price-to-rent
- 5.5×
Monthly cashflow live
- Estimated rent
- $1,027 high interval (Pro) →
- Mortgage (P&I)
- −$357
- Tax from tax record
- −$26 /mo · $308/yr
- Insurance
- −$28
- HOA
- −$0
- Vacancy / Maint / Mgmt
- −$216
- Net cashflow
- $400
Break-even live
UW: 25.0% down · 7.5% · 30yr · 1.5% tax · 5.0% vac · 8.0% maint · 8.0% mgmt
Financing live
Cash to close
- Down payment
- $17,000
- Closing costs
- $2,040
- Reserves months
- —
- Total cash needed
- —
Loan-product check · same deal, 3 products live
Conventional
25% down · 7.5% · 30yr
- Down + closing
- —
- Monthly P&I
- —
- Monthly cashflow
- —
- DSCR
- —
- Eligible?
- —
Personal DTI + credit; lowest rate.
DSCR
20% down · 8.5% · 30yr
- Down + closing
- —
- Monthly P&I
- —
- Monthly cashflow
- —
- DSCR
- —
- Eligible?
- —
No personal income docs; deal must DSCR.
Hard money
10% down · 12.0% · 12mo
- Down + closing
- —
- Monthly P&I
- —
- Monthly cashflow
- —
- DSCR
- —
- Eligible?
- —
Short-term bridge; refi at stabilization.
Rent comps 16 comps
| Address | Beds | Baths | Sqft | Rent | $/sqft | DOM | Units | Dist |
|---|---|---|---|---|---|---|---|---|
| 4642 Farlin Ave Unit 1F St. Louis, MO | 2.0 | 1.0 | 1056 | $800 | $0.76 | 43d | 1 | 0.17mi |
| 4497 Lee Ave Saint Louis, MO | 3.0 | 2.0 | 1012 | $1,000 | $0.99 | 16d | 1 | 0.30mi |
| 4040 Shreve Ave Saint Louis, MO | 3.0 | 1.0 | 1201 | $1,250 | $1.04 | 43d | 1 | 0.33mi |
| 4493 Bessie Ave Saint Louis, MO | 3.0 | 1.0 | 880 | $1,250 | $1.42 | 43d | 1 | 0.41mi |
| 4847 Calvin Ave Saint Louis, MO | 3.0 | 2.0 | 1000 | $1,473 | $1.47 | 2d | 1 | 0.64mi |
| 4223 Red Bud Ave Unit 1F St. Louis, MO | 2.0 | 1.0 | 1167 | $895 | $0.77 | 43d | 1 | 0.67mi |
| 4426 Holly Ave Unit B St. Louis, MO | 2.0 | 1.0 | 1000 | $1,100 | $1.10 | 14d | 1 | 0.72mi |
| 4460 Bircher Blvd Saint Louis, MO | 1.0 | 1.0 | 1100 | $725 | $0.66 | 10d | 1 | 0.77mi |
| 4247 Maffitt Ave St. Louis, MO | 3.0 | 1.5 | 1700 | $1,000 | $0.59 | 4d | 1 | 0.86mi |
| 4919 Thekla Ave Saint Louis, MO | 2.0 | 1.0 | 931 | $700 | $0.75 | 43d | 1 | 0.97mi |
| 2603 Belle Glade Ave Saint Louis, MO | 2.0 | 1.0 | 945 | $800 | $0.85 | 4d | 1 | 1.06mi |
| 1708 Annie Malone Dr Saint Louis, MO | 3.0 | 1.5 | 924 | $1,500 | $1.62 | 43d | 1 | 1.21mi |
| 2831 Abner Pl Unit 7 St. Louis, MO | 2.0 | 1.0 | 968 | $1,250 | $1.29 | 23d | 1 | 1.33mi |
| 4202 Gano Ave Saint Louis, MO | 3.0 | 1.0 | 1650 | $1,168 | $0.71 | 23d | 1 | 1.37mi |
| 5338 Claxton Ave Unit 33 St. Louis, MO | 3.0 | 2.0 | 1196 | $1,550 | $1.30 | 43d | 1 | 1.41mi |
| 1232 N Euclid Ave Saint Louis, MO | 3.0 | 1.5 | 982 | $1,395 | $1.42 | 43d | 1 | 1.44mi |
Listing history 11 events
-
2026-06-18days on market $68,000 Active 16 DOM
-
2026-06-17days on market $68,000 Active 15 DOM
-
2026-06-16days on market $68,000 Active 14 DOM
-
2026-06-15days on market $68,000 Active 13 DOM
-
2026-06-13days on market $68,000 Active 11 DOM
-
2026-06-09days on market $68,000 Active 7 DOM
-
2026-06-08days on market $68,000 Active 6 DOM
-
2026-06-07days on market $68,000 Active 5 DOM
-
2026-06-05days on market $68,000 Active 2 DOM
-
2026-06-02remarks 407-char remark
-
2026-06-02$68,000 Active 1 DOM
ⓘ Source: listings_history table (triggers on properties + properties_extension) + one-shot
backfill from property_details.listing_events for pre-trigger history.
Tax reassessment forecast MO · Resets to sale price
- Current annual tax
- $308 · $26/mo
- Projected year-2 tax
- $660 · $55/mo
- Expected delta
- +$351/yr (+$29/mo · 113.9%)
ⓘ Screening estimate from a state-policy table — verify with the county assessor before closing.
Climate risk First Street
- Flood 1/10 Low FEMA zone X (unshaded) · 0% chance over 30 yrs
- Wildfire 1/10 Low
- Heat 5/10 Major 7 d/yr ≥107°F today · 21 d/yr by 30 yrs out
- Wind 2/10 Low 100% chance of damaging wind over 30 yrs
- Air quality 4/10 Moderate 5 unhealthy d/yr today · 6 by 30 yrs out
Nearby sold comps map
Loading sold comps map…
Walkable amenities ~0.75 mi
Loading nearby amenities…
Taxation est. · year 1
- Rental income
- $12,321
- − Mortgage interest
- −$3,809
- − Property taxes
- −$308
- − Insurance
- −$340
- − Repairs & maintenance
- −$986
- − Management
- −$986
- − Depreciation
- −$1,978
- Taxable income
- $3,914
- Est. tax owed @ 24.0%
- −$939
- After-tax cash flow
- $3,866/yr
For passive investors: Depreciation is non-cash, so a rental often shows a tax loss while cash-flowing — sheltering income. Rental losses are passive: they offset passive income freely, and up to $25,000/yr can offset ordinary (W-2) income if you actively participate and your MAGI is under $100k (phasing out to $0 by $150k); unused losses carry forward. On sale, claimed depreciation is recaptured at up to 25%, and gains may owe capital-gains tax (a 1031 exchange can defer both). Figures are a year-1 estimate at your 24.0% rate — not tax advice; consult a CPA.
Schools (NCES district)
- District
- St. Louis City
- NCES district ID
- 2929280
- Math proficiency
- 10% ▼ -6.00%
- Reading proficiency
- 18% ▼ -3.00%
- Median HH income
- $35,685
- Composite
- 11.54/100
- National rank
- #9699
- State rank
- #312 of 324 in MO
Livability — St. Louis
No livability data for this city. (Only ~50 U.S. cities are tracked.)
Census & demographics
- Census place
- St. Louis, MO
- County
- Saint Louis City · 254,015 people
- City population
- 283,259
- Metro
- St. Louis, MO-IL
- Population (ZIP)
- 14,488
- Household income
- $30,622
- Rent vs Own
- Severe rent burden
- 1655.0
Population outlook (St. Louis County) Hauer SSP2
- Today (2025)
- 315,737 people
- By 2030
- 313,865 · -0.6%
- By 2040
- 305,439 · -3.3%
- By 2050
- 296,529 · -6.1%
- By 2075
- 271,028 · -14.2%
- By 2100
- 255,359 · -19.1%
Race, ethnicity, and origin ACS 2023
- Neighborhood character
- Predominantly Black (95%)
- Race & ethnicity
- Black 95% White 2% Two or more races 2%
- Foreign-born
- 0%
Political lean MEDSL · St. Louis
- 2024 margin
- Solid D (+64.7) · D 81.4% · R 16.7% · Other 2.0%
- 2008→2024 swing
- -3.5pp toward R · 2008: 68.2pp · 2024: 64.7pp
- All cycles
- 2024: D+64.7 2020: D+66.2 2016: D+63.7 2012: D+66.6 2008: D+68.2
Not yet ingested
- Civics
- —
Market trends
- HPI YoY
- ▼ -3.42%
- Current HPI
- 127.3403
- Rent YoY
- —
- Metro
- St. Louis, MO-IL
- State GDP YoY
- ▲ 1.84%
- F500 in state
- 20
Industry mix (Fortune 500 HQ in MO)
| Industry | F500 HQs | Revenue |
|---|---|---|
| Healthcare | 1 | $163B |
|
||
| Insurance | 1 | $21B |
|
||
| Industrial Technology | 1 | $17B |
|
||
| Retail | 1 | $16B |
|
||
| Industrial Distribution | 1 | $10B |
|
||
| Utilities | 1 | $9B |
|
||
Price history
+4.6% since first listed24 events — show timeline
- 2026-06-02 Listed $68,000 MARIS as Distributed by MLS Grid
- 2026-04-10 Price Changed $73,400 MARIS as Distributed by MLS Grid
- 2026-04-07 Price Changed $73,500 MARIS as Distributed by MLS Grid
- 2026-03-22 Price Changed $73,700 MARIS as Distributed by MLS Grid
- 2026-03-13 Price Changed $73,800 MARIS as Distributed by MLS Grid
- 2026-03-10 Price Changed $73,900 MARIS as Distributed by MLS Grid
- 2026-02-21 Price Changed $74,000 MARIS as Distributed by MLS Grid
- 2026-02-13 Price Changed $74,100 MARIS as Distributed by MLS Grid
- 2026-02-06 Price Changed $74,200 MARIS as Distributed by MLS Grid
- 2026-01-27 Price Changed $74,400 MARIS as Distributed by MLS Grid
- 2026-01-16 Price Changed $74,500 MARIS as Distributed by MLS Grid
- 2026-01-09 Price Changed $74,600 MARIS as Distributed by MLS Grid
- 2026-01-02 Price Changed $74,700 MARIS as Distributed by MLS Grid
- 2025-12-29 Price Changed $74,800 MARIS as Distributed by MLS Grid
- 2025-12-19 Price Changed $74,900 MARIS as Distributed by MLS Grid
- 2025-10-29 Listed $75,000 MARIS as Distributed by MLS Grid
- 2023-03-17 Sold (Public Records) $45,000 Public Records
- 2023-03-16 Pending — MARIS as Distributed by MLS Grid
- 2023-03-15 Sold (MLS) — MARIS as Distributed by MLS Grid
- 2023-02-24 Contingent — MARIS as Distributed by MLS Grid
- 2023-02-17 Listed $45,000 MARIS as Distributed by MLS Grid
- 2006-10-10 Sold (Public Records) $19,000 Public Records
- 2004-12-28 Sold (Public Records) $65,000 Public Records
- 2000-01-28 Sold (Public Records) — Public Records
Property tax history
+0.1%/yrLatest (2024): $308 · +4.7% YoY. Source: county tax records.
Cash-flow waterfall
monthlySold comps — $/sqft
last 12 mo · ≤1 miLoading sold comps…