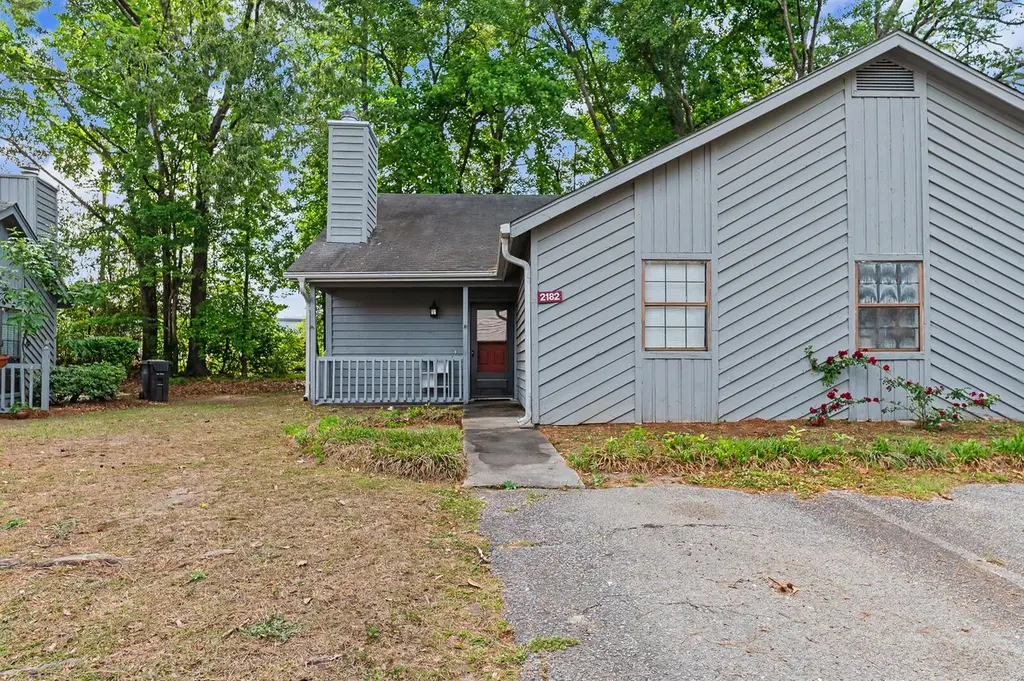
2182 Spoleto Ln · North Charleston, SC
Flood risk 1/10 · Minimal
- FEMA flood zone
- X (unshaded)
- Chance of flooding over 30 yrs
- 0.0%
- Est. flood insurance / yr
- $507 – $1,088
Fire risk 3/10 · Minor
- Est. fire insurance / yr
- $783 – $1,453
Heat risk 9/10 · Severe
- Hot days now (above 107°F)
- 7 days/yr
- Hot days in 30 yrs
- 17 days/yr
Wind risk 8/10 · Major
- Chance of severe wind over 30 yrs
- 99.0%
Air-quality risk 2/10 · Minimal
- Unhealthy air days now
- 2 days/yr
- Unhealthy air days in 30 yrs
- 2 days/yr
Risk factors via First Street. Map © Google.
Why this score? — see what drove the F grade
The composite is a weighted blend of 9 inputs, each scored 0–100. Each bar is that input's sub-score; the figure is the points it added to the 100-point composite (weight × sub-score).
- Cash flow +7.7/30.0
- ARV discount +7.5/15.0
- Schools +4.3/10.0
- 1% rule +3.6/10.0
- Livability +3.3/5.0
- Rent growth +2.8/5.0
- Condition / age +2.2/5.0
- DSCR +1.8/10.0
- Appreciation +0.0/10.0
$189,900
🖨 Deal sheet 📄 Offer letter ✓ Due diligence
Listing remarks MLS
SELLER WILL PAY $2,000 TOWARDS BUYER'S CLOSING COSTS. GREAT SINGLE STORY CONDO IN A VERY CONVENIENT LOCATION. THIS CONDO OFFERS A SPACIOUS, OPEN FLOOR PLAN WITH VAULTED CEILINGS, A FIREPLACE, SPACIOUS BEDROOMS WITH LARGE CLOSETS, AND A PRICE THAT IS HARD TO FIND ON A HOME THIS NICE. DON'T MISS OUT ON THIS OPPORTUNITY! SELLER PROVIDING A ONE YEAR HOME TRUST WARRANTY.
Key facts
- Covered front porch
- Private driveway
- Vaulted ceilings
Tags
Property features AI
Finance
- HOA & community: Subdivision: Otranto Club Villas; Community pool
Exterior
- Parking: Off-street parking
- Utilities: Public sewer; Charleston Water Service; Dominion Energy
- Home design: Single family attached (condominium); One level
- Construction: Condominium structure
- Exterior features: Architectural roof; Community pool
Interior
- Kitchen: Dishwasher; Microwave; Refrigerator
- Bedrooms: 2 bedrooms; Master bedroom with ceiling fan
- Flooring: Laminate
- Bathrooms: 2 bathrooms
- Heating & cooling: Central heat; Central air conditioning
- Interior features: Smooth ceilings; Ceiling fans; Living/dining combo
- Laundry & utility: Washer; Dryer
Neighborhood map
What this means for you Summary
Snapshot
- This is a 2-bed/2.0-bath condo listed at $190k. Condition is rated fair.
Deal economics
- At list price, monthly cash flow is $-224 ($-3k/yr) — negative.
- To cash-flow at today's rent, offer at most $186k (1.8% below list).
- To meet the 1% rule (rent ≥ 1% of price), the offer needs to be $163k (14.1% below list).
- Recommended offer: $163k (14.1% below list) — sets the bar for 1% rule.
- Cap rate 4.9% vs local median 4.0% in North Charleston — meaningfully above typical; check what's discounted (condition, days-on-market, listing class) to confirm the premium yield is real.
Location & tenants
- Location reads 66/100 on livability (#122 in SC) — a middle-class / working-renter tenant base. Strengths: housing A+, health & safety A+, cost of living A; Watch: employment C-, crime F, amenities F.
- Charleston 01 (urban): math 48% / reading 53% proficiency, ranked #7 of 80 in SC (top 9%) — acceptable for families but not a draw, mixed tenant base, ~2y average lease.
- Zoned schools: A. C. Corcoran Elementary (math 21% / reading 16%, grade F, #506 of 597 statewide, top 85%, 767 students, 100% FRL); Northwoods Middle (math 11% / reading 16%, grade F, #207 of 229 statewide, top 91%, 738 students, 100% FRL); Rb Stall High (math 49% / reading 63%, grade C, #126 of 196 statewide, top 65%, 1,952 students, 100% FRL) — zoned schools average 100% FRL vs 44% district-wide (56 pts higher); higher-poverty schools than district average — tighter screening recommended.
- Zoned-school proficiency averages 29% at this address vs 50% district-wide (-21 pts) — the specific schools serving this property underperform the Charleston 01 average; the district grade overstates school quality for this exact location.
- Market conditions: Rents rising (+1.4%/yr); 174 active listings in the ZIP; 9 comparable units currently listed for rent nearby; rentals leasing fast (median 12d on market — plan ~1-2 weeks tenant-placement turnaround); 4,156 units permitted in Charleston County in 2024 (857 in 5+ unit buildings).
- This rent runs 39% of the median local income ($50k/yr) — at the standard rent-burdened threshold; future hikes will face affordability resistance.
Forward outlook
- Local home prices are declining (-3.0%/yr); year-one equity from $1k of loan paydown is wiped out by about $6k of value loss. Plan a longer hold.
- Charleston County population projected at +44% by 2050 — long-run rental-demand tailwind backs the buy-and-hold thesis.
Negotiation context
- It's been on market 49 days — a 3% lower offer ($184k) is reasonable based on typical stale-listing flexibility.
- 2 sale attempts since 20y ago with the ask held roughly flat each time — persistent listings suggest the price (not the market) is what's stuck; bring a comps-based counter.
- Current owner paid $100k; list at $190k implies a 90% gain — meaningful room to come down on a strong offer.
Risks & watch-outs
- Climate carrying-cost: severe wind risk, 99% chance of damaging wind over 30y; extreme-heat days projected 7→17/yr by 2055 (HVAC capex compounding) — expect insurance premiums to compound above CPI over the hold.
Questions for the listing agent
- What do current leases actually rent for vs. the listed asking? Can we see a recent rent roll and the last 12 months of T-12 income?
- It's been on market 49 days. Have you received any prior offers? Is the seller open to a 14% concession, seller financing, or rate buy-down credit?
- Have any recent inspections been done? Can we get a copy of the seller's disclosures and any deferred-maintenance estimates?
- What does the HOA fee cover, when was the last increase, and are there any pending special assessments or reserve-fund shortfalls?
- Any open or pending special assessments — roof, HVAC, plumbing, elevator, façade? What's the per-unit balance and payoff schedule, and is the seller paying it off at close or rolling it to the buyer?
- Is there a deadline driving the sale (1031 exchange, divorce, estate, relocation)? That informs how much negotiation room exists.
- Crime grade is F in this area — have there been break-ins, vandalism, or insurance claims at this property in the last 3 years? What carrier currently insures it and at what premium?
- The area grade is low — what's the realistic commute time and amenity access for the typical tenant pool here? Any planned neighborhood developments (good or bad) we should know about?
- What's the average days-on-market for RENTAL listings here right now (not sales)? A rising rental-DOM trend means longer vacancies and softer asking-rent achievability than the comps imply.
- What's the recent tenant-quality profile in this submarket — average credit score on applications, eviction rate, late-payment / NSF rate, and stable-employment percentage? A property-management company in the area should have these aggregated.
- How much new apartment / multifamily construction is in the pipeline within 1–3 miles? Heavy new supply (>2% of stock underway) typically softens rents 12–24 months out; light construction supports rent growth.
Investment metrics
- 1% rule
- 0.86% ✗
- Cap rate
- 4.88%
- Cash-on-cash
- -5.04%
- DSCR
- 0.78
- GRM
- 9.7
CMA / ARV
No comps found within radius.
Projected returns pro-forma
-3.0% appreciation · 1.37% rent growth · sell at horizon
- IRR
- -26.9%
- Equity multiple
- 0.11×
- Total profit
- $-47,493
- Equity at exit
- $28,315
- IRR
- -32.4%
- Equity multiple
- -0.31×
- Total profit
- $-69,542
- Equity at exit
- $16,419
Cash invested: $53,172 (down + closing). Projections, not guarantees.
Landlord ↔ Tenant lean methodology
- Overall (STATE)
- 90 Strongly Landlord-Friendly
- State South Carolina
- 90 Strongly Landlord-Friendly · R+6
- County
- — inherits STATE
- City
- — inherits STATE
ZIP-level market 29406
- Home prices YoY
- -6.7%
- Rents YoY
- 1.4%
- Active inventory
- 174
- Price-to-rent
- 9.7×
Monthly cashflow live
- Estimated rent
- $1,631 high interval (Pro) →
- Mortgage (P&I)
- −$996
- Tax est. 1.5%
- −$237 /mo · $2,848/yr
- Insurance
- −$79
- HOA est. from 2 same-building comps
- −$200
- Vacancy / Maint / Mgmt
- −$343
- Net cashflow
- $-224
Break-even live
UW: 25.0% down · 7.5% · 30yr · 1.5% tax · 5.0% vac · 8.0% maint · 8.0% mgmt
Financing live
Cash to close
- Down payment
- $47,475
- Closing costs
- $5,697
- Reserves months
- —
- Total cash needed
- —
Loan-product check · same deal, 3 products live
Conventional
25% down · 7.5% · 30yr
- Down + closing
- —
- Monthly P&I
- —
- Monthly cashflow
- —
- DSCR
- —
- Eligible?
- —
Personal DTI + credit; lowest rate.
DSCR
20% down · 8.5% · 30yr
- Down + closing
- —
- Monthly P&I
- —
- Monthly cashflow
- —
- DSCR
- —
- Eligible?
- —
No personal income docs; deal must DSCR.
Hard money
10% down · 12.0% · 12mo
- Down + closing
- —
- Monthly P&I
- —
- Monthly cashflow
- —
- DSCR
- —
- Eligible?
- —
Short-term bridge; refi at stabilization.
Rent comps 9 comps
| Address | Beds | Baths | Sqft | Rent | $/sqft | DOM | Units | Dist |
|---|---|---|---|---|---|---|---|---|
| 8755 Jenny Lind St Charleston, SC | 1.0–3.0 | 1.0–2.0 | 940 | $1,442 | $1.53 | 19d | 1 | 0.88mi |
| 8554 S Waccamaw Ct Charleston, SC | 3.0 | 2.0 | 1028 | $1,950 | $1.90 | 23d | 1 | 1.04mi |
| 2510 Atlantic Palms Ln Charleston, SC | 1.0–3.0 | 1.0–2.0 | 1006 | $1,767 | $1.76 | 2d | 20 | 1.09mi |
| 150 Keenan Ave Goose Creek, SC | 3.0 | 1.5 | 1030 | $1,831 | $1.78 | 11d | 1 | 1.18mi |
| 2605 Elms Plantation Blvd North Charleston, SC | 2.0 | 2.0 | 1071 | $1,455 | $1.36 | 23d | 1 | 1.20mi |
| 2225 Greenridge Rd North Charleston, SC | 1.0–2.0 | 1.0–2.0 | 817 | $1,579 | $1.93 | 3d | 14 | 1.35mi |
| 7927 Saint Ives Rd Charleston, SC | 1.0–3.0 | 1.0–2.0 | 969 | $1,529 | $1.58 | 3d | 26 | 1.36mi |
| 8907 Deerwood Dr North Charleston, SC | 2.0 | 2.0 | 1000 | $1,700 | $1.70 | 23d | 1 | 1.37mi |
| 2245 Greenridge Rd North Charleston, SC | 1.0–3.0 | 1.0–2.0 | 965 | $1,528 | $1.58 | 3d | 19 | 1.49mi |
HOA detail condo
- Monthly dues
- $0 · $0/yr
- Assessments
- None detected in remarks — confirm with the listing agent.
Listing history 15 events
-
2026-06-18days on market $189,900 Active 49 DOM
-
2026-06-17days on market $189,900 Active 48 DOM
-
2026-06-16days on market $189,900 Active 47 DOM
-
2026-06-15days on market $189,900 Active 46 DOM
-
2026-06-10days on market $189,900 Active 41 DOM
-
2026-06-09days on market $189,900 Active 40 DOM
-
2026-06-08days on market $189,900 Active 39 DOM
-
2026-06-07days on market $189,900 Active 38 DOM
-
2026-06-05days on market $189,900 Active 35 DOM
-
2026-06-03days on market $189,900 Active 34 DOM
-
2026-06-01days on market $189,900 Active 32 DOM
-
2026-05-31days on market $189,900 Active 31 DOM
-
2026-04-30$189,900 Active
-
2006-06-28soldstatus $100,000 368-char remark
Show marketing remark (368 chars)
SELLER WILL PAY $2,000 TOWARDS BUYER'S CLOSING COSTS. GREAT SINGLE STORY CONDO IN A VERY CONVENIENT LOCATION. THIS CONDO OFFERS A SPACIOUS, OPEN FLOOR PLAN WITH VAULTED CEILINGS, A FIREPLACE, SPACIOUS BEDROOMS WITH LARGE CLOSETS, AND A PRICE THAT IS HARD TO FIND ON A HOME THIS NICE. DON'T MISS OUT ON THIS OPPORTUNITY! SELLER PROVIDING A ONE YEAR HOME TRUST WARRANTY.
-
2006-03-07$99,000 368-char remark
Show marketing remark (368 chars)
SELLER WILL PAY $2,000 TOWARDS BUYER'S CLOSING COSTS. GREAT SINGLE STORY CONDO IN A VERY CONVENIENT LOCATION. THIS CONDO OFFERS A SPACIOUS, OPEN FLOOR PLAN WITH VAULTED CEILINGS, A FIREPLACE, SPACIOUS BEDROOMS WITH LARGE CLOSETS, AND A PRICE THAT IS HARD TO FIND ON A HOME THIS NICE. DON'T MISS OUT ON THIS OPPORTUNITY! SELLER PROVIDING A ONE YEAR HOME TRUST WARRANTY.
ⓘ Source: listings_history table (triggers on properties + properties_extension) + one-shot
backfill from property_details.listing_events for pre-trigger history.
Climate risk First Street
- Flood 1/10 Low FEMA zone X (unshaded) · 0% chance over 30 yrs
- Wildfire 3/10 Moderate
- Heat 9/10 Extreme 7 d/yr ≥107°F today · 17 d/yr by 30 yrs out
- Wind 8/10 Severe 99% chance of damaging wind over 30 yrs
- Air quality 2/10 Low 2 unhealthy d/yr today · 2 by 30 yrs out
Nearby sold comps map
Loading sold comps map…
Walkable amenities ~0.75 mi
Loading nearby amenities…
Taxation est. · year 1
- Rental income
- $19,578
- − Mortgage interest
- −$10,637
- − Property taxes
- −$2,848
- − Insurance
- −$950
- − Repairs & maintenance
- −$1,566
- − Management
- −$1,566
- − HOA
- −$2,400
- − Depreciation
- −$5,524
- Taxable loss
- −$5,915
- Est. tax savings @ 24.0%
- +$1,420
- After-tax cash flow
- $-1,263/yr
For passive investors: Depreciation is non-cash, so a rental often shows a tax loss while cash-flowing — sheltering income. Rental losses are passive: they offset passive income freely, and up to $25,000/yr can offset ordinary (W-2) income if you actively participate and your MAGI is under $100k (phasing out to $0 by $150k); unused losses carry forward. On sale, claimed depreciation is recaptured at up to 25%, and gains may owe capital-gains tax (a 1031 exchange can defer both). Figures are a year-1 estimate at your 24.0% rate — not tax advice; consult a CPA.
Condition & rehab AI · 12 photos
This home requires moderate renovations to update the kitchen and bathroom, and some landscaping improvements to increase its value.
Repairs flagged
- Major kitchen cabinets — dated and in poor condition
- Major kitchen countertops — dated and in poor condition
- Major kitchen appliances — dated and in poor condition
- Major bathroom vanity — dated and in poor condition
- Minor landscaping — overgrown yard
Value-add opportunities
- Resale update kitchen cabinets, countertops, and appliances — modernizing the kitchen will attract more buyers
- Resale update bathroom vanity and fixtures — modernizing the bathroom will attract more buyers
- Both landscaping and curb appeal — improving the exterior will increase both resale and rental value
Renovation cost estimate screening
| Repair item | Severity | Est. cost |
|---|---|---|
| kitchen cabinets · dated and in poor condition | Major | $15,000–50,000 |
| kitchen countertops · dated and in poor condition | Major | $15,000–50,000 |
| kitchen appliances · dated and in poor condition | Major | $15,000–50,000 |
| bathroom vanity · dated and in poor condition | Major | $15,000–50,000 |
| landscaping · overgrown yard | Minor | $500–3,000 |
| Total estimated repair cost · 5 items | $60,500–203,000 |
Value-add ROI direction
- Resale update kitchen cabinets, countertops, and appliances — modernizing the kitchen will attract more buyers ↑
- Resale update bathroom vanity and fixtures — modernizing the bathroom will attract more buyers ↑
- Both landscaping and curb appeal — improving the exterior will increase both resale and rental value ↑
ⓘ Cost ranges are severity-bucket heuristics (US national rule-of-thumb). Get contractor quotes + a written scope before underwriting a rehab budget.
Schools (NCES district)
- District
- Charleston 01
- NCES district ID
- 4501440
- Math proficiency
- 48% ▼ -2.00%
- Reading proficiency
- 53% ▬ 0.00%
- Median HH income
- $52,376
- Composite
- 43.41/100
- National rank
- #3018
- State rank
- #7 of 80 in SC
Livability — North Charleston
- Score
- 66/100
- State rank
- #122
- US rank
- #12222
Category grades
Schools grade is shown separately in the Schools card above.
Census & demographics
- Census place
- North Charleston, SC
- County
- Charleston County · 366,793 people
- City population
- 108,266
- Metro
- Charleston-North Charleston, SC
- Population (ZIP)
- 32,001
- Household income
- $49,815
- Rent vs Own
- Severe rent burden
- 2054.0
Population outlook (Charleston County) Hauer SSP2
- Today (2025)
- 480,562 people
- By 2030
- 525,921 · +9.4%
- By 2040
- 612,189 · +27.4%
- By 2050
- 691,627 · +43.9%
- By 2075
- 847,979 · +76.5%
- By 2100
- 926,482 · +92.8%
Race, ethnicity, and origin ACS 2023
- Neighborhood character
- Diverse neighborhood (Simpson 0.70)
- Race & ethnicity
- Black 40% White 32% Hispanic / Latino 19% Two or more races 9% Asian 3%
- Hispanic origin (detail)
- Mexican 10% Puerto Rican 1%
- Common ancestry
- Romanian 1% Italian 1% Lithuanian 1%
- Foreign-born
- 15% · Canada, Vietnam
- Languages at home
- 79% English-only · Spanish 17% Vietnamese 1% Tagalog/Filipino 1%
Political lean MEDSL · Charleston
- 2024 margin
- Lean D (+5.7) · D 51.9% · R 46.3% · Other 1.8%
- 2008→2024 swing
- -2.7pp toward R · 2008: 8.3pp · 2024: 5.7pp
- All cycles
- 2024: D+5.7 2020: D+12.9 2016: D+7.9 2012: D+2.4 2008: D+8.3
Not yet ingested
- Civics
- —
Market trends
- HPI YoY
- ▼ -27.09%
- Current HPI
- 374.9164
- Rent YoY
- ▲ 1.37%
- Metro
- Charleston-North Charleston, SC
- State GDP YoY
- ▲ 4.51%
- F500 in state
- 2
Industry mix (Fortune 500 HQ in SC)
| Industry | F500 HQs | Revenue |
|---|---|---|
| Packaging | 1 | $7B |
|
||
Price history
+91.8% since first listed3 events — show timeline
- 2026-04-30 Listed $189,900 Charleston Trident MLS
- 2006-06-28 Sold (MLS) $100,000 Charleston Trident MLS
- 2006-03-07 Listed $99,000 Charleston Trident MLS
Cash-flow waterfall
monthlySold comps — $/sqft
last 12 mo · ≤1 miLoading sold comps…