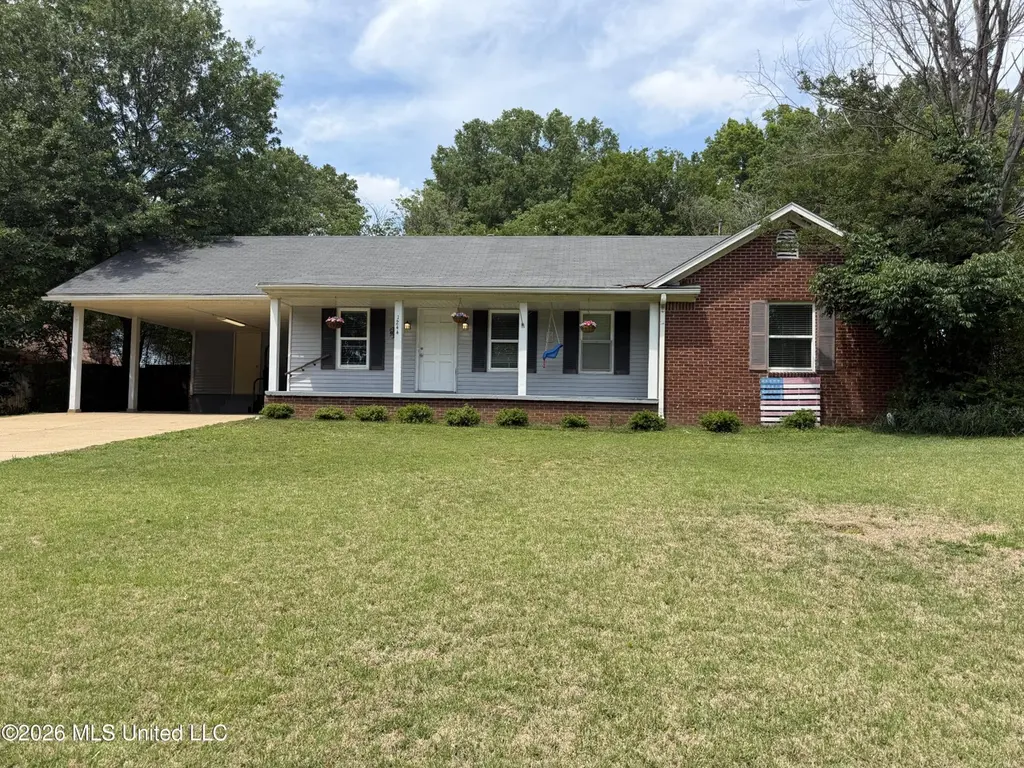
1244 S Cedar Cir · Southaven, MS
Flood risk 1/10 · Minimal
- FEMA flood zone
- X (unshaded)
- Chance of flooding over 30 yrs
- 0.0%
- Est. flood insurance / yr
- $507 – $1,088
Fire risk 2/10 · Minimal
- Est. fire insurance / yr
- $1,241 – $2,305
Heat risk 6/10 · Moderate
- Hot days now (above 109°F)
- 7 days/yr
- Hot days in 30 yrs
- 21 days/yr
Wind risk 4/10 · Minor
- Chance of severe wind over 30 yrs
- 20.0%
Air-quality risk 2/10 · Minimal
- Unhealthy air days now
- 2 days/yr
- Unhealthy air days in 30 yrs
- 2 days/yr
Risk factors via First Street. Map © Google.
Why this score? — see what drove the D grade
The composite is a weighted blend of 9 inputs, each scored 0–100. Each bar is that input's sub-score; the figure is the points it added to the 100-point composite (weight × sub-score).
- Cash flow +14.7/30.0
- ARV discount +6.0/15.0
- DSCR +4.5/10.0
- Schools +4.0/10.0
- Rent growth +3.3/5.0
- Livability +3.2/5.0
- 1% rule +3.1/10.0
- Condition / age +2.5/5.0
- Appreciation +0.0/10.0
$200,000
🖨 Deal sheet (PDF) 📄 Offer letter ✓ Due diligence
Listing remarks MLS
COZY 3BD/2BA MOVE IN READY HOME IN CARRIAGE HILLS. NEW FLOORING AND FRESH PAINT THROUGHOUT HOUSE. LIVING ROOM AND DEN ARE OPEN TOGETHER CREATING AN EXTRA LARGE ROOM. KITCHEN CABINETS AND COUNTER TOPS HAVE BEEN REMODELED. TILE FLOORS IN KITCHEN AND BATHROOMS. SEPARATE DINING ROOM. FORMAL EAT IN KITCHEN WITH BEAUTIFUL BAY WINDOW OVERLOOKING BACK PATIO WITH FENCED BACKYARD. BEAUTIFUL COVERED FRONT PORCH WITH 2 CAR CARPORT.
Key facts
- Functional kitchen
- Beautiful bay window
- Fenced backyard
Tags
Property features AI
Exterior
- Parking: 2-space carport; Paved parking
- Security: Dead bolt locks
- Utilities: Public water; Public sewer; Cable available; Water available; Sewer available
- Home design: Single-family house; One story; Brick and brick veneer construction; Entry on main level
- Construction: Asphalt shingle roof; Slab foundation; Built with brick/brick veneer
- Exterior features: Patio; Private yard; Chain link fencing; Level lot
Interior
- Kitchen: Dishwasher; Electric range
- Flooring: Laminate; Simulated wood
- Bathrooms: 2 full bathrooms
- Heating & cooling: Central heating; Central air conditioning
- Interior features: Ceiling fans; Eat-in kitchen; Bay window(s); Dead bolt locks
- Laundry & utility: Indoor laundry room
Neighborhood map
What this means for you Summary
Snapshot
- This is a 3-bed/2.0-bath single-family listed at $200k.
Deal economics
- At list price, monthly cash flow is $50 ($596/yr) — positive.
- The deal already cash-flows at list — no discount required.
- To meet the 1% rule (rent ≥ 1% of price), the offer needs to be $163k (18.6% below list).
- Recommended offer: $163k (18.6% below list) — sets the bar for 1% rule.
- Cap rate 6.6% vs local median 5.2% in Southaven — meaningfully above typical; check what's discounted (condition, days-on-market, listing class) to confirm the premium yield is real.
Location & tenants
- Location reads 65/100 on livability (#107 in MS) — a middle-class / working-renter tenant base. Strengths: cost of living A+, housing A+; Watch: amenities F, commute F, health & safety F.
- Desoto County School District (suburban): math 48% / reading 42% proficiency, ranked #20 of 130 in MS (top 15%) — families likely to look elsewhere, expect single-tenant / working-renter base with shorter leases.
- Zoned schools: Southaven Elementary (math 20% / reading 23%, grade F, #239 of 375 statewide, top 64%, 684 students, 100% FRL); Southaven Middle School (math 33% / reading 25%, grade F, #90 of 179 statewide, top 52%, 1,456 students, 100% FRL); Southaven High School (math 26% / reading 35%, grade F, #88 of 197 statewide, top 45%, 1,850 students, 100% FRL) — zoned schools average 100% FRL vs 43% district-wide (56 pts higher); higher-poverty schools than district average — tighter screening recommended.
- Zoned-school proficiency averages 27% at this address vs 45% district-wide (-18 pts) — the specific schools serving this property underperform the Desoto County School District average; the district grade overstates school quality for this exact location.
- Market conditions: Rents rising (+3.2%/yr); 196 active listings in the ZIP; 36 comparable units currently listed for rent nearby; rentals at typical pace (median 26d on market — plan ~3-4 weeks tenant-placement turnaround); 1,155 units permitted in DeSoto County in 2024 (0 in 5+ unit buildings).
- This rent runs 32% of the median local income ($62k/yr) — at the standard rent-burdened threshold; future hikes will face affordability resistance.
Forward outlook
- Local home prices are declining (-3.0%/yr); year-one equity from $1k of loan paydown is wiped out by about $6k of value loss. Plan a longer hold.
- DeSoto County population projected at +33% by 2050 — long-run rental-demand tailwind backs the buy-and-hold thesis.
Negotiation context
- Only 14 days on market — expect competitive offers; lowballing is unlikely to land.
- 5 sale attempts since 21y ago with the ask held roughly flat each time — persistent listings suggest the price (not the market) is what's stuck; bring a comps-based counter.
Risks & watch-outs
- Climate carrying-cost: extreme-heat days projected 7→21/yr by 2055 (HVAC capex compounding) — expect insurance premiums to compound above CPI over the hold.
Questions for the listing agent
- Built in 1969 — when were the roof, HVAC, electrical panel, plumbing, and water heater last replaced?
- Is there a deadline driving the sale (1031 exchange, divorce, estate, relocation)? That informs how much negotiation room exists.
- Schools are D-rated, which usually means shorter tenancies and higher turnover. Who's the typical renter profile here, and what's been the actual vacancy rate?
- The area grade is low — what's the realistic commute time and amenity access for the typical tenant pool here? Any planned neighborhood developments (good or bad) we should know about?
- What's the average days-on-market for RENTAL listings here right now (not sales)? A rising rental-DOM trend means longer vacancies and softer asking-rent achievability than the comps imply.
- What's the recent tenant-quality profile in this submarket — average credit score on applications, eviction rate, late-payment / NSF rate, and stable-employment percentage? A property-management company in the area should have these aggregated.
- How much new for-sale + rental construction is in the pipeline within 1–3 miles? Heavy new supply typically softens prices + rents 12–24 months out; constrained supply supports both.
Investment metrics
- 1% rule
- 0.81% ✗
- Cap rate
- 6.59%
- Cash-on-cash
- 1.06%
- DSCR
- 1.05
- GRM
- 10.2
CMA / ARV
- ARV (on-the-fly)
- $193,404
- Comps found
- 12
Show comp detail 12 sales within ~0.75 mi
| Address | Dist | Beds/Ba | Sqft | Sold | Price | $/sf | Match |
|---|---|---|---|---|---|---|---|
| 8590 W Cedar Cir | 0.08mi | 3/2.0 | 1,500 (+10%) | 4mo | $209,900 | $140 | 76 |
| 1734 Brookhaven Dr | 0.62mi | 3/2.0 | 1,349 (-1%) | 6mo | $165,000 | $122 | 65 |
| 1366 Carriage View Ln | 0.60mi | 3/2.0 | 1,290 (-5%) | 1mo | $218,000 | $169 | 62 |
| 7966 S Chesterfield Dr | 0.59mi | 3/2.5 | 1,400 (+3%) | 8mo | $165,000 | $118 | 59 |
| 1135 Claiborne Dr | 0.47mi | 3/2.0 | 1,488 (+9%) | 8mo | $220,000 | $148 | 56 |
| 1442 Vicksburg Dr | 0.60mi | 3/1.5 | 1,538 (+13%) | 1mo | $199,900 | $130 | 48 |
| 1818 Whitehead Dr | 0.58mi | 3/1.0 | 1,197 (-12%) | 2mo | $165,000 | $138 | 47 |
| 1884 S Conerly Dr | 0.68mi | 3/1.5 | 1,200 (-12%) | 2mo | $185,000 | $154 | 45 |
| 1500 Vicksburg Dr | 0.63mi | 3/1.5 | 1,169 (-14%) | 1mo | $209,000 | $179 | 44 |
| 7843 S Chesterfield Dr | 0.69mi | 2/2.0 (-1) | 1,260 (-8%) | 7mo | $204,000 | $162 | 44 |
| 7881 Chesterfield Dr | 0.66mi | 3/2.0 | 1,563 (+15%) | 2mo | $219,000 | $140 | 43 |
| 1518 Town And Country Dr | 0.74mi | 3/1.0 | 1,166 (-14%) | 1mo | $165,000 | $142 | 37 |
Match score weights: distance 35% · size 25% · config 20% · recency 20%. Top-matched comps best support the ARV.
Projected returns pro-forma
-3.0% appreciation · 3.2% rent growth · sell at horizon
- IRR
- -14.4%
- Equity multiple
- 0.48×
- Total profit
- $-28,983
- Equity at exit
- $29,821
- IRR
- -5.5%
- Equity multiple
- 0.64×
- Total profit
- $-20,078
- Equity at exit
- $17,292
Cash invested: $56,000 (down + closing). Projections, not guarantees.
Landlord ↔ Tenant lean methodology
- Overall (STATE)
- 90 Strongly Landlord-Friendly
- State Mississippi
- 90 Strongly Landlord-Friendly · R+11
- County
- — inherits STATE
- City
- — inherits STATE
ZIP-level market 38671
- Home prices YoY
- -18.2%
- Rents YoY
- 3.2%
- Active inventory
- 196
- Price-to-rent
- 10.2×
Monthly cashflow live
- Estimated rent
- $1,628 high interval (Pro) →
- Mortgage (P&I)
- −$1,049
- Tax from tax record
- −$104 /mo · $1,248/yr
- Insurance
- −$83
- HOA
- −$0
- Vacancy / Maint / Mgmt
- −$342
- Net cashflow
- $50
Break-even live
Sensitivity live
| Price | -10% $163 | -5% $106 | +0% $50 | +5% $-7 | +10% $-64 |
|---|---|---|---|---|---|
| Rent | -10% $-79 | -5% $-15 | +0% $50 | +5% $114 | +10% $178 |
| Rate | -1.0pp $150 | -0.5pp $101 | base $50 | +0.5pp $-2 | +1.0pp $-55 |
UW: 25.0% down · 7.5% · 30yr · 1.5% tax · 5.0% vac · 8.0% maint · 8.0% mgmt
Financing live
Cash to close
- Down payment
- $50,000
- Closing costs
- $6,000
- Reserves months
- —
- Total cash needed
- —
Loan-product check · same deal, 3 products live
Conventional
25% down · 7.5% · 30yr
- Down + closing
- —
- Monthly P&I
- —
- Monthly cashflow
- —
- DSCR
- —
- Eligible?
- —
Personal DTI + credit; lowest rate.
DSCR
20% down · 8.5% · 30yr
- Down + closing
- —
- Monthly P&I
- —
- Monthly cashflow
- —
- DSCR
- —
- Eligible?
- —
No personal income docs; deal must DSCR.
Hard money
10% down · 12.0% · 12mo
- Down + closing
- —
- Monthly P&I
- —
- Monthly cashflow
- —
- DSCR
- —
- Eligible?
- —
Short-term bridge; refi at stabilization.
Rent comps 36 comps
| Address | Beds | Baths | Sqft | Rent | $/sqft | DOM | Units | Dist |
|---|---|---|---|---|---|---|---|---|
| 8694 Yorktown Dr Southaven, MS | 3.0 | 2.0 | 1556 | $1,703 | $1.09 | 45d | 1 | 0.11mi |
| 1344 Brandywine Dr Southaven, MS | 4.0 | 2.0 | 1473 | $1,595 | $1.08 | 13d | 1 | 0.16mi |
| 1416 Moss Point Dr Southaven, MS | 3.0 | 1.0 | 1197 | $1,533 | $1.28 | 45d | 1 | 0.33mi |
| 8282 Fayette Cv Southaven, MS | 3.0 | 1.5 | 1297 | $1,545 | $1.19 | 16d | 1 | 0.37mi |
| 842 Farmington Dr N Southaven, MS | 3.0 | 2.0 | 1400 | $1,595 | $1.14 | 6d | 1 | 0.41mi |
| 1449 Ticonderoga Dr Southaven, MS | 4.0 | 1.5 | 1447 | $1,623 | $1.12 | 25d | 1 | 0.43mi |
| 1699 Whitehead Dr Southaven, MS | 3.0 | 1.0 | 1000 | $1,195 | $1.20 | 45d | 1 | 0.44mi |
| 8297 Baldwyn Cv Southaven, MS | 3.0 | 1.0 | 1065 | $1,323 | $1.24 | 25d | 1 | 0.45mi |
| 8328 Dottley Dr Southaven, MS | 3.0 | 2.0 | 1184 | $1,573 | $1.33 | 45d | 1 | 0.47mi |
| 1319 Stateline Rd W Southaven, MS | 3.0 | 1.5 | 1189 | $1,395 | $1.17 | 6d | 1 | 0.47mi |
| 1210 Rasco Rd W Southaven, MS | 3.0 | 2.0 | 1638 | $1,695 | $1.03 | 6d | 1 | 0.51mi |
| 1732 Carla Cv Southaven, MS | 4.0 | 1.5 | 1196 | $1,600 | $1.34 | 6d | 1 | 0.52mi |
| 1296 Vicksburg Dr Southaven, MS | 3.0 | 1.0 | 1000 | $1,250 | $1.25 | 25d | 1 | 0.55mi |
| 8280 Hastings Cv Southaven, MS | 3.0 | 1.5 | 1184 | $1,350 | $1.14 | 23d | 1 | 0.62mi |
| 5572 Lochinvar Dr Southaven, MS | 3.0 | 1.0 | 1065 | $1,090 | $1.02 | 45d | 1 | 0.66mi |
| 4896 Lochinvar Dr Southaven, MS | 3.0 | 1.5 | 1112 | $1,081 | $0.97 | 23d | 1 | 0.66mi |
| 8228 Brooksville Cv Southaven, MS | 3.0 | 2.0 | 1576 | $1,695 | $1.08 | 6d | 1 | 0.71mi |
| 1590 Custer Dr Southaven, MS | 3.0 | 1.0 | 900 | $1,295 | $1.44 | 22d | 1 | 0.74mi |
| 1842 Brookhaven Dr Southaven, MS | 3.0 | 1.0 | 1200 | $1,395 | $1.16 | 6d | 1 | 0.76mi |
| 8254 Pinebrook Dr Southaven, MS | 3.0 | 1.0 | 1095 | $1,385 | $1.26 | 45d | 1 | 0.85mi |
| 7661 Ragland Pl Southaven, MS | 3.0 | 2.0 | 1242 | $1,793 | $1.44 | 45d | 1 | 0.88mi |
| 7658 Davis Pkwy Southaven, MS | 3.0 | 3.0 | 1513 | $1,995 | $1.32 | 19d | 1 | 0.88mi |
| 8349 Cedarbrush Dr Southaven, MS | 3.0 | 1.5 | 1200 | $1,395 | $1.16 | 45d | 1 | 0.89mi |
| 7605 Davis Pkwy Southaven, MS | 3.0 | 2.0 | 1351 | $1,710 | $1.27 | 25d | 1 | 0.93mi |
| 7560 Chesteridge Ave Southaven, MS | 1.0–3.0 | 1.0–2.0 | 887 | $1,475 | $1.66 | 3d | 7 | 0.99mi |
| 1748 Newington Cv Southaven, MS | 3.0 | 1.5 | 1124 | $1,500 | $1.33 | 25d | 1 | 1.03mi |
| 8495 Charleston Dr Southaven, MS | 3.0 | 1.5 | 1450 | $1,345 | $0.93 | 16d | 1 | 1.03mi |
| 1984 Custer Dr Southaven, MS | 3.0 | 2.0 | 1131 | $1,523 | $1.35 | 45d | 1 | 1.03mi |
| 1766 Dorchester Dr Southaven, MS | 3.0 | 2.0 | 1200 | $1,585 | $1.32 | 25d | 1 | 1.10mi |
| 7594 Rockingham Dr Southaven, MS | 3.0 | 1.5 | 1680 | $1,665 | $0.99 | 45d | 1 | 1.10mi |
| 8082 Whitebrook Dr Southaven, MS | 3.0 | 1.0 | 1100 | $1,495 | $1.36 | 25d | 1 | 1.18mi |
| 1000 Sutton Pl Horn Lake, MS | 2.0 | 2.0 | 1100 | $1,540 | $1.40 | 46d | 1 | 1.20mi |
| 98 Stonebrook Cv Southaven, MS | 4.0 | 2.0 | 1451 | $1,500 | $1.03 | 45d | 1 | 1.23mi |
| 7087 Carrolton Dr W Southaven, MS | 3.0 | 2.0 | 1594 | $1,500 | $0.94 | 46d | 1 | 1.23mi |
| 7757 Charleston Dr Southaven, MS | 4.0 | 2.0 | 1325 | $1,650 | $1.25 | 25d | 1 | 1.30mi |
| 2179 Coral Hills Dr Southaven, MS | 4.0 | 1.5 | 1451 | $1,395 | $0.96 | 23d | 1 | 1.32mi |
Listing history 14 events
-
2026-06-02statusdays on market $200,000 Pending 14 DOM
-
2026-06-01days on market $200,000 Active 13 DOM
-
2026-05-31days on market $200,000 Active 12 DOM
-
2026-05-19$200,000 Active
-
2019-08-20soldstatus
-
2019-08-15soldstatus 423-char remark
Show marketing remark (423 chars)
COZY 3BD/2BA MOVE IN READY HOME IN CARRIAGE HILLS. NEW FLOORING AND FRESH PAINT THROUGHOUT HOUSE. LIVING ROOM AND DEN ARE OPEN TOGETHER CREATING AN EXTRA LARGE ROOM. KITCHEN CABINETS AND COUNTER TOPS HAVE BEEN REMODELED. TILE FLOORS IN KITCHEN AND BATHROOMS. SEPARATE DINING ROOM. FORMAL EAT IN KITCHEN WITH BEAUTIFUL BAY WINDOW OVERLOOKING BACK PATIO WITH FENCED BACKYARD. BEAUTIFUL COVERED FRONT PORCH WITH 2 CAR CARPORT.
-
2019-05-28$135,000 423-char remark
Show marketing remark (423 chars)
COZY 3BD/2BA MOVE IN READY HOME IN CARRIAGE HILLS. NEW FLOORING AND FRESH PAINT THROUGHOUT HOUSE. LIVING ROOM AND DEN ARE OPEN TOGETHER CREATING AN EXTRA LARGE ROOM. KITCHEN CABINETS AND COUNTER TOPS HAVE BEEN REMODELED. TILE FLOORS IN KITCHEN AND BATHROOMS. SEPARATE DINING ROOM. FORMAL EAT IN KITCHEN WITH BEAUTIFUL BAY WINDOW OVERLOOKING BACK PATIO WITH FENCED BACKYARD. BEAUTIFUL COVERED FRONT PORCH WITH 2 CAR CARPORT.
-
2011-08-25historical
-
2011-06-26$79,900
-
2011-02-18historical
-
2010-09-10$99,000
-
2006-01-16historical
-
2005-07-18$106,000
-
2005-01-18soldstatus
ⓘ Source: listings_history table (triggers on properties + properties_extension) + one-shot
backfill from property_details.listing_events for pre-trigger history.
Tax reassessment forecast MS · Resets to sale price
- Current annual tax
- $1,248 · $104/mo
- Projected year-2 tax
- $1,580 · $132/mo
- Expected delta
- +$332/yr (+$28/mo · 26.6%)
ⓘ Screening estimate from a state-policy table — verify with the county assessor before closing.
Climate risk First Street
- Flood 1/10 Low FEMA zone X (unshaded) · 0% chance over 30 yrs
- Wildfire 2/10 Low
- Heat 6/10 Major 7 d/yr ≥109°F today · 21 d/yr by 30 yrs out
- Wind 4/10 Moderate 20% chance of damaging wind over 30 yrs
- Air quality 2/10 Low 2 unhealthy d/yr today · 2 by 30 yrs out
Nearby sold comps map
Loading sold comps map…
Walkable amenities ~0.75 mi
Loading nearby amenities…
Taxation est. · year 1
- Rental income
- $19,531
- − Mortgage interest
- −$11,203
- − Property taxes
- −$1,248
- − Insurance
- −$1,000
- − Repairs & maintenance
- −$1,563
- − Management
- −$1,563
- − Depreciation
- −$5,818
- Taxable loss
- −$2,863
- Est. tax savings @ 24.0%
- +$687
- After-tax cash flow
- $1,283/yr
For passive investors: Depreciation is non-cash, so a rental often shows a tax loss while cash-flowing — sheltering income. Rental losses are passive: they offset passive income freely, and up to $25,000/yr can offset ordinary (W-2) income if you actively participate and your MAGI is under $100k (phasing out to $0 by $150k); unused losses carry forward. On sale, claimed depreciation is recaptured at up to 25%, and gains may owe capital-gains tax (a 1031 exchange can defer both). Figures are a year-1 estimate at your 24.0% rate — not tax advice; consult a CPA.
Schools (NCES district)
- District
- Desoto County School District
- NCES district ID
- 2801320
- Math proficiency
- 48% ▼ -13.00%
- Reading proficiency
- 42% ▼ -6.00%
- Median HH income
- $59,272
- Composite
- 39.56/100
- National rank
- #3933
- State rank
- #20 of 130 in MS
Livability — Southaven
- Score
- 65/100
- State rank
- #107
- US rank
- #12584
Category grades
Schools grade is shown separately in the Schools card above.
Census & demographics
- Census place
- Southaven, MS
- County
- DeSoto County · 176,513 people
- City population
- 53,755
- Metro
- Memphis, TN-MS-AR
- Population (ZIP)
- 37,319
- Household income
- $61,843
- Rent vs Own
- Severe rent burden
- 1583.0
Population outlook (DeSoto County) Hauer SSP2
- Today (2025)
- 203,338 people
- By 2030
- 217,692 · +7.1%
- By 2040
- 245,320 · +20.6%
- By 2050
- 270,133 · +32.8%
- By 2075
- 323,341 · +59.0%
- By 2100
- 348,742 · +71.5%
Race, ethnicity, and origin ACS 2023
- Neighborhood character
- Diverse neighborhood (Simpson 0.58)
- Race & ethnicity
- White 49% Black 42% Hispanic / Latino 6% Two or more races 4%
- Hispanic origin (detail)
- Mexican 3%
- Common ancestry
- Italian 1% Lithuanian 1% Serbian 1%
- Foreign-born
- 3% · Canada
- Languages at home
- 95% English-only · Spanish 4%
Political lean MEDSL · DeSoto
- 2024 margin
- Strong R (+24.1) · D 36.7% · R 60.8% · Other 2.5%
- 2008→2024 swing
- +14.2pp toward D · 2008: -38.2pp · 2024: -24.1pp
- All cycles
- 2024: R+24.1 2020: R+23.9 2016: R+34.8 2012: R+33.5 2008: R+38.2
Not yet ingested
- Civics
- —
Market trends
- HPI YoY
- ▼ -49.08%
- Current HPI
- 220.7875
- Rent YoY
- ▲ 3.20%
- Metro
- Memphis, TN-MS-AR
- State GDP YoY
- —
- F500 in state
- 0
Price history
+88.7% since first listed11 events — show timeline
- 2026-05-19 Listed $200,000 MLSU
- 2019-08-20 Sold (Public Records) — Public Records
- 2019-08-15 Sold (MLS) — MLSU
- 2019-05-28 Listed $135,000 MLSU
- 2011-08-25 Listing Removed — MLSU
- 2011-06-26 Listed $79,900 MLSU
- 2011-02-18 Listing Removed — MLSU
- 2010-09-10 Listed $99,000 MLSU
- 2006-01-16 Listing Removed — MLSU
- 2005-07-18 Listed $106,000 MLSU
- 2005-01-18 Sold (Public Records) — Public Records
Property tax history
-1.7%/yrLatest (2025): $1,248 · +10.3% YoY. Source: county tax records.
Cash-flow waterfall
monthlySold comps — $/sqft
last 12 mo · ≤1 miLoading sold comps…