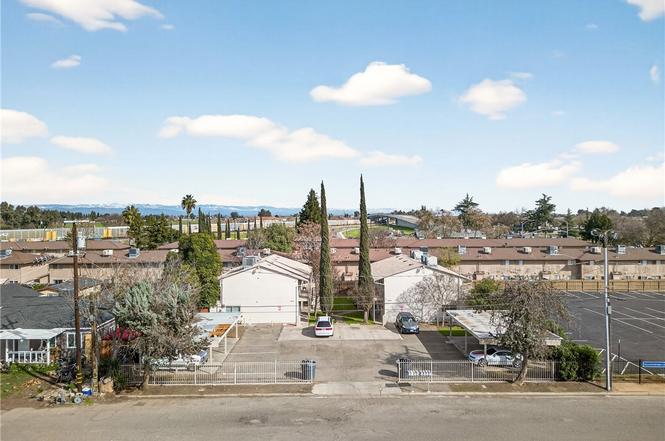
 8-Plex
1962-1976 Edwards · Merced, CA
Flood risk 5/10 · Moderate
- FEMA flood zone
- AO
- Chance of flooding over 30 yrs
- 0.44%
- Est. flood insurance / yr
- $848 – $2,087
Fire risk 8/10 · Major
- Est. fire insurance / yr
- $659 – $1,223
Heat risk 7/10 · Major
- Hot days now (above 104°F)
- 7 days/yr
- Hot days in 30 yrs
- 17 days/yr
Wind risk 1/10 · Minimal
- Chance of severe wind over 30 yrs
- —
Air-quality risk 10/10 · Severe
- Unhealthy air days now
- 38 days/yr
- Unhealthy air days in 30 yrs
- 40 days/yr
Risk factors via First Street. Map © Google.
Why this score? — see what drove the D grade
The composite is a weighted blend of 9 inputs, each scored 0–100. Each bar is that input's sub-score; the figure is the points it added to the 100-point composite (weight × sub-score).
- Cash flow +14.9/30.0
- ARV discount +7.5/15.0
- DSCR +4.6/10.0
- 1% rule +4.1/10.0
- Livability +3.7/5.0
- Rent growth +3.5/5.0
- Schools +2.8/10.0
- Condition / age +2.5/5.0
- Appreciation +0.0/10.0
$1,165,000
🖨 Deal sheet (PDF) 📄 Offer letter ✓ Due diligence
Multi-family units
County records classify this as Multi-Family (5+ Unit). Listing-text estimate: 8 units. confirmed
5+ unit building — per-unit beds/baths from public records are typically unavailable; the breakdown below (if shown) is an estimate from the listing text.
Listing remarks
Exceptional investment opportunity in Merced, CA! This well-maintained 8-unit apartment building features (8) spacious 2-bedroom, 1-bathroom units, each approximately 850 square feet. The property offers a strong unit mix that appeals to long-term tenants, making it an ideal addition to any investor’s portfolio. Each unit provides functional floor plans with comfortable living spaces, sizable bedrooms, and practical layouts designed for everyday living. With consistent rental demand in the Merced area and proximity to shopping, schools, public transportation, and UC Merced, this property is well-positioned for stable occupancy and future growth. Whether you’re looking to expand
Key facts
- Proximity to schools
- Strong unit mix
- 0.37 acre lot
Tags
Property features AI
Finance
- Financial info: Total building area 6,800; Total of 8 units (6 leased); Gross scheduled income $9,363; Net operating income $8,731; Operating expense $632; Total expenses $16,379; Insurance expense $7,464; Gardener expense $1,680; Pest control expense $1,080; Trash expense $275; Water/sewer expense $280; Vacancy allowance 2450; Tenant pays gas and electricity
- HOA & community: Curbs and street lighting
Exterior
- Parking: Total 14 parking spaces; Eight carport spaces; Six uncovered spaces; Assigned and guest parking; Driveway with concrete and asphalt
- Utilities: 220V electric throughout; Public sewer; District/public water; Eight separate gas meters; Eight separate electric meters
- Home design: Attached property across two buildings; Two stories; Has a view; Entry level: 1
- Construction: Frame and stucco construction; Composition roof; Concrete slab foundation; Estimated year built
- Exterior features: Wood and wrought iron fencing; Landscaped grounds with backyard; No pool
Interior
- Kitchen: All units include a refrigerator and electric range; All units have disposals
- Bedrooms: Eight 2-bedroom units (unfurnished)
- Bathrooms: Each unit has one full bathroom
- Heating & cooling: Central cooling; Central furnace heating
- Interior features: Carbon monoxide detector(s); Smoke detector
- Laundry & utility: Laundry area in closet or shared area; Washer and dryer included
Neighborhood map
What this means for you Summary
Snapshot
- This is a 8 × 2-bed/1.0-bath units multifamily listed at $1.17M.
Deal economics
- At list price, monthly cash flow is $226 ($3k/yr) — positive. Per door: $28/mo.
- The deal already cash-flows at list — no discount required.
- To meet the 1% rule (rent ≥ 1% of price), the offer needs to be $1.06M (8.7% below list).
- Recommended offer: $1.06M (9.0% below list) — sets the bar for market timing.
- Cap rate 6.7% vs local median 3.4% in Merced — top-decile yield for the area; either an underpriced asset or a hidden risk that comps aren't pricing in. Stress-test before assuming the spread holds.
Location & tenants
- Location reads 73/100 on livability (#153 in CA) — a middle-class / working-renter tenant base. Strengths: amenities A+, commute A+, housing A+; Watch: employment D, crime F, cost of living F.
- Merced Union High (urban): math 20% / reading 46% proficiency, ranked #301 of 517 in CA (top 58%) — families likely to look elsewhere, expect single-tenant / working-renter base with shorter leases.
- Zoned schools: Charles Wright Elementary (563 students, 80% FRL); Herbert Hoover Middle (614 students, 79% FRL); Golden Valley High (math 20% / reading 46%, grade F, #667 of 1,170 statewide, top 57%, 1,956 students, 81% FRL).
- Market conditions: Rents rising fast (+4.1%/yr); 140 active listings in the ZIP; 459 units permitted in Merced County in 2024 (0 in 5+ unit buildings).
- At $10,632/mo this rent would consume 179% of the median local household income ($71k/yr) (locally 1947% of renters already pay >50% of income on rent) — very limited rent-growth headroom before tenants either downsize or default.
Forward outlook
- Local home prices are declining (-3.0%/yr); year-one equity from $8k of loan paydown is wiped out by about $35k of value loss. Plan a longer hold.
- Merced County population projected at +12% by 2050 — modest demand growth; plan on rents tracking national, not racing it.
Negotiation context
- It's been on market 116 days — a 9% lower offer ($1.06M) is reasonable based on typical stale-listing flexibility.
Risks & watch-outs
- Watch-outs: flood insurance adds $122/mo.
- Climate carrying-cost: in FEMA flood zone AO (mandatory federal flood insurance); severe wildfire risk; extreme-heat days projected 7→17/yr by 2055 (HVAC capex compounding) — expect insurance premiums to compound above CPI over the hold.
Questions for the listing agent
- It's been on market 116 days. Have you received any prior offers? Is the seller open to a 9% concession, seller financing, or rate buy-down credit?
- Can we see the unit-by-unit rent roll, current vacancy, and any below-market leases? What's the average tenancy length?
- What capital expenditures (roof, boiler, parking lot, exteriors) have been made in the last 5 years, and what's planned in the next 2?
- Built in 1979 — when were the roof, HVAC, electrical panel, plumbing, and water heater last replaced?
- What's the actual annual flood-insurance premium (NFIP or private), and is the property in a SFHA with mandatory coverage?
- Why hasn't it sold? Are there any deal-killer items the seller is aware of (foundation, flood, title, zoning, code violations)?
- Is there a deadline driving the sale (1031 exchange, divorce, estate, relocation)? That informs how much negotiation room exists.
- Schools are D-rated, which usually means shorter tenancies and higher turnover. Who's the typical renter profile here, and what's been the actual vacancy rate?
- Crime grade is F in this area — have there been break-ins, vandalism, or insurance claims at this property in the last 3 years? What carrier currently insures it and at what premium?
- The area grade is low — what's the realistic commute time and amenity access for the typical tenant pool here? Any planned neighborhood developments (good or bad) we should know about?
- What's the average days-on-market for RENTAL listings here right now (not sales)? A rising rental-DOM trend means longer vacancies and softer asking-rent achievability than the comps imply.
- What's the recent tenant-quality profile in this submarket — average credit score on applications, eviction rate, late-payment / NSF rate, and stable-employment percentage? A property-management company in the area should have these aggregated.
- How much new apartment / multifamily construction is in the pipeline within 1–3 miles? Heavy new supply (>2% of stock underway) typically softens rents 12–24 months out; light construction supports rent growth.
Investment metrics
- 1% rule
- 0.91% ✗
- Cap rate
- 6.65%
- Cash-on-cash
- 1.28%
- DSCR
- 1.06
- GRM
- 9.1
CMA / ARV
No comps found within radius.
Projected returns pro-forma
-3.0% appreciation · 4.07% rent growth · sell at horizon
- IRR
- -13.7%
- Equity multiple
- 0.50×
- Total profit
- $-162,587
- Equity at exit
- $173,705
- IRR
- -3.2%
- Equity multiple
- 0.77×
- Total profit
- $-73,577
- Equity at exit
- $100,728
Cash invested: $326,200 (down + closing). Projections, not guarantees.
Landlord ↔ Tenant lean methodology
- Overall (STATE)
- 18 Strongly Tenant-Friendly
- State California
- 18 Strongly Tenant-Friendly · D+13
- County
- — inherits STATE
- City
- — inherits STATE
ZIP-level market 95340
- Rents YoY
- 4.1%
- Active inventory
- 140
- Price-to-rent
- 73.0×
Monthly cashflow live
- Estimated rent
- $10,632 high interval (Pro) →
- Mortgage (P&I)
- −$6,109
- Tax est. 1.5%
- −$1,456 /mo · $17,475/yr
- Insurance
- −$485
- Flood insurance flood zone
- −$122 /mo · $1,468/yr
- HOA
- −$0
- Vacancy / Maint / Mgmt
- −$2,233
- Net cashflow
- $226
Break-even live
Sensitivity live
| Price | -10% $1,031 | -5% $628 | +0% $226 | +5% $-177 | +10% $-579 |
|---|---|---|---|---|---|
| Rent | -10% $-614 | -5% $-194 | +0% $226 | +5% $646 | +10% $1,066 |
| Rate | -1.0pp $813 | -0.5pp $522 | base $226 | +0.5pp $-76 | +1.0pp $-383 |
8-unit breakdown (identical units grouped — click to expand)
| Units | Beds | Baths | Est. rent |
|---|---|---|---|
| 8× units | 2 | 1 | $10,632 |
| #1 | 2 | 1 | $1,329 |
| #2 | 2 | 1 | $1,329 |
| #3 | 2 | 1 | $1,329 |
| #4 | 2 | 1 | $1,329 |
| #5 | 2 | 1 | $1,329 |
| #6 | 2 | 1 | $1,329 |
| #7 | 2 | 1 | $1,329 |
| #8 | 2 | 1 | $1,329 |
| Total (8 units) | $10,632 | ||
UW: 25.0% down · 7.5% · 30yr · 1.5% tax · 5.0% vac · 8.0% maint · 8.0% mgmt
Financing live
Cash to close
- Down payment
- $291,250
- Closing costs
- $34,950
- Reserves months
- —
- Total cash needed
- —
Loan-product check · same deal, 3 products live
Conventional
25% down · 7.5% · 30yr
- Down + closing
- —
- Monthly P&I
- —
- Monthly cashflow
- —
- DSCR
- —
- Eligible?
- —
Personal DTI + credit; lowest rate.
DSCR
20% down · 8.5% · 30yr
- Down + closing
- —
- Monthly P&I
- —
- Monthly cashflow
- —
- DSCR
- —
- Eligible?
- —
No personal income docs; deal must DSCR.
Hard money
10% down · 12.0% · 12mo
- Down + closing
- —
- Monthly P&I
- —
- Monthly cashflow
- —
- DSCR
- —
- Eligible?
- —
Short-term bridge; refi at stabilization.
Listing history 19 events
-
2026-06-21days on market $1,165,000 Active 116 DOM
-
2026-06-18days on market $1,165,000 Active 113 DOM
-
2026-06-17days on market $1,165,000 Active 112 DOM
-
2026-06-16days on market $1,165,000 Active 111 DOM
-
2026-06-15days on market $1,165,000 Active 110 DOM
-
2026-06-14days on market $1,165,000 Active 108 DOM
-
2026-06-13days on market $1,165,000 Active 107 DOM
-
2026-06-10days on market $1,165,000 Active 105 DOM
-
2026-06-09days on market $1,165,000 Active 104 DOM
-
2026-06-08days on market $1,165,000 Active 103 DOM
-
2026-06-07days on market $1,165,000 Active 102 DOM
-
2026-06-03pricedays on market $1,165,000 Active 98 DOM
-
2026-06-02days on market $1,210,000 Active 97 DOM
-
2026-06-01days on market $1,210,000 Active 96 DOM
-
2026-05-31days on market $1,210,000 Active 95 DOM
-
2026-05-30days on market $1,210,000 Active 94 DOM
-
2026-05-08price $1,210,000
-
2026-04-01price $1,250,000
-
2026-02-25$1,300,000 Active
ⓘ Source: listings_history table (triggers on properties + properties_extension) + one-shot
backfill from property_details.listing_events for pre-trigger history.
Climate risk First Street
- Flood 5/10 Major FEMA zone AO · 44% chance over 30 yrs
- Wildfire 8/10 Severe
- Heat 7/10 Severe 7 d/yr ≥104°F today · 17 d/yr by 30 yrs out
- Wind 1/10 Low
- Air quality 10/10 Extreme 38 unhealthy d/yr today · 40 by 30 yrs out
Nearby sold comps map
Loading sold comps map…
Walkable amenities ~0.75 mi
Loading nearby amenities…
Taxation est. · year 1
- Rental income
- $127,584
- − Mortgage interest
- −$65,258
- − Property taxes
- −$17,475
- − Insurance
- −$7,292
- − Repairs & maintenance
- −$10,207
- − Management
- −$10,207
- − Depreciation
- −$33,891
- Taxable loss
- −$16,746
- Est. tax savings @ 24.0%
- +$4,019
- After-tax cash flow
- $6,730/yr
For passive investors: Depreciation is non-cash, so a rental often shows a tax loss while cash-flowing — sheltering income. Rental losses are passive: they offset passive income freely, and up to $25,000/yr can offset ordinary (W-2) income if you actively participate and your MAGI is under $100k (phasing out to $0 by $150k); unused losses carry forward. On sale, claimed depreciation is recaptured at up to 25%, and gains may owe capital-gains tax (a 1031 exchange can defer both). Figures are a year-1 estimate at your 24.0% rate — not tax advice; consult a CPA.
Schools (NCES district)
- District
- Merced Union High
- NCES district ID
- 0624660
- Math proficiency
- 20% ▲ 3.00%
- Reading proficiency
- 46% ▼ -1.00%
- Median HH income
- $44,977
- Composite
- 28.11/100
- National rank
- #6823
- State rank
- #301 of 517 in CA
Livability — Merced
- Score
- 73/100
- State rank
- #153
- US rank
- #5111
Category grades
Schools grade is shown separately in the Schools card above.
Census & demographics
- County
- Merced County · 205,386 people
- City population
- 112,228
- Metro
- Merced, CA
- Population (ZIP)
- 38,303
- Household income
- $71,193
- Rent vs Own
- Severe rent burden
- 1947.0
Population outlook (Merced County) Hauer SSP2
- Today (2025)
- 285,501 people
- By 2030
- 293,437 · +2.8%
- By 2040
- 308,808 · +8.2%
- By 2050
- 321,011 · +12.4%
- By 2075
- 338,497 · +18.6%
- By 2100
- 330,493 · +15.8%
Race, ethnicity, and origin ACS 2023
- Neighborhood character
- Diverse neighborhood (Simpson 0.61)
- Race & ethnicity
- Hispanic / Latino 51% White 35% Two or more races 14% Asian 8% Black 3%
- Hispanic origin (detail)
- Mexican 48%
- Common ancestry
- Russian 4% Italian 2% Slovak 2%
- Foreign-born
- 15% · Canada, China
- Languages at home
- 64% English-only · Spanish 28% Other Asian/Pacific 3% Other Indo-European 2%
Political lean MEDSL · Merced
- 2024 margin
- Toss-up / Even · D 46.5% · R 50.9% · Other 2.6%
- 2008→2024 swing
- -12.7pp toward R · 2008: 8.3pp · 2024: -4.4pp
- All cycles
- 2024: R+4.4 2020: D+10.6 2016: D+7.9 2012: D+5.4 2008: D+8.3
Not yet ingested
- Civics
- —
Market trends
- HPI YoY
- ▼ -458.64%
- Current HPI
- 241.9343
- Rent YoY
- ▲ 4.07%
- Metro
- Merced, CA
- State GDP YoY
- ▲ 3.21%
- F500 in state
- 116
Industry mix (Fortune 500 HQ in CA)
| Industry | F500 HQs | Revenue |
|---|---|---|
| Technology | 27 | $1,492B |
|
||
| Financial Services | 3 | $174B |
|
||
| Retail | 3 | $44B |
|
||
| Insurance | 3 | $26B |
|
||
| Media / Entertainment | 2 | $115B |
|
||
| Pharmaceuticals / Biotech | 2 | $62B |
|
||
Price history
-6.9% since first listed3 events — show timeline
- 2026-05-08 Price Changed $1,210,000 CRMLS
- 2026-04-01 Price Changed $1,250,000 CRMLS
- 2026-02-25 Listed $1,300,000 CRMLS
Cash-flow waterfall
monthlySold comps — $/sqft
last 12 mo · ≤1 miLoading sold comps…