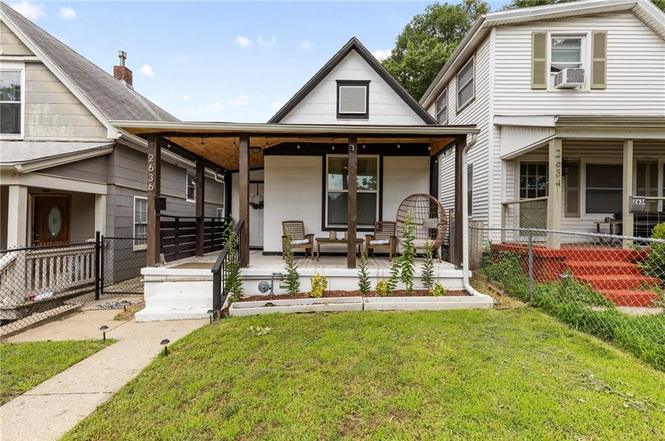
2636 Madison Ave · Kansas City, MO
Flood risk 1/10 · Minimal
- FEMA flood zone
- X (unshaded)
- Chance of flooding over 30 yrs
- 0.0%
- Est. flood insurance / yr
- $473 – $860
Fire risk 1/10 · Minimal
- Est. fire insurance / yr
- $1,054 – $1,958
Heat risk 4/10 · Minor
- Hot days now (above 106°F)
- 7 days/yr
- Hot days in 30 yrs
- 17 days/yr
Wind risk 2/10 · Minimal
- Chance of severe wind over 30 yrs
- —
Air-quality risk 3/10 · Minor
- Unhealthy air days now
- 2 days/yr
- Unhealthy air days in 30 yrs
- 3 days/yr
Risk factors via First Street. Map © Google.
Why this score? — see what drove the D- grade
The composite is a weighted blend of 9 inputs, each scored 0–100. Each bar is that input's sub-score; the figure is the points it added to the 100-point composite (weight × sub-score).
- Cash flow +15.8/30.0
- DSCR +4.9/10.0
- Livability +3.9/5.0
- 1% rule +3.7/10.0
- Rent growth +2.6/5.0
- Condition / age +2.5/5.0
- Schools +1.5/10.0
- ARV discount +1.3/15.0
- Appreciation +0.0/10.0
$215,000
🖨 Deal sheet (PDF) 📄 Offer letter ✓ Due diligence
Listing remarks MLS
Remodeled home in a great location. Walk to Boulevard Brewery, the Roasterie, Crown Center and Union Station. Granite countertops and newer appliances. New wood fenced back yard.
Key facts
- Mid-term rental
- Updated home
- Move-in-ready appeal
Tags
Property features AI
Exterior
- Parking: Other parking
- Utilities: Public water; Public sewer
- Home design: Single family residence; Bungalow/Ranch floor plan; Faces east
- Construction: Frame construction; Composition roof; Has basement (stone/rock foundation features)
- Exterior features: Patio; Porch; Metal and wood fencing; City lot
Interior
- Kitchen: Microwave; Refrigerator; Free-standing electric oven
- Bedrooms: 3 bedrooms (main floor primary bedroom)
- Flooring: Carpet; Wood
- Bathrooms: 1 full bathroom
- Heating & cooling: Natural gas heating; Electric cooling
- Interior features: Painted cabinets; Radon mitigation system
- Laundry & utility: Main level laundry room
Neighborhood map
What this means for you Summary
Snapshot
- This is a 2-bed/1.0-bath single-family listed at $215k.
Deal economics
- At list price, monthly cash flow is $98 ($1k/yr) — positive.
- The deal already cash-flows at list — no discount required.
- To meet the 1% rule (rent ≥ 1% of price), the offer needs to be $187k (13.1% below list).
- Recommended offer: $187k (13.1% below list) — sets the bar for 1% rule.
- Cap rate 6.8% vs local median 3.9% in Kansas City — top-decile yield for the area; either an underpriced asset or a hidden risk that comps aren't pricing in. Stress-test before assuming the spread holds.
Location & tenants
- Location reads 78/100 on livability (#28 in MO, #2,671 nationally) — a middle-class / working-renter tenant base. Strengths: amenities A+, commute A+, cost of living A+; Watch: crime F.
- Kansas City 33 (urban): math 12% / reading 24% proficiency, ranked #308 of 324 in MO (top 95%) — low school quality limits family demand, transient renter base, plan for 1-2y turnover; 75% free/reduced lunch — lower-income household profile, screen leases tightly.
- Zoned schools: Primitivo Garcia Elementary (math 2% / reading 17%, grade F, #1,037 of 1,115 statewide, top 94%, 263 students, 99% FRL); Northeast High (math 2% / reading 22%, grade F, #497 of 521 statewide, top 96%, 657 students, 100% FRL) — zoned schools average 99% FRL vs 75% district-wide (24 pts higher); higher-poverty schools than district average — tighter screening recommended.
- Market conditions: Rents flat; 96 active listings in the ZIP; 40 comparable units currently listed for rent nearby; rentals at typical pace (median 18d on market — plan ~3-4 weeks tenant-placement turnaround); 40% of comp listings sitting > 30 days — soft ceiling on asking rent; solid renter incomes; 4,002 units permitted in Jackson County in 2024 (2,271 in 5+ unit buildings).
Forward outlook
- Local home prices are declining (-3.0%/yr); year-one equity from $1k of loan paydown is wiped out by about $6k of value loss. Plan a longer hold.
- Jackson County population projected at +4% by 2050 — modest demand growth; plan on rents tracking national, not racing it.
Negotiation context
- Only 4 days on market — expect competitive offers; lowballing is unlikely to land.
- 6 sale attempts since 7y ago; this cycle's ask is 10650% above the opening price — seller raised mid-cycle; expect resistance to lowballs.
Risks & watch-outs
- Watch-outs: built in 1900 — expect roof / HVAC / electrical / plumbing capex.
Questions for the listing agent
- Built in 1900 — when were the roof, HVAC, electrical panel, plumbing, and water heater last replaced?
- Is there a deadline driving the sale (1031 exchange, divorce, estate, relocation)? That informs how much negotiation room exists.
- Crime grade is F in this area — have there been break-ins, vandalism, or insurance claims at this property in the last 3 years? What carrier currently insures it and at what premium?
- The area grade is low — what's the realistic commute time and amenity access for the typical tenant pool here? Any planned neighborhood developments (good or bad) we should know about?
- What's the average days-on-market for RENTAL listings here right now (not sales)? A rising rental-DOM trend means longer vacancies and softer asking-rent achievability than the comps imply.
- What's the recent tenant-quality profile in this submarket — average credit score on applications, eviction rate, late-payment / NSF rate, and stable-employment percentage? A property-management company in the area should have these aggregated.
- How much new for-sale + rental construction is in the pipeline within 1–3 miles? Heavy new supply typically softens prices + rents 12–24 months out; constrained supply supports both.
Investment metrics
- 1% rule
- 0.87% ✗
- Cap rate
- 6.84%
- Cash-on-cash
- 1.96%
- DSCR
- 1.09
- GRM
- 9.6
CMA / ARV
- ARV (on-the-fly)
- $188,916
- Comps found
- 6
Show comp detail 6 sales within ~0.75 mi
| Address | Dist | Beds/Ba | Sqft | Sold | Price | $/sf | Match |
|---|---|---|---|---|---|---|---|
| 2803 Holly St | 0.23mi | 3/1.0 (+1) | 1,164 (+7%) | 2mo | $190,000 | $163 | 72 |
| 2910 Jarboe St | 0.34mi | 2/1.0 | 1,023 (-6%) | 2mo | $154,900 | $151 | 72 |
| 2122 Summit St | 0.54mi | 2/1.0 | 1,110 (+2%) | 1mo | $230,000 | $207 | 71 |
| 2624 Jarboe St | 0.13mi | 2/1.0 | 937 (-14%) | 13mo | $184,900 | $197 | 60 |
| 1018 W 30th St | 0.40mi | 3/2.0 (+1) | 1,065 (-2%) | 23mo | $184,000 | $173 | 49 |
| 3220 Summit St | 0.72mi | 3/1.0 (+1) | 1,232 (+13%) | 23mo | $200,000 | $162 | 21 |
Match score weights: distance 35% · size 25% · config 20% · recency 20%. Top-matched comps best support the ARV.
Projected returns pro-forma
-3.0% appreciation · 0.44% rent growth · sell at horizon
- IRR
- -15.9%
- Equity multiple
- 0.45×
- Total profit
- $-33,305
- Equity at exit
- $32,057
- IRR
- -12.4%
- Equity multiple
- 0.35×
- Total profit
- $-39,378
- Equity at exit
- $18,589
Cash invested: $60,200 (down + closing). Projections, not guarantees.
Landlord ↔ Tenant lean methodology
- Overall (STATE)
- 81 Strongly Landlord-Friendly
- State Missouri
- 81 Strongly Landlord-Friendly · R+10
- County
- — inherits STATE
- City
- — inherits STATE
ZIP-level market 64108
- Home prices YoY
- -25.2%
- Rents YoY
- 0.4%
- Active inventory
- 96
- Price-to-rent
- 9.6×
Monthly cashflow live
- Estimated rent
- $1,867 high interval (Pro) →
- Mortgage (P&I)
- −$1,127
- Tax from tax record
- −$160 /mo · $1,918/yr
- Insurance
- −$90
- HOA
- −$0
- Vacancy / Maint / Mgmt
- −$392
- Net cashflow
- $98
Break-even live
Sensitivity live
| Price | -10% $220 | -5% $159 | +0% $98 | +5% $37 | +10% $-23 |
|---|---|---|---|---|---|
| Rent | -10% $-49 | -5% $25 | +0% $98 | +5% $172 | +10% $246 |
| Rate | -1.0pp $207 | -0.5pp $153 | base $98 | +0.5pp $43 | +1.0pp $-14 |
UW: 25.0% down · 7.5% · 30yr · 1.5% tax · 5.0% vac · 8.0% maint · 8.0% mgmt
Financing live
Cash to close
- Down payment
- $53,750
- Closing costs
- $6,450
- Reserves months
- —
- Total cash needed
- —
Loan-product check · same deal, 3 products live
Conventional
25% down · 7.5% · 30yr
- Down + closing
- —
- Monthly P&I
- —
- Monthly cashflow
- —
- DSCR
- —
- Eligible?
- —
Personal DTI + credit; lowest rate.
DSCR
20% down · 8.5% · 30yr
- Down + closing
- —
- Monthly P&I
- —
- Monthly cashflow
- —
- DSCR
- —
- Eligible?
- —
No personal income docs; deal must DSCR.
Hard money
10% down · 12.0% · 12mo
- Down + closing
- —
- Monthly P&I
- —
- Monthly cashflow
- —
- DSCR
- —
- Eligible?
- —
Short-term bridge; refi at stabilization.
Rent comps 40 comps
| Address | Beds | Baths | Sqft | Rent | $/sqft | DOM | Units | Dist |
|---|---|---|---|---|---|---|---|---|
| 2630 Madison Ave Unit 2 Kansas City, MO | 2.0 | 1.0 | 1500 | $1,850 | $1.23 | 44d | 1 | 0.03mi |
| 2645 Madison Ave Unit 6 Kansas City, MO | 3.0 | 2.0 | 1500 | $2,300 | $1.53 | 44d | 1 | 0.06mi |
| 2728 Holly St Kansas City, MO | 2.0 | 1.0 | 800 | $1,800 | $2.25 | 4d | 1 | 0.19mi |
| 601 Avenida Cesar E Chavez Kansas City, MO | 1.0–2.0 | 1.0–2.0 | 933 | $2,260 | $2.42 | 2d | 15 | 0.50mi |
| 217 W Pershing Rd Kansas City, MO | 2.0 | 2.0 | 1423 | $2,807 | $1.97 | 4d | 1 | 0.56mi |
| 382 W 22nd St Kansas City, MO | 2.0 | 2.0 | 1350 | $1,869 | $1.38 | 17d | 1 | 0.63mi |
| 2980 Baltimore Ave Kansas City, MO | 2.0 | 2.0 | 1225 | $2,354 | $1.92 | 44d | 5 | 0.67mi |
| 311 W 22nd St Kansas City, MO | 3.0 | 1.0–2.0 | 1009 | $3,319 | $3.29 | 2d | 60 | 0.71mi |
| 3040 Baltimore Ave Kansas City, MO | 2.0 | 1.0–2.0 | 1363 | $5,999 | $4.40 | 2d | 75 | 0.72mi |
| 104 E 28 Ter Kansas City, MO | 1.0–2.0 | 1.0–2.5 | 1087 | $2,699 | $2.48 | 4d | 12 | 0.73mi |
| 103 E 28 Ter Kansas City, MO | 2.0 | 2.0 | 980 | $1,979 | $2.02 | 44d | 1 | 0.73mi |
| 2121 Central St Kansas City, MO | 1.0–2.0 | 1.0–2.0 | 1815 | $3,095 | $1.71 | 2d | 3 | 0.73mi |
| 128 E 29th St Kansas City, MO | 2.0 | 2.5 | 1375 | $2,749 | $2.00 | 44d | 1 | 0.75mi |
| 1936 Summit St Kansas City, MO | 1.0–2.0 | 1.0 | 1234 | $1,805 | $1.46 | 44d | 1 | 0.77mi |
| 227 E 27th St Kansas City, MO | 2.0 | 2.0 | 1172 | $1,960 | $1.67 | 44d | 1 | 0.79mi |
| 105 E 30th St Unit 1C Kansas City, MO | 1.0 | 1.0 | 700 | $850 | $1.21 | 17d | 1 | 0.79mi |
| 2100 Wyandotte St Kansas City, MO | 2.0 | 1.0–2.0 | 820 | $2,515 | $3.07 | 2d | 12 | 0.80mi |
| 1829 Madison Ave Kansas City, MO | 1.0 | 1.0 | 743 | $1,545 | $2.08 | 44d | 1 | 0.80mi |
| 3014 Grand Ave Unit 3S Kansas City, MO | 1.0 | 1.0 | 900 | $1,150 | $1.28 | 44d | 1 | 0.83mi |
| 3227 Central St Unit 6 Kansas City, MO | 1.0 | 1.0 | 1000 | $995 | $0.99 | 8d | 1 | 0.83mi |
| 3227 Central St Unit 3227-06 Kansas City, MO | 1.0 | 1.0 | 1000 | $995 | $0.99 | 11d | 1 | 0.83mi |
| 1923 Broadway Blvd Unit 302 Kansas City, MO | 1.0 | 1.0 | 711 | $1,742 | $2.45 | 44d | 1 | 0.84mi |
| 2705 McGee Trfy Kansas City, MO | 3.0 | 1.0–2.0 | 1000 | $2,419 | $2.42 | 2d | 13 | 0.86mi |
| 117 W 20th St Kansas City, MO | 1.0–2.0 | 1.0–2.0 | 1130 | $5,416 | $4.79 | 11d | 1 | 0.88mi |
| 3022 McGee St Kansas City, MO | 1.0 | 1.0 | 700 | $945 | $1.35 | 44d | 1 | 0.90mi |
| 3420 Broadway Blvd Kansas City, MO | 1.0–3.0 | 1.0–2.0 | 1043 | $1,705 | $1.63 | 24d | 2 | 0.95mi |
| 24 Linwood Blvd Unit 30LINWOOD203 Kansas City, MO | 1.0 | 1.0 | 750 | $999 | $1.33 | 24d | 1 | 0.96mi |
| 30 Linwood Blvd Unit 203 Kansas City, MO | 1.0 | 1.0 | 750 | $999 | $1.33 | 44d | 1 | 0.97mi |
| 302 W 34th St Apt 1E Kansas City, MO | 2.0 | 1.0 | 950 | $1,195 | $1.26 | 8d | 1 | 0.97mi |
| 1914 Main St Kansas City, MO | 1.0 | 1.0 | 792 | $1,500 | $1.89 | 2d | 4 | 0.98mi |
| 218 W 34th St Kansas City, MO | 3.0 | 2.5 | 1300 | $1,859 | $1.43 | 15d | 1 | 0.98mi |
| 2107 Grand Blvd #903 Kansas City, MO | 1.0 | 1.0 | 920 | $1,500 | $1.63 | 22d | 1 | 0.99mi |
| 2107 Grand Blvd #1207 Kansas City, MO | 1.0 | 1.5 | 900 | $2,250 | $2.50 | 8d | 1 | 0.99mi |
| 1989 Main St Kansas City, MO | 2.0 | 1.0–2.0 | 770 | $2,465 | $3.20 | 2d | 15 | 0.99mi |
| 2029 Grand Blvd Kansas City, MO | 1.0 | 1.0 | 706 | $1,400 | $1.98 | 44d | 1 | 1.00mi |
| 2903 Gillham Rd Kansas City, MO | 2.0 | 2.0 | 1159 | $1,695 | $1.46 | 44d | 1 | 1.00mi |
| 3401 Central St Unit 101 Kansas City, MO | 1.0 | 1.0 | 740 | $825 | $1.11 | 44d | 1 | 1.01mi |
| 2543 Cherry St Apt 3 Kansas City, MO | 2.0 | 1.0 | 975 | $1,402 | $1.44 | 44d | 1 | 1.02mi |
| 60 E 32nd St Unit 1 Kansas City, MO | 2.0 | 1.0 | 800 | $1,595 | $1.99 | 11d | 1 | 1.03mi |
| 1819 Baltimore Ave Kansas City, MO | 1.0 | 1.0 | 975 | $2,350 | $2.41 | 15d | 1 | 1.04mi |
Listing history 5 events
-
2026-06-18days on market $215,000 Coming Soon 4 DOM
-
2026-06-17days on market $215,000 Coming Soon 3 DOM
-
2026-06-16days on market $215,000 Coming Soon 2 DOM
-
2026-06-15remarks 699-char remark
-
2026-06-15$215,000 Coming Soon 1 DOM
ⓘ Source: listings_history table (triggers on properties + properties_extension) + one-shot
backfill from property_details.listing_events for pre-trigger history.
Tax reassessment forecast MO · Resets to sale price
- Current annual tax
- $1,918 · $160/mo
- Projected year-2 tax
- $2,086 · $174/mo
- Expected delta
- +$168/yr (+$14/mo · 8.7%)
ⓘ Screening estimate from a state-policy table — verify with the county assessor before closing.
Climate risk First Street
- Flood 1/10 Low FEMA zone X (unshaded) · 0% chance over 30 yrs
- Wildfire 1/10 Low
- Heat 4/10 Moderate 7 d/yr ≥106°F today · 17 d/yr by 30 yrs out
- Wind 2/10 Low
- Air quality 3/10 Moderate 2 unhealthy d/yr today · 3 by 30 yrs out
Nearby sold comps map
Loading sold comps map…
Walkable amenities ~0.75 mi
Loading nearby amenities…
Taxation est. · year 1
- Rental income
- $22,409
- − Mortgage interest
- −$12,043
- − Property taxes
- −$1,918
- − Insurance
- −$1,075
- − Repairs & maintenance
- −$1,793
- − Management
- −$1,793
- − Depreciation
- −$6,255
- Taxable loss
- −$2,468
- Est. tax savings @ 24.0%
- +$592
- After-tax cash flow
- $1,772/yr
For passive investors: Depreciation is non-cash, so a rental often shows a tax loss while cash-flowing — sheltering income. Rental losses are passive: they offset passive income freely, and up to $25,000/yr can offset ordinary (W-2) income if you actively participate and your MAGI is under $100k (phasing out to $0 by $150k); unused losses carry forward. On sale, claimed depreciation is recaptured at up to 25%, and gains may owe capital-gains tax (a 1031 exchange can defer both). Figures are a year-1 estimate at your 24.0% rate — not tax advice; consult a CPA.
Schools (NCES district)
- District
- Kansas City 33
- NCES district ID
- 2916400
- Math proficiency
- 12% ▼ -8.00%
- Reading proficiency
- 24% ▬ 0.00%
- Median HH income
- $35,227
- Composite
- 14.8/100
- National rank
- #9387
- State rank
- #308 of 324 in MO
Livability — Kansas City
- Score
- 78/100
- State rank
- #28
- US rank
- #2671
Category grades
Schools grade is shown separately in the Schools card above.
Census & demographics
- Census place
- Kansas City, MO
- County
- Jackson County · 687,798 people
- City population
- 439,467
- Metro
- Kansas City, MO-KS
- Population (ZIP)
- 10,495
- Household income
- $80,551
- Rent vs Own
- Severe rent burden
- 864.0
Population outlook (Jackson County) Hauer SSP2
- Today (2025)
- 719,589 people
- By 2030
- 731,456 · +1.6%
- By 2040
- 746,689 · +3.8%
- By 2050
- 749,289 · +4.1%
- By 2075
- 736,227 · +2.3%
- By 2100
- 668,210 · -7.1%
Race, ethnicity, and origin ACS 2023
- Neighborhood character
- Diverse neighborhood (Simpson 0.65)
- Race & ethnicity
- White 50% Black 26% Hispanic / Latino 17% Two or more races 12% Asian 3%
- Hispanic origin (detail)
- Mexican 15%
- Common ancestry
- Italian 2% Lithuanian 2% Slovak 1%
- Foreign-born
- 6% · Canada
- Languages at home
- 88% English-only · Spanish 9% Arabic 1% French/Haitian/Cajun 1%
Political lean MEDSL · Jackson
- 2024 margin
- D (+19.3) · D 58.9% · R 39.5% · Other 1.6%
- 2008→2024 swing
- -6.1pp toward R · 2008: 25.4pp · 2024: 19.3pp
- All cycles
- 2024: D+19.3 2020: D+22.0 2016: D+16.6 2012: D+19.0 2008: D+25.4
Not yet ingested
- Civics
- —
Market trends
- HPI YoY
- ▼ -91.93%
- Current HPI
- 273.3599
- Rent YoY
- ▲ 0.44%
- Metro
- Kansas City, MO-KS
- State GDP YoY
- ▲ 1.84%
- F500 in state
- 20
Industry mix (Fortune 500 HQ in MO)
| Industry | F500 HQs | Revenue |
|---|---|---|
| Healthcare | 1 | $163B |
|
||
| Insurance | 1 | $21B |
|
||
| Industrial Technology | 1 | $17B |
|
||
| Retail | 1 | $16B |
|
||
| Industrial Distribution | 1 | $10B |
|
||
| Utilities | 1 | $9B |
|
||
Price history
+152.9% since first listed22 events — show timeline
- 2026-06-14 Coming Soon $215,000 Heartland MLS as Distributed by MLS Grid
- 2025-12-09 Rental Removed $2,000 Avail
- 2025-10-09 Listed for Rent $2,000 Avail
- 2025-07-10 Rental Removed $2,450 Avail
- 2025-06-08 Listed for Rent $2,450 Avail
- 2025-05-25 Rental Removed $2,450 Avail
- 2025-04-23 Listed for Rent $2,450 Avail
- 2021-07-27 Sold (Public Records) — Public Records
- 2021-07-15 Sold (MLS) — Heartland MLS as Distributed by MLS Grid
- 2021-06-14 Contingent — Heartland MLS as Distributed by MLS Grid
- 2021-06-09 Listed $165,000 Heartland MLS as Distributed by MLS Grid
- 2020-03-24 Sold (Public Records) — Public Records
- 2020-02-25 Sold (MLS) — Heartland MLS as Distributed by MLS Grid
- 2020-02-04 Contingent — Heartland MLS as Distributed by MLS Grid
- 2020-01-01 Listed $159,900 Heartland MLS as Distributed by MLS Grid
- 2019-08-02 Sold (Public Records) — Public Records
- 2019-08-01 Sold (MLS) — Heartland MLS as Distributed by MLS Grid
- 2019-07-07 Pending — Heartland MLS as Distributed by MLS Grid
- 2019-07-02 Listed $85,000 Heartland MLS as Distributed by MLS Grid
- 1998-09-09 Sold (Public Records) — Public Records
- 1992-08-18 Sold (Public Records) — Public Records
- 1984-10-01 Sold (Public Records) — Public Records
Property tax history
+11.7%/yrLatest (2025): $1,918 · -26.7% YoY. Source: county tax records.
Cash-flow waterfall
monthlySold comps — $/sqft
last 12 mo · ≤1 miLoading sold comps…