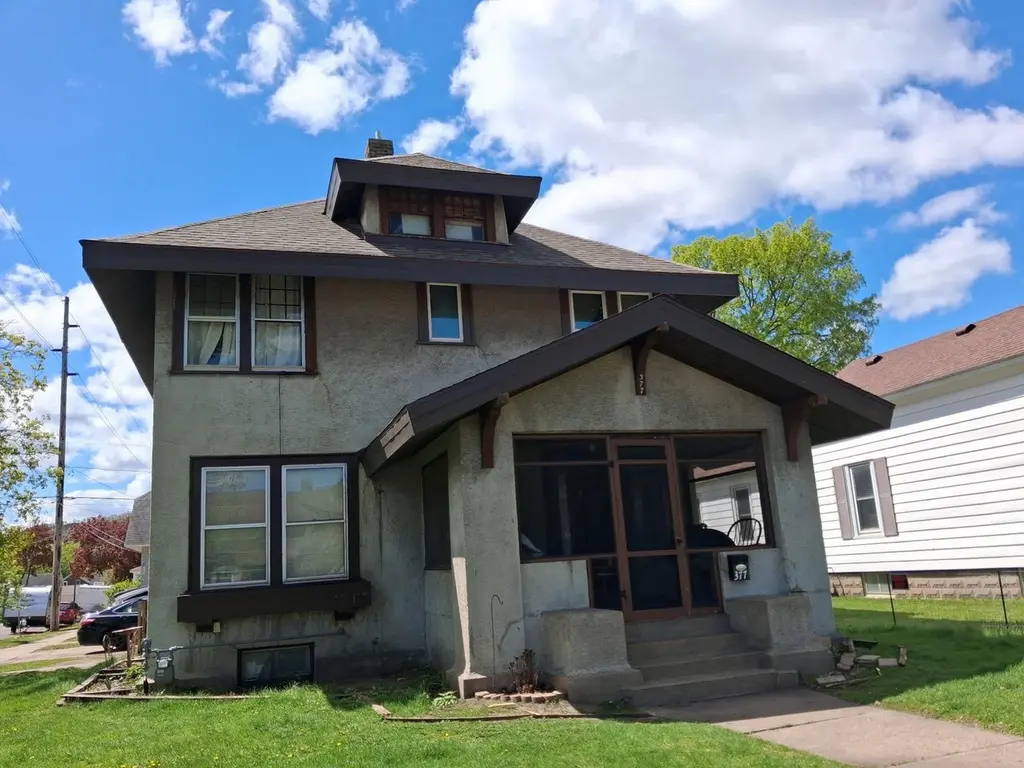
377 E Broadway St · Winona, MN
Flood risk 1/10 · Minimal
- FEMA flood zone
- X
- Chance of flooding over 30 yrs
- 0.0%
- Est. flood insurance / yr
- $507 – $1,088
Fire risk 3/10 · Minor
- Est. fire insurance / yr
- $888 – $1,650
Heat risk 3/10 · Minor
- Hot days now (above 100°F)
- 7 days/yr
- Hot days in 30 yrs
- 14 days/yr
Wind risk 2/10 · Minimal
- Chance of severe wind over 30 yrs
- —
Air-quality risk 1/10 · Minimal
- Unhealthy air days now
- 0 days/yr
- Unhealthy air days in 30 yrs
- 0 days/yr
Risk factors via First Street. Map © Google.
Why this score? — see what drove the C- grade
The composite is a weighted blend of 9 inputs, each scored 0–100. Each bar is that input's sub-score; the figure is the points it added to the 100-point composite (weight × sub-score).
- Cash flow +16.0/30.0
- ARV discount +12.7/15.0
- DSCR +5.0/10.0
- Rent growth +5.0/5.0
- Livability +4.0/5.0
- 1% rule +3.7/10.0
- Schools +3.1/10.0
- Condition / age +2.5/5.0
- Appreciation +0.0/10.0
$184,900
🖨 Deal sheet 📄 Offer letter ✓ Due diligence
Listing remarks MLS
Charming stucco home w/modern updates & beautiful original woodwork! 4 Br's, 1.5 baths, wood floors, finished basement and relaxing front porch. Bright and sunny w/natural light and newer mechanicals.
Key facts
- Hardwood flooring
- Original woodwork
- 4,573 sq ft lot
Tags
Property features AI
Finance
- Financial info: Conventional financing available
Exterior
- Parking: Detached or attached 2-car garage (24 x 20) with 7' high, 8' wide door
- Utilities: City water connected; City sewer connected; Natural gas
- Home design: Residential property; Two levels; Entry faces southwest (approximate based on directions)
- Construction: Frame construction; Asphalt roof (over 8 years old); Foundation described as other
- Exterior features: Stucco exterior; Porch; Tree coverage (light); City street frontage (public maintained road); Lot approximately 50 x 92
Interior
- Kitchen: Range; Dishwasher; Refrigerator; Kitchen window
- Bedrooms: 4 bedrooms (three on the upper level, one in the lower level)
- Flooring: Hardwood floors
- Bathrooms: 1 full bathroom on the upper level; 1 half bathroom in the basement
- Heating & cooling: Forced air heating; Central air conditioning
- Interior features: Finished full basement; Separate/formal dining room; Kitchen window; Natural woodwork; Hardwood floors; Balcony; Porch
- Laundry & utility: Gas water heater
Neighborhood map
What this means for you Summary
Snapshot
- This is a 3-bed/1.0-bath single-family listed at $185k.
Deal economics
- At list price, monthly cash flow is $92 ($1k/yr) — positive.
- The deal already cash-flows at list — no discount required.
- To meet the 1% rule (rent ≥ 1% of price), the offer needs to be $160k (13.3% below list).
- Recommended offer: $160k (13.3% below list) — sets the bar for 1% rule.
- Cap rate 6.9% vs local median 3.9% in Winona — top-decile yield for the area; either an underpriced asset or a hidden risk that comps aren't pricing in. Stress-test before assuming the spread holds.
Location & tenants
- Location reads 81/100 on livability (#63 in MN, #1,558 nationally) — a professional / high-income tenant draw. Strengths: commute A+, cost of living A+, housing A+; Watch: employment C-.
- Winona Area Public School District (town): math 33% / reading 40% proficiency, ranked #244 of 301 in MN (top 81%) — families likely to look elsewhere, expect single-tenant / working-renter base with shorter leases.
- Market conditions: Rents rising fast (+18.0%/yr); 137 active listings in the ZIP; 37 units permitted in Winona County in 2024 (0 in 5+ unit buildings).
- This rent runs 31% of the median local income ($62k/yr) — at the standard rent-burdened threshold; future hikes will face affordability resistance.
Forward outlook
- Local home prices are declining (-3.0%/yr); year-one equity from $1k of loan paydown is wiped out by about $6k of value loss. Plan a longer hold.
- Winona County population projected to shrink 9% by 2050 — rents likely to lag national; underwrite the cash flow, not the appreciation.
Negotiation context
- Only 5 days on market — expect competitive offers; lowballing is unlikely to land.
- 2 sale attempts since 10y ago with the ask held roughly flat each time — persistent listings suggest the price (not the market) is what's stuck; bring a comps-based counter.
Risks & watch-outs
- Watch-outs: built in 1912 — expect roof / HVAC / electrical / plumbing capex.
Questions for the listing agent
- Built in 1912 — when were the roof, HVAC, electrical panel, plumbing, and water heater last replaced?
- Is there a deadline driving the sale (1031 exchange, divorce, estate, relocation)? That informs how much negotiation room exists.
- Schools are B-rated — typically a magnet for longer-tenancy family renters. What's the average tenant stay here, and is there a school-zone premium baked into asking?
- What's the average days-on-market for RENTAL listings here right now (not sales)? A rising rental-DOM trend means longer vacancies and softer asking-rent achievability than the comps imply.
- What's the recent tenant-quality profile in this submarket — average credit score on applications, eviction rate, late-payment / NSF rate, and stable-employment percentage? A property-management company in the area should have these aggregated.
- How much new for-sale + rental construction is in the pipeline within 1–3 miles? Heavy new supply typically softens prices + rents 12–24 months out; constrained supply supports both.
Investment metrics
- 1% rule
- 0.87% ✗
- Cap rate
- 6.89%
- Cash-on-cash
- 2.14%
- DSCR
- 1.10
- GRM
- 9.6
CMA / ARV
- ARV (median comp)
- $209,023
- List price
- $184,900
- Delta
- -11.54%
- Verdict
- UNDERPRICED
- Comps
- 2 within 1.0 mi
Show comp detail 1 sale within ~0.75 mi
| Address | Dist | Beds/Ba | Sqft | Sold | Price | $/sf | Match |
|---|---|---|---|---|---|---|---|
| 72 7th Street East St | 0.44mi | 4/1.5 (+1) | 2,066 (+9%) | 14mo | $225,250 | $109 | 45 |
Match score weights: distance 35% · size 25% · config 20% · recency 20%. Top-matched comps best support the ARV.
Projected returns pro-forma
-3.0% appreciation · 8.0% rent growth · sell at horizon
- IRR
- -7.8%
- Equity multiple
- 0.70×
- Total profit
- $-15,649
- Equity at exit
- $27,569
- IRR
- 6.9%
- Equity multiple
- 1.62×
- Total profit
- $32,330
- Equity at exit
- $15,987
Cash invested: $51,772 (down + closing). Projections, not guarantees.
Landlord ↔ Tenant lean methodology
- Overall (STATE)
- 46 Balanced
- State Minnesota
- 46 Balanced · D+2
- County
- — inherits STATE
- City
- — inherits STATE
ZIP-level market 55987
- Rents YoY
- 18.0%
- Active inventory
- 137
- Price-to-rent
- 9.6×
Monthly cashflow live
- Estimated rent
- $1,602 medium interval (Pro) →
- Mortgage (P&I)
- −$970
- Tax from tax record
- −$127 /mo · $1,522/yr
- Insurance
- −$77
- HOA
- −$0
- Vacancy / Maint / Mgmt
- −$337
- Net cashflow
- $92
Break-even live
UW: 25.0% down · 7.5% · 30yr · 1.5% tax · 5.0% vac · 8.0% maint · 8.0% mgmt
Financing live
Cash to close
- Down payment
- $46,225
- Closing costs
- $5,547
- Reserves months
- —
- Total cash needed
- —
Loan-product check · same deal, 3 products live
Conventional
25% down · 7.5% · 30yr
- Down + closing
- —
- Monthly P&I
- —
- Monthly cashflow
- —
- DSCR
- —
- Eligible?
- —
Personal DTI + credit; lowest rate.
DSCR
20% down · 8.5% · 30yr
- Down + closing
- —
- Monthly P&I
- —
- Monthly cashflow
- —
- DSCR
- —
- Eligible?
- —
No personal income docs; deal must DSCR.
Hard money
10% down · 12.0% · 12mo
- Down + closing
- —
- Monthly P&I
- —
- Monthly cashflow
- —
- DSCR
- —
- Eligible?
- —
Short-term bridge; refi at stabilization.
Listing history 6 events
-
2026-05-08status Pending 125-char remark
-
2026-05-03$184,900 Active 125-char remark
-
2018-12-10historical 204-char remark
Show marketing remark (204 chars)
Charming stucco home w/modern updates & beautiful original woodwork! 4 Br's, 1.5 baths, wood floors, finished basement and relaxing front porch. Bright and sunny w/natural light and newer mechanicals.
-
2017-01-31soldstatus $142,000 204-char remark
Show marketing remark (204 chars)
Charming stucco home w/modern updates & beautiful original woodwork! 4 Br's, 1.5 baths, wood floors, finished basement and relaxing front porch. Bright and sunny w/natural light and newer mechanicals.
-
2017-01-31soldstatus $142,000
Show marketing remark (204 chars)
Charming stucco home w/modern updates & beautiful original woodwork! 4 Br's, 1.5 baths, wood floors, finished basement and relaxing front porch. Bright and sunny w/natural light and newer mechanicals.
-
2016-07-14$144,900 204-char remark
Show marketing remark (204 chars)
Charming stucco home w/modern updates & beautiful original woodwork! 4 Br's, 1.5 baths, wood floors, finished basement and relaxing front porch. Bright and sunny w/natural light and newer mechanicals.
ⓘ Source: listings_history table (triggers on properties + properties_extension) + one-shot
backfill from property_details.listing_events for pre-trigger history.
Tax reassessment forecast MN · Partial reset (capped growth)
- Current annual tax
- $1,522 · $127/mo
- Projected year-2 tax
- $1,796 · $150/mo
- Expected delta
- +$274/yr (+$23/mo · 18.0%)
ⓘ Screening estimate from a state-policy table — verify with the county assessor before closing.
Climate risk First Street
- Flood 1/10 Low FEMA zone X · 0% chance over 30 yrs
- Wildfire 3/10 Moderate
- Heat 3/10 Moderate 7 d/yr ≥100°F today · 14 d/yr by 30 yrs out
- Wind 2/10 Low
- Air quality 1/10 Low 0 unhealthy d/yr today · 0 by 30 yrs out
Nearby sold comps map
Loading sold comps map…
Walkable amenities ~0.75 mi
Loading nearby amenities…
Taxation est. · year 1
- Rental income
- $19,229
- − Mortgage interest
- −$10,357
- − Property taxes
- −$1,522
- − Insurance
- −$924
- − Repairs & maintenance
- −$1,538
- − Management
- −$1,538
- − Depreciation
- −$5,379
- Taxable loss
- −$2,030
- Est. tax savings @ 24.0%
- +$487
- After-tax cash flow
- $1,596/yr
For passive investors: Depreciation is non-cash, so a rental often shows a tax loss while cash-flowing — sheltering income. Rental losses are passive: they offset passive income freely, and up to $25,000/yr can offset ordinary (W-2) income if you actively participate and your MAGI is under $100k (phasing out to $0 by $150k); unused losses carry forward. On sale, claimed depreciation is recaptured at up to 25%, and gains may owe capital-gains tax (a 1031 exchange can defer both). Figures are a year-1 estimate at your 24.0% rate — not tax advice; consult a CPA.
Schools (NCES district)
- District
- Winona Area Public School District
- NCES district ID
- 2744070
- Math proficiency
- 33% ▼ -16.00%
- Reading proficiency
- 40% ▼ -9.00%
- Median HH income
- $45,678
- Composite
- 31.15/100
- National rank
- #6058
- State rank
- #244 of 301 in MN
Livability — Winona
- Score
- 81/100
- State rank
- #63
- US rank
- #1558
Category grades
Schools grade is shown separately in the Schools card above.
Census & demographics
- Census place
- Winona, MN
- County
- Winona County · 34,072 people
- City population
- 34,072
- Metro
- Winona, MN
- Population (ZIP)
- 34,072
- Household income
- $61,624
- Rent vs Own
- Severe rent burden
- 1525.0
Population outlook (Winona County) Hauer SSP2
- Today (2025)
- 50,614 people
- By 2030
- 50,243 · -0.7%
- By 2040
- 48,142 · -4.9%
- By 2050
- 45,872 · -9.4%
- By 2075
- 42,416 · -16.2%
- By 2100
- 40,031 · -20.9%
Race, ethnicity, and origin ACS 2023
- Neighborhood character
- Predominantly White (89%)
- Race & ethnicity
- White 89% Two or more races 4% Hispanic / Latino 4% Black 2% Asian 2%
- Common ancestry
- Portuguese 14% Romanian 12% Lithuanian 2%
- Foreign-born
- 3% · Canada
- Languages at home
- 96% English-only · Spanish 2% Other Asian/Pacific 1%
Political lean MEDSL · Winona
- 2024 margin
- Toss-up / Even · D 46.6% · R 51.5% · Other 1.8%
- 2008→2024 swing
- -24.0pp toward R · 2008: 19.1pp · 2024: -4.9pp
- All cycles
- 2024: R+4.9 2020: D+0.4 2016: R+2.9 2012: D+12.9 2008: D+19.1
Not yet ingested
- Civics
- —
Market trends
- HPI YoY
- ▼ -166.61%
- Current HPI
- 193.7509
- Rent YoY
- ▲ 17.99%
- Metro
- Winona, MN
- State GDP YoY
- ▲ 2.41%
- F500 in state
- 34
Industry mix (Fortune 500 HQ in MN)
| Industry | F500 HQs | Revenue |
|---|---|---|
| Healthcare | 2 | $407B |
|
||
| Retail | 2 | $150B |
|
||
| Consumer Goods | 2 | $32B |
|
||
| Industrial Machinery | 2 | $6B |
|
||
| Agriculture | 1 | $40B |
|
||
| Healthcare / Medical Devices | 1 | $32B |
|
||
Price history
+22.5% since first listed7 events — show timeline
- 2026-06-16 Sold (MLS) $177,500 NORTHSTARMLS as Distributed by MLS Grid
- 2026-05-08 Pending — NORTHSTARMLS as Distributed by MLS Grid
- 2026-05-03 Listed $184,900 NORTHSTARMLS as Distributed by MLS Grid
- 2018-12-10 Listing Removed — NORTHSTARMLS as Distributed by MLS Grid
- 2017-01-31 Sold (Public Records) $142,000 Public Records
- 2017-01-31 Sold (MLS) $142,000 NORTHSTARMLS as Distributed by MLS Grid
- 2016-07-14 Listed $144,900 NORTHSTARMLS as Distributed by MLS Grid
Property tax history
+2.9%/yrLatest (2025): $1,522 · +4.8% YoY. Source: county tax records.
Cash-flow waterfall
monthlySold comps — $/sqft
last 12 mo · ≤1 miLoading sold comps…