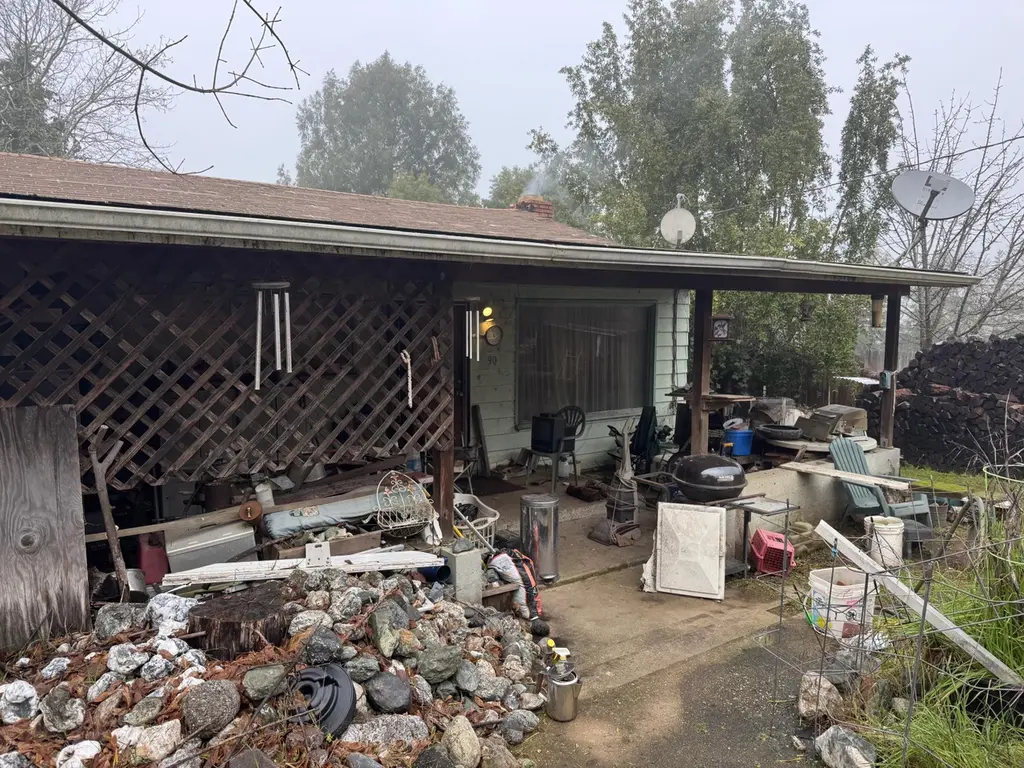
90 Maple Ln · Miranda, CA
Flood risk 1/10 · Minimal
- FEMA flood zone
- X (unshaded)
- Chance of flooding over 30 yrs
- 0.0%
- Est. flood insurance / yr
- $507 – $1,088
Fire risk 5/10 · Moderate
- Est. fire insurance / yr
- $659 – $1,223
Heat risk 5/10 · Moderate
- Hot days now (above 94°F)
- 9 days/yr
- Hot days in 30 yrs
- 23 days/yr
Wind risk 1/10 · Minimal
- Chance of severe wind over 30 yrs
- —
Air-quality risk 10/10 · Severe
- Unhealthy air days now
- 26 days/yr
- Unhealthy air days in 30 yrs
- 27 days/yr
Risk factors via First Street. Map © Google.
Why this score? — see what drove the D+ grade
The composite is a weighted blend of 9 inputs, each scored 0–100. Each bar is that input's sub-score; the figure is the points it added to the 100-point composite (weight × sub-score).
- Cash flow +15.2/30.0
- ARV discount +7.5/15.0
- DSCR +4.7/10.0
- Appreciation +4.4/10.0
- 1% rule +3.3/10.0
- Schools +3.1/10.0
- Livability +2.7/5.0
- Rent growth +2.5/5.0
- Condition / age +2.5/5.0
$176,000
🖨 Deal sheet 📄 Offer letter ✓ Due diligence
Listing remarks MLS
This true fixer offers an excellent opportunity to create value in a great location. Situated on a generous . 325-acre lot, the property provides plenty of space and potential for renovation, expansion, or customization. Conveniently located close to schools and downtown Miranda, this home combines a desirable setting with the chance to bring your vision to life. Ideal for investors, contractors, or buyers looking for a project in a strong location with room to grow.
Key facts
- Close to schools
- Generous lot
- Close to downtown
Tags
Neighborhood map
What this means for you Summary
Snapshot
- This is a 3-bed/1.0-bath single-family listed at $176k.
Deal economics
- At list price, monthly cash flow is $60 ($721/yr) — positive.
- The deal already cash-flows at list — no discount required.
- To meet the 1% rule (rent ≥ 1% of price), the offer needs to be $146k (17.0% below list).
- Recommended offer: $146k (17.0% below list) — sets the bar for 1% rule.
Location & tenants
- Location reads 54/100 on livability (#921 in CA) — a working-class tenant base; expect higher turnover. Strengths: employment A; Watch: health & safety C-, schools D+, housing D.
- Southern Humboldt Joint Unified (rural): math 28% / reading 41% proficiency, ranked #928 of 1,400 in CA (top 66%) — families likely to look elsewhere, expect single-tenant / working-renter base with shorter leases.
- Market conditions: 22 active listings in the ZIP; 188 units permitted in Humboldt County in 2024 (17 in 5+ unit buildings).
Forward outlook
- Local home prices are declining (-1.1%/yr); year-one equity from $1k of loan paydown is wiped out by about $2k of value loss. Plan a longer hold.
- Humboldt County population projected to shrink 4% by 2050 — rents likely to lag national; underwrite the cash flow, not the appreciation.
Negotiation context
- It's been on market 156 days — a 12% lower offer ($155k) is reasonable based on typical stale-listing flexibility.
- Current owner paid $40k; list at $176k implies a 340% gain — meaningful room to come down on a strong offer.
Risks & watch-outs
- Watch-outs: built in 1957 — expect roof / HVAC / electrical / plumbing capex.
- Climate carrying-cost: moderate wildfire risk; extreme-heat days projected 9→23/yr by 2055 (HVAC capex compounding) — expect insurance premiums to compound above CPI over the hold.
Questions for the listing agent
- It's been on market 156 days. Have you received any prior offers? Is the seller open to a 17% concession, seller financing, or rate buy-down credit?
- Built in 1957 — when were the roof, HVAC, electrical panel, plumbing, and water heater last replaced?
- Why hasn't it sold? Are there any deal-killer items the seller is aware of (foundation, flood, title, zoning, code violations)?
- Is there a deadline driving the sale (1031 exchange, divorce, estate, relocation)? That informs how much negotiation room exists.
- Schools are D-rated, which usually means shorter tenancies and higher turnover. Who's the typical renter profile here, and what's been the actual vacancy rate?
- Crime grade is F in this area — have there been break-ins, vandalism, or insurance claims at this property in the last 3 years? What carrier currently insures it and at what premium?
- The area grade is low — what's the realistic commute time and amenity access for the typical tenant pool here? Any planned neighborhood developments (good or bad) we should know about?
- What's the average days-on-market for RENTAL listings here right now (not sales)? A rising rental-DOM trend means longer vacancies and softer asking-rent achievability than the comps imply.
- What's the recent tenant-quality profile in this submarket — average credit score on applications, eviction rate, late-payment / NSF rate, and stable-employment percentage? A property-management company in the area should have these aggregated.
- How much new for-sale + rental construction is in the pipeline within 1–3 miles? Heavy new supply typically softens prices + rents 12–24 months out; constrained supply supports both.
Investment metrics
- 1% rule
- 0.83% ✗
- Cap rate
- 6.70%
- Cash-on-cash
- 1.46%
- DSCR
- 1.07
- GRM
- 10.0
CMA / ARV
- ARV (median comp)
- $406,591
- List price
- $176,000
- Delta
- -56.71%
- Verdict
- UNDERPRICED
- Comps
- 10 within 1.0 mi
Show comp detail 2 sales within ~0.75 mi
| Address | Dist | Beds/Ba | Sqft | Sold | Price | $/sf | Match |
|---|---|---|---|---|---|---|---|
| 75 River Rd | 0.36mi | 3/2.0 | 1,224 (-11%) | 14mo | $375,000 | $306 | 49 |
| 135 Logan Rd | 0.28mi | 2/3.0 (-1) | 1,200 (-12%) | 21mo | $455,000 | $379 | 36 |
Match score weights: distance 35% · size 25% · config 20% · recency 20%. Top-matched comps best support the ARV.
Projected returns pro-forma
-1.15% appreciation · 3.0% rent growth · sell at horizon
- IRR
- -5.0%
- Equity multiple
- 0.78×
- Total profit
- $-10,644
- Equity at exit
- $41,245
- IRR
- 1.9%
- Equity multiple
- 1.17×
- Total profit
- $8,585
- Equity at exit
- $42,264
Cash invested: $49,280 (down + closing). Projections, not guarantees.
Landlord ↔ Tenant lean methodology
- Overall (STATE)
- 18 Strongly Tenant-Friendly
- State California
- 18 Strongly Tenant-Friendly · D+13
- County
- — inherits STATE
- City
- — inherits STATE
ZIP-level market 95553
- Home prices YoY
- -1.6%
- Active inventory
- 22
- Price-to-rent
- 10.0×
Monthly cashflow live
- Estimated rent
- $1,461 medium interval (Pro) →
- Mortgage (P&I)
- −$923
- Tax from tax record
- −$98 /mo · $1,171/yr
- Insurance
- −$73
- HOA
- −$0
- Vacancy / Maint / Mgmt
- −$307
- Net cashflow
- $60
Break-even live
UW: 25.0% down · 7.5% · 30yr · 1.5% tax · 5.0% vac · 8.0% maint · 8.0% mgmt
Financing live
Cash to close
- Down payment
- $44,000
- Closing costs
- $5,280
- Reserves months
- —
- Total cash needed
- —
Loan-product check · same deal, 3 products live
Conventional
25% down · 7.5% · 30yr
- Down + closing
- —
- Monthly P&I
- —
- Monthly cashflow
- —
- DSCR
- —
- Eligible?
- —
Personal DTI + credit; lowest rate.
DSCR
20% down · 8.5% · 30yr
- Down + closing
- —
- Monthly P&I
- —
- Monthly cashflow
- —
- DSCR
- —
- Eligible?
- —
No personal income docs; deal must DSCR.
Hard money
10% down · 12.0% · 12mo
- Down + closing
- —
- Monthly P&I
- —
- Monthly cashflow
- —
- DSCR
- —
- Eligible?
- —
Short-term bridge; refi at stabilization.
Listing history 18 events
-
2026-06-19days on market $176,000 Active 156 DOM
-
2026-06-18days on market $176,000 Active 155 DOM
-
2026-06-17days on market $176,000 Active 154 DOM
-
2026-06-16days on market $176,000 Active 153 DOM
-
2026-06-15days on market $176,000 Active 152 DOM
-
2026-06-14days on market $176,000 Active 150 DOM
-
2026-06-12days on market $176,000 Active 149 DOM
-
2026-06-09days on market $176,000 Active 146 DOM
-
2026-06-08days on market $176,000 Active 145 DOM
-
2026-06-07days on market $176,000 Active 144 DOM
-
2026-06-07days on market $176,000 Active 143 DOM
-
2026-06-04days on market $176,000 Active 140 DOM
-
2026-06-02days on market $176,000 Active 139 DOM
-
2026-06-01days on market $176,000 Active 138 DOM
-
2026-05-31days on market $176,000 Active 137 DOM
-
2026-05-31days on market $176,000 Active 136 DOM
-
2026-01-12$176,000 Active 471-char remark
Show marketing remark (471 chars)
This true fixer offers an excellent opportunity to create value in a great location. Situated on a generous . 325-acre lot, the property provides plenty of space and potential for renovation, expansion, or customization. Conveniently located close to schools and downtown Miranda, this home combines a desirable setting with the chance to bring your vision to life. Ideal for investors, contractors, or buyers looking for a project in a strong location with room to grow.
-
1994-01-06soldstatus $40,000
ⓘ Source: listings_history table (triggers on properties + properties_extension) + one-shot
backfill from property_details.listing_events for pre-trigger history.
Tax reassessment forecast CA · Resets to sale price
- Current annual tax
- $1,171 · $98/mo
- Projected year-2 tax
- $1,338 · $111/mo
- Expected delta
- +$166/yr (+$14/mo · 14.2%)
ⓘ Screening estimate from a state-policy table — verify with the county assessor before closing.
Climate risk First Street
- Flood 1/10 Low FEMA zone X (unshaded) · 0% chance over 30 yrs
- Wildfire 5/10 Major
- Heat 5/10 Major 9 d/yr ≥94°F today · 23 d/yr by 30 yrs out
- Wind 1/10 Low
- Air quality 10/10 Extreme 26 unhealthy d/yr today · 27 by 30 yrs out
Nearby sold comps map
Loading sold comps map…
Walkable amenities ~0.75 mi
Loading nearby amenities…
Taxation est. · year 1
- Rental income
- $17,529
- − Mortgage interest
- −$9,859
- − Property taxes
- −$1,171
- − Insurance
- −$880
- − Repairs & maintenance
- −$1,402
- − Management
- −$1,402
- − Depreciation
- −$5,120
- Taxable loss
- −$2,306
- Est. tax savings @ 24.0%
- +$553
- After-tax cash flow
- $1,274/yr
For passive investors: Depreciation is non-cash, so a rental often shows a tax loss while cash-flowing — sheltering income. Rental losses are passive: they offset passive income freely, and up to $25,000/yr can offset ordinary (W-2) income if you actively participate and your MAGI is under $100k (phasing out to $0 by $150k); unused losses carry forward. On sale, claimed depreciation is recaptured at up to 25%, and gains may owe capital-gains tax (a 1031 exchange can defer both). Figures are a year-1 estimate at your 24.0% rate — not tax advice; consult a CPA.
Schools (NCES district)
- District
- Southern Humboldt Joint Unified
- NCES district ID
- 0637590
- Math proficiency
- 28% ▲ 1.00%
- Reading proficiency
- 41% ▲ 2.00%
- Median HH income
- $38,108
- Composite
- 31.43/100
- National rank
- #11197
- State rank
- #928 of 1400 in CA
Livability — Miranda
- Score
- 54/100
- State rank
- #921
- US rank
- #24210
Category grades
Schools grade is shown separately in the Schools card above.
Census & demographics
- Census place
- Miranda, CA
- Population (ZIP)
- 734
Population outlook (Humboldt County) Hauer SSP2
- Today (2025)
- 135,550 people
- By 2030
- 134,798 · -0.6%
- By 2040
- 132,222 · -2.5%
- By 2050
- 130,850 · -3.5%
- By 2075
- 128,656 · -5.1%
- By 2100
- 120,238 · -11.3%
Race, ethnicity, and origin ACS 2023
- Neighborhood character
- Diverse neighborhood (Simpson 0.55)
- Race & ethnicity
- White 66% Two or more races 34% Hispanic / Latino 11%
- Hispanic origin (detail)
- Puerto Rican 11%
- Common ancestry
- Slovak 8% French 8% Italian 5%
- Foreign-born
- 8%
Political lean MEDSL · Humboldt
- 2024 margin
- Strong D (+28.4) · D 62.0% · R 33.6% · Other 4.5%
- 2008→2024 swing
- +0.2pp no change · 2008: 28.2pp · 2024: 28.4pp
- All cycles
- 2024: D+28.4 2020: D+33.4 2016: D+25.9 2012: D+26.2 2008: D+28.2
Not yet ingested
- Civics
- —
Market trends
- HPI YoY
- ▼ -1.15%
- Current HPI
- 72.4464
- Rent YoY
- —
- Metro
- —
- State GDP YoY
- ▲ 3.21%
- F500 in state
- 116
Industry mix (Fortune 500 HQ in CA)
| Industry | F500 HQs | Revenue |
|---|---|---|
| Technology | 27 | $1,492B |
|
||
| Financial Services | 3 | $174B |
|
||
| Retail | 3 | $44B |
|
||
| Insurance | 3 | $26B |
|
||
| Media / Entertainment | 2 | $115B |
|
||
| Pharmaceuticals / Biotech | 2 | $62B |
|
||
Price history
+340.0% since first listed2 events — show timeline
- 2026-01-12 Listed $176,000 HAR
- 1994-01-06 Sold (Public Records) $40,000 Public Records
Property tax history
+2.0%/yrLatest (2025): $1,171 · +4.6% YoY. Source: county tax records.
Cash-flow waterfall
monthlySold comps — $/sqft
last 12 mo · ≤1 miLoading sold comps…