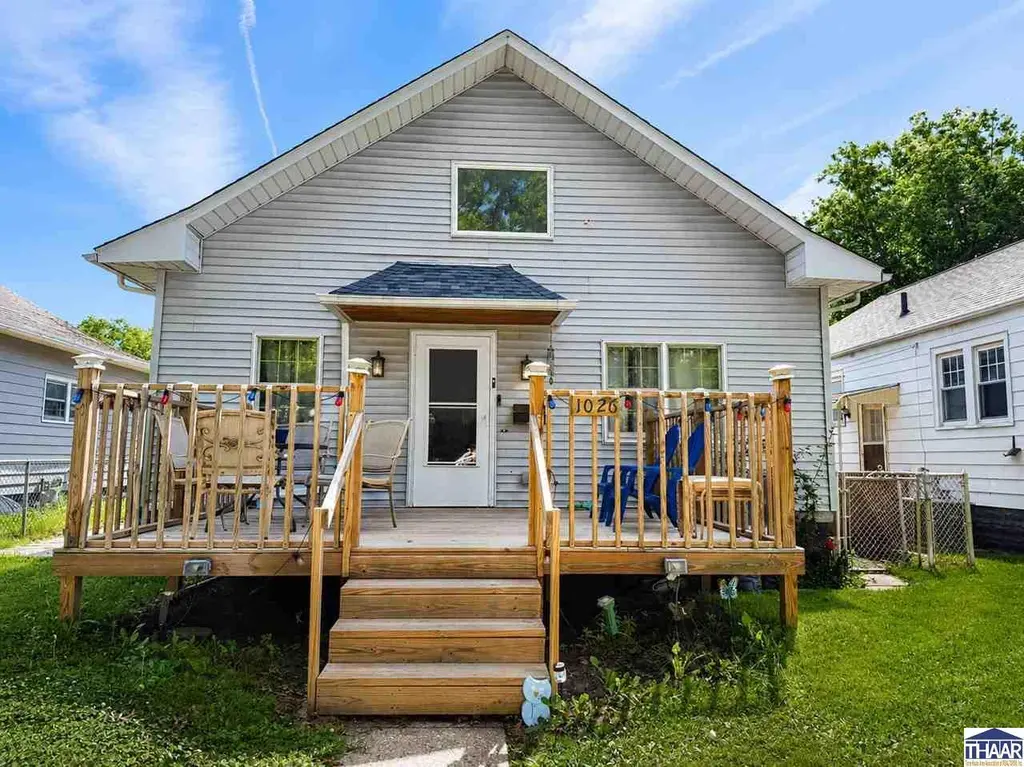
1026 S 18th St · Terre Haute, IN
Flood risk 3/10 · Minor
- FEMA flood zone
- X (unshaded)
- Chance of flooding over 30 yrs
- 0.2%
- Est. flood insurance / yr
- $473 – $860
Fire risk 1/10 · Minimal
- Est. fire insurance / yr
- $717 – $1,331
Heat risk 4/10 · Minor
- Hot days now (above 104°F)
- 7 days/yr
- Hot days in 30 yrs
- 19 days/yr
Wind risk 2/10 · Minimal
- Chance of severe wind over 30 yrs
- 1.0%
Air-quality risk 3/10 · Minor
- Unhealthy air days now
- 3 days/yr
- Unhealthy air days in 30 yrs
- 4 days/yr
Risk factors via First Street. Map © Google.
Why this score? — see what drove the C+ grade
The composite is a weighted blend of 9 inputs, each scored 0–100. Each bar is that input's sub-score; the figure is the points it added to the 100-point composite (weight × sub-score).
- Cash flow +22.7/30.0
- ARV discount +12.0/15.0
- DSCR +7.3/10.0
- 1% rule +5.9/10.0
- Livability +3.8/5.0
- Rent growth +3.5/5.0
- Schools +2.9/10.0
- Condition / age +2.5/5.0
- Appreciation +0.0/10.0
$127,900
🖨 Deal sheet 📄 Offer letter ✓ Due diligence
Listing remarks
Have you been wanting that home that comes with the important updates (roof replaced in fall 2024; downstairs bathroom remodeled in 2025; dining room floor replaced in 2019 and living room floor replaced in 2021; and deck redone in 2023) while also leaving room for the aesthetic updates of the next homeowner? Then this is your home! Featuring 3 beds, 2 baths, an attached 1-car garage, a sizable basement, bonus rooms, and a fenced-in back yard, this home offers the perfect blend of updates and opportunity.
Key facts
- Deck redone
- Roof replaced
- Garage
Tags
Property features AI
Exterior
- Parking: Attached paved garage with 1 parking space
- Utilities: Public sewer
- Home design: Single-family residence; 2 stories
- Construction: Vinyl siding
- Exterior features: Deck; Patio; Shingle roof
Interior
- Kitchen: Electric range and oven; Microwave; Dishwasher; Refrigerator; Garbage disposal
- Bedrooms: 5 total rooms (bedroom count not specified)
- Flooring: Carpet; Laminate; Vinyl
- Bathrooms: 2 full bathrooms
- Heating & cooling: Natural gas heating; Central air conditioning
- Interior features: Dishwasher; Dryer; Electric range; Electric oven; Microwave; Refrigerator; Washer; Garbage disposal; Partial basement
- Laundry & utility: Washer and dryer included
Neighborhood map
What this means for you Summary
Snapshot
- This is a 3-bed/1.0-bath single-family listed at $128k.
Deal economics
- At list price, monthly cash flow is $220 ($3k/yr) — positive.
- The deal already cash-flows at list — no discount required.
- Meets the 1% rule at list price ($1k rent vs $128k).
- Cap rate 8.4% vs local median 4.7% in Terre Haute — top-decile yield for the area; either an underpriced asset or a hidden risk that comps aren't pricing in. Stress-test before assuming the spread holds.
Location & tenants
- Location reads 75/100 on livability (#63 in IN, #4,186 nationally) — a middle-class / working-renter tenant base. Strengths: cost of living A+, housing A+, health & safety A+; Watch: crime F, employment F.
- Vigo County School Corporation (urban): math 32% / reading 37% proficiency, ranked #202 of 301 in IN (top 67%) — families likely to look elsewhere, expect single-tenant / working-renter base with shorter leases.
- Zoned schools: Sarah Scott Middle School (math 8% / reading 18%, grade F, #304 of 330 statewide, top 94%, 397 students, 86% FRL); Terre Haute South Vigo High School (math 37% / reading 72%, grade C-, #79 of 369 statewide, top 26%, 1,610 students, 51% FRL) — zoned schools average 69% FRL vs 47% district-wide (22 pts higher); higher-poverty schools than district average — tighter screening recommended.
- Market conditions: Rents rising fast (+4.1%/yr); 177 active listings in the ZIP; 9 comparable units currently listed for rent nearby; rentals lingering (median 44d on market — plan ~5-8 weeks vacancy on turnover, expect pricing pressure); 100% of comp listings sitting > 30 days — soft ceiling on asking rent; 60 units permitted in Vigo County in 2024 (0 in 5+ unit buildings).
Forward outlook
- Local home prices are declining (-3.0%/yr); year-one equity from $884 of loan paydown is wiped out by about $4k of value loss. Plan a longer hold.
- Vigo County population projected to shrink 5% by 2050 — rents likely to lag national; underwrite the cash flow, not the appreciation.
Negotiation context
- Only 3 days on market — expect competitive offers; lowballing is unlikely to land.
Risks & watch-outs
- Watch-outs: built in 1898 — expect roof / HVAC / electrical / plumbing capex.
Questions for the listing agent
- Built in 1898 — when were the roof, HVAC, electrical panel, plumbing, and water heater last replaced?
- Is there a deadline driving the sale (1031 exchange, divorce, estate, relocation)? That informs how much negotiation room exists.
- Schools are D-rated, which usually means shorter tenancies and higher turnover. Who's the typical renter profile here, and what's been the actual vacancy rate?
- Crime grade is F in this area — have there been break-ins, vandalism, or insurance claims at this property in the last 3 years? What carrier currently insures it and at what premium?
- What's the average days-on-market for RENTAL listings here right now (not sales)? A rising rental-DOM trend means longer vacancies and softer asking-rent achievability than the comps imply.
- What's the recent tenant-quality profile in this submarket — average credit score on applications, eviction rate, late-payment / NSF rate, and stable-employment percentage? A property-management company in the area should have these aggregated.
- How much new for-sale + rental construction is in the pipeline within 1–3 miles? Heavy new supply typically softens prices + rents 12–24 months out; constrained supply supports both.
Investment metrics
- 1% rule
- 1.09% ✓
- Cap rate
- 8.35%
- Cash-on-cash
- 7.36%
- DSCR
- 1.33
- GRM
- 7.7
CMA / ARV
- ARV (on-the-fly)
- $142,272
- Comps found
- 12
Show comp detail 12 sales within ~0.75 mi
| Address | Dist | Beds/Ba | Sqft | Sold | Price | $/sf | Match |
|---|---|---|---|---|---|---|---|
| 1008 S 20th St | 0.13mi | 2/1.0 (-1) | 1,225 (-10%) | 1mo | $115,000 | $94 | 71 |
| 2709 Crawford St | 0.74mi | 3/1.0 | 1,363 (-0%) | 1mo | $192,444 | $141 | 64 |
| 1017 S 25th St | 0.53mi | 2/1.0 (-1) | 1,436 (+5%) | 1mo | $90,000 | $63 | 61 |
| 1940 S 19th St | 0.73mi | 3/2.0 | 1,376 (+1%) | 4mo | $220,000 | $160 | 58 |
| 1944 S 19th St | 0.73mi | 3/2.0 | 1,376 (+1%) | 5mo | $213,750 | $155 | 57 |
| 2512 Farrington St | 0.60mi | 3/1.0 | 1,245 (-9%) | 0mo | $149,900 | $120 | 57 |
| 2520 College Ave | 0.60mi | 3/1.5 | 1,474 (+8%) | 4mo | $89,900 | $61 | 54 |
| 2236 Park St | 0.39mi | 3/2.0 | 1,562 (+14%) | 2mo | $137,900 | $88 | 53 |
| 1515 S 17th St | 0.37mi | 2/1.0 (-1) | 1,184 (-14%) | 5mo | $105,000 | $89 | 51 |
| 1411 Ohio St | 0.72mi | 2/1.5 (-1) | 1,456 (+6%) | 5mo | $151,000 | $104 | 45 |
| 1006 S 25th St | 0.57mi | 2/2.0 (-1) | 1,207 (-12%) | 3mo | $169,900 | $141 | 42 |
| 1407 Ohio St | 0.72mi | 3/1.5 | 1,178 (-14%) | 4mo | $29,500 | $25 | 38 |
Match score weights: distance 35% · size 25% · config 20% · recency 20%. Top-matched comps best support the ARV.
Projected returns pro-forma
-3.0% appreciation · 4.09% rent growth · sell at horizon
- IRR
- -3.8%
- Equity multiple
- 0.86×
- Total profit
- $-5,170
- Equity at exit
- $19,070
- IRR
- 7.1%
- Equity multiple
- 1.56×
- Total profit
- $20,059
- Equity at exit
- $11,058
Cash invested: $35,812 (down + closing). Projections, not guarantees.
Landlord ↔ Tenant lean methodology
- Overall (STATE)
- 90 Strongly Landlord-Friendly
- State Indiana
- 90 Strongly Landlord-Friendly · R+11
- County
- — inherits STATE
- City
- — inherits STATE
ZIP-level market 47803
- Home prices YoY
- -28.6%
- Rents YoY
- 4.1%
- Active inventory
- 177
- Price-to-rent
- 7.7×
Monthly cashflow live
- Estimated rent
- $1,390 high interval (Pro) →
- Mortgage (P&I)
- −$671
- Tax from tax record
- −$155 /mo · $1,855/yr
- Insurance
- −$53
- HOA
- −$0
- Vacancy / Maint / Mgmt
- −$292
- Net cashflow
- $220
Break-even live
UW: 25.0% down · 7.5% · 30yr · 1.5% tax · 5.0% vac · 8.0% maint · 8.0% mgmt
Financing live
Cash to close
- Down payment
- $31,975
- Closing costs
- $3,837
- Reserves months
- —
- Total cash needed
- —
Loan-product check · same deal, 3 products live
Conventional
25% down · 7.5% · 30yr
- Down + closing
- —
- Monthly P&I
- —
- Monthly cashflow
- —
- DSCR
- —
- Eligible?
- —
Personal DTI + credit; lowest rate.
DSCR
20% down · 8.5% · 30yr
- Down + closing
- —
- Monthly P&I
- —
- Monthly cashflow
- —
- DSCR
- —
- Eligible?
- —
No personal income docs; deal must DSCR.
Hard money
10% down · 12.0% · 12mo
- Down + closing
- —
- Monthly P&I
- —
- Monthly cashflow
- —
- DSCR
- —
- Eligible?
- —
Short-term bridge; refi at stabilization.
Rent comps 9 comps
| Address | Beds | Baths | Sqft | Rent | $/sqft | DOM | Units | Dist |
|---|---|---|---|---|---|---|---|---|
| 501 S 19th St Terre Haute, IN | 2.0 | 1.0 | 1200 | $975 | $0.81 | 43d | 1 | 0.34mi |
| 435 S 18th St Terre Haute, IN | 3.0 | 1.0 | 1108 | $1,050 | $0.95 | 43d | 1 | 0.40mi |
| 1915 Poplar St Unit A Terre Haute, IN | 3.0 | 1.0 | 1412 | $1,200 | $0.85 | 43d | 1 | 0.46mi |
| 2116 Poplar St Terre Haute, IN | 4.0 | 1.5 | 1872 | $1,900 | $1.01 | 43d | 1 | 0.53mi |
| 1701 Ohio St Unit C Terre Haute, IN | 2.0 | 1.0 | 880 | $950 | $1.08 | 43d | 1 | 0.64mi |
| 1201 S 7th St Unit 3 Terre Haute, IN | 3.0 | 1.0 | 880 | $925 | $1.05 | 43d | 1 | 0.98mi |
| 600 S Center St Unit 602 Terre Haute, IN | 3.0 | 1.5 | 1500 | $2,500 | $1.67 | 43d | 1 | 1.06mi |
| 1611 S 7th St Apt 4 Terre Haute, IN | 2.0 | 1.0 | 1022 | $795 | $0.78 | 43d | 1 | 1.09mi |
| 1011 S 4th St Terre Haute, IN | 2.0 | 1.0 | 1268 | $750 | $0.59 | 43d | 1 | 1.27mi |
Listing history 4 events
-
2026-06-01status $127,900 Pending 3 DOM
-
2026-05-31days on market $127,900 Active 3 DOM
-
2026-05-30days on market $127,900 Active 2 DOM
-
2026-05-28$127,900 Active
ⓘ Source: listings_history table (triggers on properties + properties_extension) + one-shot
backfill from property_details.listing_events for pre-trigger history.
Tax reassessment forecast IN · Partial reset (capped growth)
- Current annual tax
- $1,855 · $155/mo
- Projected year-2 tax
- $1,855 · $155/mo
- Expected delta
- $0/yr ($0/mo · 0.0%)
ⓘ Screening estimate from a state-policy table — verify with the county assessor before closing.
Climate risk First Street
- Flood 3/10 Moderate FEMA zone X (unshaded) · 20% chance over 30 yrs
- Wildfire 1/10 Low
- Heat 4/10 Moderate 7 d/yr ≥104°F today · 19 d/yr by 30 yrs out
- Wind 2/10 Low 100% chance of damaging wind over 30 yrs
- Air quality 3/10 Moderate 3 unhealthy d/yr today · 4 by 30 yrs out
Nearby sold comps map
Loading sold comps map…
Walkable amenities ~0.75 mi
Loading nearby amenities…
Taxation est. · year 1
- Rental income
- $16,684
- − Mortgage interest
- −$7,164
- − Property taxes
- −$1,855
- − Insurance
- −$640
- − Repairs & maintenance
- −$1,335
- − Management
- −$1,335
- − Depreciation
- −$3,721
- Taxable income
- $635
- Est. tax owed @ 24.0%
- −$152
- After-tax cash flow
- $2,485/yr
For passive investors: Depreciation is non-cash, so a rental often shows a tax loss while cash-flowing — sheltering income. Rental losses are passive: they offset passive income freely, and up to $25,000/yr can offset ordinary (W-2) income if you actively participate and your MAGI is under $100k (phasing out to $0 by $150k); unused losses carry forward. On sale, claimed depreciation is recaptured at up to 25%, and gains may owe capital-gains tax (a 1031 exchange can defer both). Figures are a year-1 estimate at your 24.0% rate — not tax advice; consult a CPA.
Schools (NCES district)
- District
- Vigo County School Corporation
- NCES district ID
- 1812090
- Math proficiency
- 32% ▼ -10.00%
- Reading proficiency
- 37% ▼ -8.00%
- Median HH income
- $40,100
- Composite
- 28.97/100
- National rank
- #6625
- State rank
- #202 of 301 in IN
Livability — Terre Haute
- Score
- 75/100
- State rank
- #63
- US rank
- #4186
Category grades
Schools grade is shown separately in the Schools card above.
Census & demographics
- Census place
- Terre Haute, IN
- County
- Vigo County · 91,193 people
- City population
- 91,193
- Metro
- Terre Haute, IN
- Population (ZIP)
- 21,746
- Household income
- $60,565
- Rent vs Own
- Severe rent burden
- 571.0
Population outlook (Vigo County) Hauer SSP2
- Today (2025)
- 106,366 people
- By 2030
- 105,674 · -0.7%
- By 2040
- 103,731 · -2.5%
- By 2050
- 101,200 · -4.9%
- By 2075
- 95,674 · -10.1%
- By 2100
- 85,910 · -19.2%
Race, ethnicity, and origin ACS 2023
- Neighborhood character
- Predominantly White (86%)
- Race & ethnicity
- White 86% Asian 5% Two or more races 4% Black 3% Hispanic / Latino 3%
- Common ancestry
- Slovak 2% Lithuanian 2% Italian 1%
- Foreign-born
- 5% · China, Canada
- Languages at home
- 94% English-only · Chinese 2% Spanish 1% Other Asian/Pacific 1%
Political lean MEDSL · Vigo
- 2024 margin
- R (+18.1) · D 40.0% · R 58.1% · Other 2.0%
- 2008→2024 swing
- -33.9pp toward R · 2008: 15.8pp · 2024: -18.1pp
- All cycles
- 2024: R+18.1 2020: R+14.7 2016: R+15.2 2012: D+0.8 2008: D+15.8
Not yet ingested
- Civics
- —
Market trends
- HPI YoY
- ▼ -69.70%
- Current HPI
- 173.6547
- Rent YoY
- ▲ 4.09%
- Metro
- Terre Haute, IN
- State GDP YoY
- ▲ 2.90%
- F500 in state
- 18
Industry mix (Fortune 500 HQ in IN)
| Industry | F500 HQs | Revenue |
|---|---|---|
| Industrial Machinery | 2 | $37B |
|
||
| Healthcare | 1 | $177B |
|
||
| Pharmaceuticals | 1 | $45B |
|
||
| Metals / Steel | 1 | $18B |
|
||
| Agriculture | 1 | $17B |
|
||
| Packaging | 1 | $12B |
|
||
Price history
1 event — show timeline
- 2026-05-28 Listed $127,900 THAAR
Property tax history
+13.2%/yrLatest (2024): $1,855 · +4.8% YoY. Source: county tax records.
Cash-flow waterfall
monthlySold comps — $/sqft
last 12 mo · ≤1 miLoading sold comps…