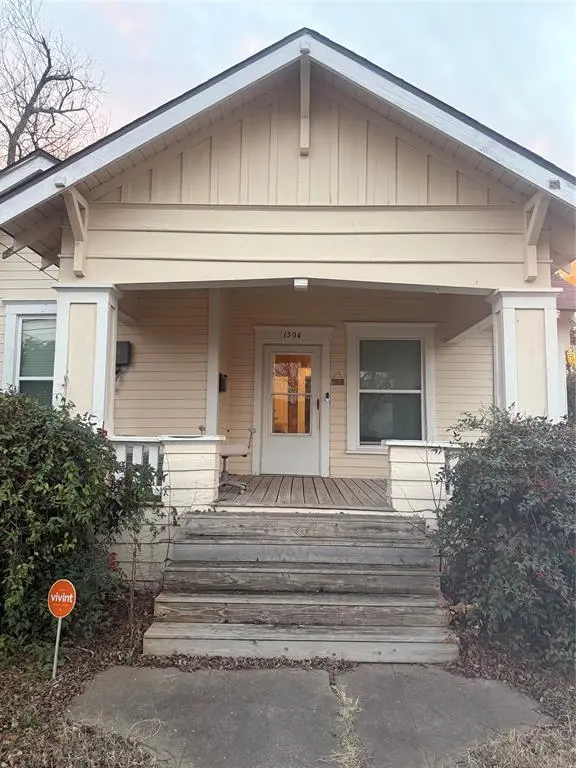
1304 N 22nd · Waco, TX
Flood risk 1/10 · Minimal
- FEMA flood zone
- X (unshaded)
- Chance of flooding over 30 yrs
- 0.0%
- Est. flood insurance / yr
- $507 – $1,088
Fire risk 1/10 · Minimal
- Est. fire insurance / yr
- $1,222 – $2,270
Heat risk 7/10 · Major
- Hot days now (above 109°F)
- 7 days/yr
- Hot days in 30 yrs
- 24 days/yr
Wind risk 6/10 · Moderate
- Chance of severe wind over 30 yrs
- 59.0%
Air-quality risk 2/10 · Minimal
- Unhealthy air days now
- 0 days/yr
- Unhealthy air days in 30 yrs
- 1 days/yr
Risk factors via First Street. Map © Google.
Why this score? — see what drove the B+ grade
The composite is a weighted blend of 9 inputs, each scored 0–100. Each bar is that input's sub-score; the figure is the points it added to the 100-point composite (weight × sub-score).
- Cash flow +30.0/30.0
- ARV discount +15.0/15.0
- DSCR +10.0/10.0
- 1% rule +9.3/10.0
- Livability +3.7/5.0
- Rent growth +2.8/5.0
- Condition / age +2.5/5.0
- Schools +1.8/10.0
- Appreciation +0.0/10.0
$110,000
🖨 Deal sheet 📄 Offer letter ✓ Due diligence
Listing remarks MLS
Charming 3 bedroom home with a den in the heart of Waco. Super well priced. Needs a little TLC and it will make a cozy home or great investment property. Grand front porch and a lovely fireplace. Brand new windows as well.
Key facts
- Front porch
- Fireplace
- New windows
Tags
Neighborhood map
What this means for you Summary
Snapshot
- This is a 3-bed/1.0-bath single-family listed at $110k.
Deal economics
- At list price, monthly cash flow is $426 ($5k/yr) — positive.
- The deal already cash-flows at list — no discount required.
- Meets the 1% rule at list price ($2k rent vs $110k).
- Recommended offer: $100k (9.0% below list) — sets the bar for market timing.
- Cap rate 10.9% vs local median 3.9% in Waco — top-decile yield for the area; either an underpriced asset or a hidden risk that comps aren't pricing in. Stress-test before assuming the spread holds.
Location & tenants
- Location reads 74/100 on livability (#166 in TX, #4,378 nationally) — a middle-class / working-renter tenant base. Strengths: cost of living A+, housing A+, health & safety A+; Watch: schools D, crime D, commute F.
- Waco ISD (urban): math 20% / reading 24% proficiency, ranked #773 of 826 in TX (top 94%) — low school quality limits family demand, transient renter base, plan for 1-2y turnover; 81% free/reduced lunch — lower-income household profile, screen leases tightly.
- Market conditions: Rents rising (+1.1%/yr); 144 active listings in the ZIP; 40 comparable units currently listed for rent nearby; rentals at typical pace (median 21d on market — plan ~3-4 weeks tenant-placement turnaround); lower-income renter base — watch delinquency; 1,014 units permitted in McLennan County in 2024 (200 in 5+ unit buildings).
- At $1,571/mo this rent would consume 47% of the median local household income ($40k/yr) (locally 704% of renters already pay >50% of income on rent) — very limited rent-growth headroom before tenants either downsize or default.
Forward outlook
- Local home prices are declining (-3.0%/yr); year-one equity from $761 of loan paydown is wiped out by about $3k of value loss. Plan a longer hold.
- McLennan County population projected at +17% by 2050 — long-run rental-demand tailwind backs the buy-and-hold thesis.
- At projected returns (-3.0% appreciation + 1.1% rent growth), your $31k cash investment doubles in ~9 years — after that, you're playing with house money.
Negotiation context
- It's been on market 98 days — a 9% lower offer ($100k) is reasonable based on typical stale-listing flexibility.
- 2 sale attempts; this cycle's ask has dropped $45k (29%) from the opening price — seller is motivated, your offer sets the floor, not the list.
Risks & watch-outs
- Watch-outs: built in 1920 — expect roof / HVAC / electrical / plumbing capex.
- Climate carrying-cost: major wind risk, 59% chance of damaging wind over 30y; extreme-heat days projected 7→24/yr by 2055 (HVAC capex compounding) — expect insurance premiums to compound above CPI over the hold.
Questions for the listing agent
- It's been on market 98 days. Have you received any prior offers? Is the seller open to a 9% concession, seller financing, or rate buy-down credit?
- Built in 1920 — when were the roof, HVAC, electrical panel, plumbing, and water heater last replaced?
- Why hasn't it sold? Are there any deal-killer items the seller is aware of (foundation, flood, title, zoning, code violations)?
- Is there a deadline driving the sale (1031 exchange, divorce, estate, relocation)? That informs how much negotiation room exists.
- Schools are D-rated, which usually means shorter tenancies and higher turnover. Who's the typical renter profile here, and what's been the actual vacancy rate?
- Crime grade is D in this area — have there been break-ins, vandalism, or insurance claims at this property in the last 3 years? What carrier currently insures it and at what premium?
- What's the average days-on-market for RENTAL listings here right now (not sales)? A rising rental-DOM trend means longer vacancies and softer asking-rent achievability than the comps imply.
- What's the recent tenant-quality profile in this submarket — average credit score on applications, eviction rate, late-payment / NSF rate, and stable-employment percentage? A property-management company in the area should have these aggregated.
- How much new for-sale + rental construction is in the pipeline within 1–3 miles? Heavy new supply typically softens prices + rents 12–24 months out; constrained supply supports both.
Investment metrics
- 1% rule
- 1.43% ✓
- Cap rate
- 10.94%
- Cash-on-cash
- 16.61%
- DSCR
- 1.74
- GRM
- 5.8
CMA / ARV
- ARV (median comp)
- $177,104
- List price
- $110,000
- Delta
- -37.89%
- Verdict
- UNDERPRICED
- Comps
- 20 within 1.0 mi
Show comp detail 12 sales within ~0.75 mi
| Address | Dist | Beds/Ba | Sqft | Sold | Price | $/sf | Match |
|---|---|---|---|---|---|---|---|
| 1304 N 22nd | 0.00mi | 3/1.0 | 1,383 (0%) | 0mo | $110,000 | $80 | 100 |
| 2015 Gorman Ave | 0.31mi | 2/1.0 (-1) | 1,320 (-5%) | 0mo | $140,000 | $106 | 73 |
| 2023 Ethel Ave | 0.14mi | 3/2.0 | 1,508 (+9%) | 2mo | $220,000 | $146 | 73 |
| 2401 Colcord Ave | 0.23mi | 3/2.5 | 1,478 (+7%) | 0mo | $265,000 | $179 | 72 |
| 2920 Ethel Ave | 0.55mi | 3/1.0 | 1,330 (-4%) | 2mo | $169,900 | $128 | 66 |
| 2701 Ethel Ave | 0.39mi | 3/1.0 | 1,554 (+12%) | 2mo | $150,000 | $97 | 60 |
| 1122 N 14th St | 0.64mi | 3/1.0 | 1,472 (+6%) | 1mo | $40,000 | $27 | 58 |
| 2710 Cumberland Ave | 0.68mi | 3/2.0 | 1,448 (+5%) | 1mo | $285,000 | $197 | 56 |
| 2912 E Edmond Ave | 0.66mi | 3/1.0 | 1,262 (-9%) | 0mo | $175,000 | $139 | 54 |
| 1123 N 14th St | 0.67mi | 3/1.0 | 1,272 (-8%) | 1mo | $40,000 | $31 | 54 |
| 2108 Fort Ave | 0.57mi | 4/2.0 (+1) | 1,578 (+14%) | 2mo | $315,000 | $200 | 40 |
| 3112 Homan Ave | 0.72mi | 3/2.0 | 1,586 (+15%) | 1mo | $220,000 | $139 | 38 |
Match score weights: distance 35% · size 25% · config 20% · recency 20%. Top-matched comps best support the ARV.
Projected returns pro-forma
-3.0% appreciation · 1.14% rent growth · sell at horizon
- IRR
- 5.6%
- Equity multiple
- 1.21×
- Total profit
- $6,495
- Equity at exit
- $16,401
- IRR
- 13.2%
- Equity multiple
- 1.96×
- Total profit
- $29,435
- Equity at exit
- $9,511
Cash invested: $30,800 (down + closing). Projections, not guarantees.
Landlord ↔ Tenant lean methodology
- Overall (STATE)
- 87 Strongly Landlord-Friendly
- State Texas
- 87 Strongly Landlord-Friendly · R+5
- County
- — inherits STATE
- City
- — inherits STATE
ZIP-level market 76707
- Rents YoY
- 1.1%
- Active inventory
- 144
- Price-to-rent
- 5.8×
Monthly cashflow live
- Estimated rent
- $1,571 high interval (Pro) →
- Mortgage (P&I)
- −$577
- Tax from tax record
- −$192 /mo · $2,307/yr
- Insurance
- −$46
- HOA
- −$0
- Vacancy / Maint / Mgmt
- −$330
- Net cashflow
- $426
Break-even live
UW: 25.0% down · 7.5% · 30yr · 1.5% tax · 5.0% vac · 8.0% maint · 8.0% mgmt
Financing live
Cash to close
- Down payment
- $27,500
- Closing costs
- $3,300
- Reserves months
- —
- Total cash needed
- —
Loan-product check · same deal, 3 products live
Conventional
25% down · 7.5% · 30yr
- Down + closing
- —
- Monthly P&I
- —
- Monthly cashflow
- —
- DSCR
- —
- Eligible?
- —
Personal DTI + credit; lowest rate.
DSCR
20% down · 8.5% · 30yr
- Down + closing
- —
- Monthly P&I
- —
- Monthly cashflow
- —
- DSCR
- —
- Eligible?
- —
No personal income docs; deal must DSCR.
Hard money
10% down · 12.0% · 12mo
- Down + closing
- —
- Monthly P&I
- —
- Monthly cashflow
- —
- DSCR
- —
- Eligible?
- —
Short-term bridge; refi at stabilization.
Rent comps 40 comps
| Address | Beds | Baths | Sqft | Rent | $/sqft | DOM | Units | Dist |
|---|---|---|---|---|---|---|---|---|
| 1400 N 23rd St Waco, TX | 4.0 | 2.0 | 1650 | $1,575 | $0.95 | 13d | 1 | 0.10mi |
| 2001 Bosque Blvd Waco, TX | 3.0 | 1.0 | 1628 | $1,100 | $0.68 | 43d | 1 | 0.19mi |
| 1000 N 19th St Waco, TX | 3.0 | 1.5 | 1800 | $2,050 | $1.14 | 21d | 1 | 0.29mi |
| 2511 Parrott Ave Waco, TX | 3.0 | 2.0 | 1463 | $1,695 | $1.16 | 43d | 1 | 0.33mi |
| 1821 Algonquin St Waco, TX | 2.0 | 1.0 | 930 | $1,150 | $1.24 | 43d | 1 | 0.34mi |
| 1815 Seneca Ave Waco, TX | 3.0 | 2.0 | 1471 | $1,650 | $1.12 | 21d | 1 | 0.39mi |
| 2705 Bosque Blvd Waco, TX | 3.0 | 2.0 | 1028 | $1,599 | $1.56 | 43d | 1 | 0.40mi |
| 2632 Colonial Ave Unit B Waco, TX | 2.0 | 1.0 | 896 | $1,050 | $1.17 | 21d | 1 | 0.42mi |
| 2116 Morrow Ave Waco, TX | 4.0 | 2.0 | 1703 | $1,650 | $0.97 | 21d | 1 | 0.43mi |
| 2724 Bosque Blvd Waco, TX | 2.0 | 1.0 | 1120 | $1,100 | $0.98 | 21d | 1 | 0.46mi |
| 615 N 23rd St Waco, TX | 2.0 | 1.0 | 900 | $1,275 | $1.42 | 21d | 1 | 0.54mi |
| 608 N 23rd St Waco, TX | 3.0 | 1.0 | 1361 | $1,695 | $1.25 | 21d | 1 | 0.56mi |
| 1825 Cumberland Ave Waco, TX | 3.0 | 1.0 | 1400 | $1,325 | $0.95 | 13d | 1 | 0.60mi |
| 2000 Windsor Ave Waco, TX | 4.0 | 2.5 | 1450 | $1,800 | $1.24 | 43d | 1 | 0.61mi |
| 1901 N 28th St Waco, TX | 3.0 | 2.0 | 1794 | $1,950 | $1.09 | 21d | 1 | 0.61mi |
| 1920 Windsor Ave Waco, TX | 3.0 | 1.0 | 1216 | $1,200 | $0.99 | 43d | 1 | 0.62mi |
| 3007 Parrott Ave Unit 1 Waco, TX | 3.0 | 2.0 | 1458 | $1,650 | $1.13 | 21d | 1 | 0.64mi |
| 1818 Windsor Ave Waco, TX | 4.0 | 2.0 | 1112 | $1,625 | $1.46 | 21d | 1 | 0.65mi |
| 2714 Morrow Ave Waco, TX | 2.0 | 1.0 | 1484 | $1,375 | $0.93 | 21d | 1 | 0.65mi |
| 415 N 23rd St Waco, TX | 3.0 | 2.0 | 1680 | $2,000 | $1.19 | 21d | 1 | 0.66mi |
| 2601 Fort Ave Unit 4 Waco, TX | 2.0 | 1.0 | 1000 | $990 | $0.99 | 43d | 1 | 0.68mi |
| 1511 Maple Ave Waco, TX | 3.0 | 2.0 | 1487 | $1,450 | $0.98 | 43d | 1 | 0.70mi |
| 2621 Windsor Ave Waco, TX | 2.0 | 1.0 | 1108 | $1,175 | $1.06 | 21d | 1 | 0.72mi |
| 2714 Windsor Ave Waco, TX | 2.0 | 1.0 | 979 | $1,300 | $1.33 | 43d | 1 | 0.73mi |
| 3125 Ethel Ave Waco, TX | 3.0 | 2.0 | 1760 | $1,900 | $1.08 | 21d | 1 | 0.75mi |
| 3121 Colonial Ave Waco, TX | 3.0 | 2.0 | 1085 | $1,600 | $1.47 | 43d | 1 | 0.76mi |
| 3121 Colonial Ave Waco, TX | 3.0 | 2.0 | 1085 | $1,600 | $1.47 | 21d | 1 | 0.76mi |
| 3116 Bosque Blvd Waco, TX | 2.0 | 1.0 | 1100 | $1,250 | $1.14 | 13d | 1 | 0.77mi |
| 716 N 13th St Waco, TX | 4.0 | 2.0 | 1349 | $1,675 | $1.24 | 21d | 1 | 0.82mi |
| 1600 N 11th St Unit A Waco, TX | 3.0 | 2.0 | 1217 | $1,750 | $1.44 | 43d | 1 | 0.82mi |
| 1110 N 11th St Waco, TX | 3.0 | 2.0 | 1172 | $1,495 | $1.28 | 21d | 1 | 0.84mi |
| 1104 N 11th St Waco, TX | 3.0 | 2.0 | 1231 | $1,650 | $1.34 | 21d | 1 | 0.85mi |
| 2300 Washington Ave Waco, TX | 3.0 | 1.0 | 1232 | $1,650 | $1.34 | 13d | 1 | 0.87mi |
| 3400 W Brookview Dr Waco, TX | 1.0–2.0 | 1.0 | 865 | $1,209 | $1.40 | 13d | 5 | 0.88mi |
| 1923 Austin Ave Unit 5202 Waco, TX | 2.0 | 2.5 | 1265 | $1,395 | $1.10 | 21d | 1 | 0.90mi |
| 2505 Proctor Ave Waco, TX | 3.0 | 2.0 | 1588 | $1,550 | $0.98 | 21d | 1 | 0.91mi |
| 804 N 11th St Waco, TX | 1.0–2.0 | 1.0 | 838 | $1,200 | $1.43 | 21d | 1 | 0.91mi |
| 1606 N 9th St Waco, TX | 4.0 | 2.0 | 1392 | $1,525 | $1.10 | 21d | 1 | 0.99mi |
| 2704 Herring Ave Waco, TX | 2.0 | 2.0 | 1286 | $1,750 | $1.36 | 21d | 1 | 0.99mi |
| 2601 Herring Ave Unit 1 Waco, TX | 3.0 | 1.0 | 989 | $1,295 | $1.31 | 43d | 1 | 1.00mi |
Listing history 7 events
-
2026-05-20status Pending 222-char remark
Show marketing remark (222 chars)
Charming 3 bedroom home with a den in the heart of Waco. Super well priced. Needs a little TLC and it will make a cozy home or great investment property. Grand front porch and a lovely fireplace. Brand new windows as well.
-
2026-05-03status Active 222-char remark
Show marketing remark (222 chars)
Charming 3 bedroom home with a den in the heart of Waco. Super well priced. Needs a little TLC and it will make a cozy home or great investment property. Grand front porch and a lovely fireplace. Brand new windows as well.
-
2026-04-28status Pending 222-char remark
Show marketing remark (222 chars)
Charming 3 bedroom home with a den in the heart of Waco. Super well priced. Needs a little TLC and it will make a cozy home or great investment property. Grand front porch and a lovely fireplace. Brand new windows as well.
-
2026-03-22price $110,000 222-char remark
Show marketing remark (222 chars)
Charming 3 bedroom home with a den in the heart of Waco. Super well priced. Needs a little TLC and it will make a cozy home or great investment property. Grand front porch and a lovely fireplace. Brand new windows as well.
-
2026-03-05price $139,000 222-char remark
Show marketing remark (222 chars)
Charming 3 bedroom home with a den in the heart of Waco. Super well priced. Needs a little TLC and it will make a cozy home or great investment property. Grand front porch and a lovely fireplace. Brand new windows as well.
-
2026-02-05$155,000 Active 222-char remark
Show marketing remark (222 chars)
Charming 3 bedroom home with a den in the heart of Waco. Super well priced. Needs a little TLC and it will make a cozy home or great investment property. Grand front porch and a lovely fireplace. Brand new windows as well.
-
1993-04-30soldstatus
ⓘ Source: listings_history table (triggers on properties + properties_extension) + one-shot
backfill from property_details.listing_events for pre-trigger history.
Tax reassessment forecast TX · Resets to sale price
- Current annual tax
- $2,307 · $192/mo
- Projected year-2 tax
- $2,307 · $192/mo
- Expected delta
- $0/yr ($0/mo · 0.0%)
ⓘ Screening estimate from a state-policy table — verify with the county assessor before closing.
Climate risk First Street
- Flood 1/10 Low FEMA zone X (unshaded) · 0% chance over 30 yrs
- Wildfire 1/10 Low
- Heat 7/10 Severe 7 d/yr ≥109°F today · 24 d/yr by 30 yrs out
- Wind 6/10 Major 59% chance of damaging wind over 30 yrs
- Air quality 2/10 Low 0 unhealthy d/yr today · 1 by 30 yrs out
Nearby sold comps map
Loading sold comps map…
Walkable amenities ~0.75 mi
Loading nearby amenities…
Taxation est. · year 1
- Rental income
- $18,854
- − Mortgage interest
- −$6,162
- − Property taxes
- −$2,307
- − Insurance
- −$550
- − Repairs & maintenance
- −$1,508
- − Management
- −$1,508
- − Depreciation
- −$3,200
- Taxable income
- $3,618
- Est. tax owed @ 24.0%
- −$868
- After-tax cash flow
- $4,247/yr
For passive investors: Depreciation is non-cash, so a rental often shows a tax loss while cash-flowing — sheltering income. Rental losses are passive: they offset passive income freely, and up to $25,000/yr can offset ordinary (W-2) income if you actively participate and your MAGI is under $100k (phasing out to $0 by $150k); unused losses carry forward. On sale, claimed depreciation is recaptured at up to 25%, and gains may owe capital-gains tax (a 1031 exchange can defer both). Figures are a year-1 estimate at your 24.0% rate — not tax advice; consult a CPA.
Schools (NCES district)
- District
- Waco ISD
- NCES district ID
- 4844280
- Math proficiency
- 20% ▼ -14.00%
- Reading proficiency
- 24% ▼ -6.00%
- Median HH income
- $29,208
- Composite
- 17.57/100
- National rank
- #9043
- State rank
- #773 of 826 in TX
Livability — Waco
- Score
- 74/100
- State rank
- #166
- US rank
- #4378
Category grades
Schools grade is shown separately in the Schools card above.
Census & demographics
- Census place
- Waco, TX
- County
- McLennan County · 213,088 people
- City population
- 125,319
- Metro
- Waco, TX
- Population (ZIP)
- 15,879
- Household income
- $40,443
- Rent vs Own
- Severe rent burden
- 704.0
Population outlook (McLennan County) Hauer SSP2
- Today (2025)
- 264,191 people
- By 2030
- 273,578 · +3.6%
- By 2040
- 291,506 · +10.3%
- By 2050
- 308,044 · +16.6%
- By 2075
- 349,648 · +32.3%
- By 2100
- 364,779 · +38.1%
Race, ethnicity, and origin ACS 2023
- Neighborhood character
- Diverse neighborhood (Simpson 0.64)
- Race & ethnicity
- Hispanic / Latino 47% Black 32% Two or more races 26% White 18%
- Hispanic origin (detail)
- Mexican 43%
- Common ancestry
- Romanian 1% Lithuanian 1% Italian 1%
- Foreign-born
- 15% · Canada
- Languages at home
- 65% English-only · Spanish 34% Tagalog/Filipino 1%
Political lean MEDSL · McLennan
- 2024 margin
- Solid R (+30.9) · D 34.0% · R 64.9% · Other 1.0%
- 2008→2024 swing
- -7.0pp toward R · 2008: -23.9pp · 2024: -30.9pp
- All cycles
- 2024: R+30.9 2020: R+23.4 2016: R+27.1 2012: R+29.8 2008: R+23.9
Not yet ingested
- Civics
- —
Market trends
- HPI YoY
- ▼ -134.95%
- Current HPI
- 239.639
- Rent YoY
- ▲ 1.14%
- Metro
- Waco, TX
- State GDP YoY
- ▲ 3.95%
- F500 in state
- 110
Industry mix (Fortune 500 HQ in TX)
| Industry | F500 HQs | Revenue |
|---|---|---|
| Energy | 16 | $1,198B |
|
||
| Technology | 5 | $198B |
|
||
| Engineering / Construction | 4 | $72B |
|
||
| Energy Services | 3 | $60B |
|
||
| Utilities | 3 | $41B |
|
||
| Healthcare | 2 | $330B |
|
||
Price history
-29.0% since first listed7 events — show timeline
- 2026-05-20 Pending — NTREIS
- 2026-05-03 Relisted — NTREIS
- 2026-04-28 Pending — NTREIS
- 2026-03-22 Price Changed $110,000 NTREIS
- 2026-03-05 Price Changed $139,000 NTREIS
- 2026-02-05 Listed $155,000 NTREIS
- 1993-04-30 Sold (Public Records) — Public Records
Property tax history
+7.8%/yrLatest (2025): $2,307 · +9.6% YoY. Source: county tax records.
Cash-flow waterfall
monthlySold comps — $/sqft
last 12 mo · ≤1 miLoading sold comps…