8845 E Washington Ln · Floral City, FL
Flood risk 1/10 · Minimal
- FEMA flood zone
- X (shaded)
- Chance of flooding over 30 yrs
- 0.0%
- Est. flood insurance / yr
- $507 – $1,088
Fire risk 3/10 · Minor
- Est. fire insurance / yr
- $947 – $1,759
Heat risk 9/10 · Severe
- Hot days now (above 108°F)
- 7 days/yr
- Hot days in 30 yrs
- 24 days/yr
Wind risk 9/10 · Severe
- Chance of severe wind over 30 yrs
- 99.0%
Air-quality risk 1/10 · Minimal
- Unhealthy air days now
- 0 days/yr
- Unhealthy air days in 30 yrs
- 0 days/yr
Risk factors via First Street. Map © Google.
Why this score? — see what drove the B- grade
The composite is a weighted blend of 9 inputs, each scored 0–100. Each bar is that input's sub-score; the figure is the points it added to the 100-point composite (weight × sub-score).
- Cash flow +28.5/30.0
- DSCR +10.0/10.0
- ARV discount +7.5/15.0
- 1% rule +7.3/10.0
- Schools +4.1/10.0
- Livability +3.4/5.0
- Rent growth +2.5/5.0
- Condition / age +2.5/5.0
- Appreciation +0.0/10.0
$103,900
🖨 Deal sheet 📄 Offer letter ✓ Due diligence
Listing remarks MLS
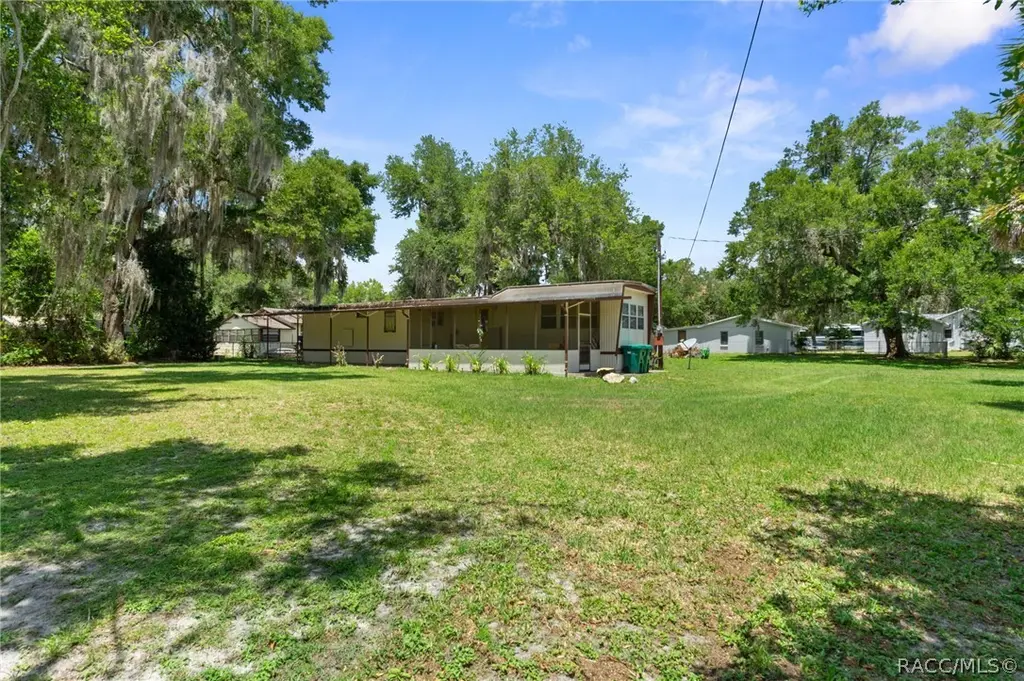
SNOWBIRD CHARMER * * GREAT DEEDED LAKE ACCESS ON FLORAL CITY LAKES * THIS 2 BEDROOM 1 BATH HOME SHOWS LIKE A DOLL HOUSE. * OWNERS HAVE USED FOR WEEKENDS * * OLDER BUT EXCEPTIONALLY WELL MAINTAINED. GARAGE 20 X 26 * FLORIDA ROOM 25 X 15PLUS FRONT SCREEN ROOM 9 X 24 THIS HOME WAS SET UP FOR OUT DOOR LIVING. STYLISH INTERIOR WITH LAMINATE AND CARPET FLOORS * BRIGHT AND CHEERY
Key facts
- Historic town
- Outdoor recreation
- Spacious lot
Tags
Property features AI
Exterior
- Parking: Detached garage; 2 garage spaces (2 total parking spaces); Driveway; paved and unpaved areas
- Utilities: Public water; Septic tank sewer
- Home design: Manufactured home (single wide); Residential property
- Construction: Single wide manufactured construction
- Exterior features: Metal roof; Rectangular lot; County road frontage; No pool
Interior
- Kitchen: Electric oven; Electric range; Refrigerator
- Flooring: Linoleum
- Bathrooms: 1 full bathroom
- Heating & cooling: Central heating (electric); Central air conditioning (electric)
- Interior features: Electric oven and electric range; Refrigerator
Neighborhood map
What this means for you Summary
Snapshot
- This is a 2-bed/1.0-bath manufactured listed at $104k.
Deal economics
- At list price, monthly cash flow is $338 ($4k/yr) — positive.
- The deal already cash-flows at list — no discount required.
- Meets the 1% rule at list price ($1k rent vs $104k).
- Recommended offer: $102k (1.5% below list) — sets the bar for market timing.
- Cap rate 10.2% vs local median 3.6% in Floral City — top-decile yield for the area; either an underpriced asset or a hidden risk that comps aren't pricing in. Stress-test before assuming the spread holds.
Location & tenants
- Location reads 67/100 on livability (#573 in FL) — a middle-class / working-renter tenant base. Strengths: cost of living A+, housing A+, crime B+; Watch: health & safety C-, amenities F, commute F.
- Citrus (rural): math 49% / reading 50% proficiency, ranked #44 of 73 in FL (top 60%) — families likely to look elsewhere, expect single-tenant / working-renter base with shorter leases.
- Zoned schools: Floral City Elementary School (math 47% / reading 52%, grade D, #1,088 of 2,144 statewide, top 53%, 389 students, 71% FRL); Inverness Middle School (math 52% / reading 48%, grade C, #254 of 571 statewide, top 45%, 1,017 students, 60% FRL); Citrus High School (math 34% / reading 51%, grade F, #264 of 667 statewide, top 41%, 1,503 students, 54% FRL) — zoned schools at 62% FRL track the district average.
- Market conditions: 144 active listings in the ZIP; 2,443 units permitted in Citrus County in 2024 (0 in 5+ unit buildings).
Forward outlook
- Local home prices are declining (-3.0%/yr); year-one equity from $718 of loan paydown is wiped out by about $3k of value loss. Plan a longer hold.
- Citrus County population projected to shrink 10% by 2050 — rents likely to lag national; underwrite the cash flow, not the appreciation.
- At projected returns (-3.0% appreciation + 3.0% rent growth), your $29k cash investment doubles in ~9 years — after that, you're playing with house money.
Negotiation context
- It's been on market 24 days — a 2% lower offer ($102k) is reasonable based on typical stale-listing flexibility.
- 2 sale attempts since 15y ago with the ask held roughly flat each time — persistent listings suggest the price (not the market) is what's stuck; bring a comps-based counter.
- Current owner paid $35k; list at $104k implies a 197% gain — meaningful room to come down on a strong offer.
Risks & watch-outs
- Climate carrying-cost: severe wind risk, 99% chance of damaging wind over 30y; extreme-heat days projected 7→24/yr by 2055 (HVAC capex compounding) — expect insurance premiums to compound above CPI over the hold.
Questions for the listing agent
- Built in 1973 — when were the roof, HVAC, electrical panel, plumbing, and water heater last replaced?
- Is there a deadline driving the sale (1031 exchange, divorce, estate, relocation)? That informs how much negotiation room exists.
- Schools are D-rated, which usually means shorter tenancies and higher turnover. Who's the typical renter profile here, and what's been the actual vacancy rate?
- What's the average days-on-market for RENTAL listings here right now (not sales)? A rising rental-DOM trend means longer vacancies and softer asking-rent achievability than the comps imply.
- What's the recent tenant-quality profile in this submarket — average credit score on applications, eviction rate, late-payment / NSF rate, and stable-employment percentage? A property-management company in the area should have these aggregated.
- How much new for-sale + rental construction is in the pipeline within 1–3 miles? Heavy new supply typically softens prices + rents 12–24 months out; constrained supply supports both.
Investment metrics
- 1% rule
- 1.23% ✓
- Cap rate
- 10.20%
- Cash-on-cash
- 13.95%
- DSCR
- 1.62
- GRM
- 6.8
CMA / ARV
No comps found within radius.
Projected returns pro-forma
-3.0% appreciation · 3.0% rent growth · sell at horizon
- IRR
- 4.2%
- Equity multiple
- 1.16×
- Total profit
- $4,697
- Equity at exit
- $15,492
- IRR
- 13.7%
- Equity multiple
- 2.09×
- Total profit
- $31,797
- Equity at exit
- $8,983
Cash invested: $29,092 (down + closing). Projections, not guarantees.
Landlord ↔ Tenant lean methodology
- Overall (STATE)
- 87 Strongly Landlord-Friendly
- State Florida
- 87 Strongly Landlord-Friendly · R+3
- County
- — inherits STATE
- City
- — inherits STATE
ZIP-level market 34436
- Home prices YoY
- -3.1%
- Active inventory
- 144
- Price-to-rent
- 6.8×
Monthly cashflow live
- Estimated rent
- $1,282 medium interval (Pro) →
- Mortgage (P&I)
- −$545
- Tax from tax record
- −$87 /mo · $1,039/yr
- Insurance
- −$43
- HOA
- −$0
- Vacancy / Maint / Mgmt
- −$269
- Net cashflow
- $338
Break-even live
UW: 25.0% down · 7.5% · 30yr · 1.5% tax · 5.0% vac · 8.0% maint · 8.0% mgmt
Financing live
Cash to close
- Down payment
- $25,975
- Closing costs
- $3,117
- Reserves months
- —
- Total cash needed
- —
Loan-product check · same deal, 3 products live
Conventional
25% down · 7.5% · 30yr
- Down + closing
- —
- Monthly P&I
- —
- Monthly cashflow
- —
- DSCR
- —
- Eligible?
- —
Personal DTI + credit; lowest rate.
DSCR
20% down · 8.5% · 30yr
- Down + closing
- —
- Monthly P&I
- —
- Monthly cashflow
- —
- DSCR
- —
- Eligible?
- —
No personal income docs; deal must DSCR.
Hard money
10% down · 12.0% · 12mo
- Down + closing
- —
- Monthly P&I
- —
- Monthly cashflow
- —
- DSCR
- —
- Eligible?
- —
Short-term bridge; refi at stabilization.
Listing history 22 events
-
2026-06-19days on market $103,900 Active 24 DOM
-
2026-06-18days on market $103,900 Active 23 DOM
-
2026-06-17days on market $103,900 Active 22 DOM
-
2026-06-16days on market $103,900 Active 21 DOM
-
2026-06-15days on market $103,900 Active 20 DOM
-
2026-06-14days on market $103,900 Active 18 DOM
-
2026-06-13days on market $103,900 Active 17 DOM
-
2026-06-10days on market $103,900 Active 15 DOM
-
2026-06-09days on market $103,900 Active 14 DOM
-
2026-06-08days on market $103,900 Active 13 DOM
-
2026-06-07days on market $103,900 Active 12 DOM
-
2026-06-03days on market $103,900 Active 8 DOM
-
2026-06-02days on market $103,900 Active 7 DOM
-
2026-06-01days on market $103,900 Active 6 DOM
-
2026-05-31days on market $103,900 Active 5 DOM
-
2026-05-30days on market $103,900 Active 4 DOM
-
2026-05-21$103,900 Active
-
2012-07-16soldstatus $35,000 388-char remark
Show marketing remark (388 chars)
SNOWBIRD CHARMER * * GREAT DEEDED LAKE ACCESS ON FLORAL CITY LAKES * THIS 2 BEDROOM 1 BATH HOME SHOWS LIKE A DOLL HOUSE. * OWNERS HAVE USED FOR WEEKENDS * * OLDER BUT EXCEPTIONALLY WELL MAINTAINED. GARAGE 20 X 26 * FLORIDA ROOM 25 X 15PLUS FRONT SCREEN ROOM 9 X 24 THIS HOME WAS SET UP FOR OUT DOOR LIVING. STYLISH INTERIOR WITH LAMINATE AND CARPET FLOORS * BRIGHT AND CHEERY
-
2011-08-22$39,900 388-char remark
Show marketing remark (388 chars)
SNOWBIRD CHARMER * * GREAT DEEDED LAKE ACCESS ON FLORAL CITY LAKES * THIS 2 BEDROOM 1 BATH HOME SHOWS LIKE A DOLL HOUSE. * OWNERS HAVE USED FOR WEEKENDS * * OLDER BUT EXCEPTIONALLY WELL MAINTAINED. GARAGE 20 X 26 * FLORIDA ROOM 25 X 15PLUS FRONT SCREEN ROOM 9 X 24 THIS HOME WAS SET UP FOR OUT DOOR LIVING. STYLISH INTERIOR WITH LAMINATE AND CARPET FLOORS * BRIGHT AND CHEERY
-
2008-01-03soldstatus $45,000
-
1995-04-06soldstatus $29,000
-
1994-11-01soldstatus $28,000
ⓘ Source: listings_history table (triggers on properties + properties_extension) + one-shot
backfill from property_details.listing_events for pre-trigger history.
Tax reassessment forecast FL · Resets to sale price
- Current annual tax
- $1,039 · $87/mo
- Projected year-2 tax
- $1,039 · $87/mo
- Expected delta
- $0/yr ($0/mo · 0.0%)
ⓘ Screening estimate from a state-policy table — verify with the county assessor before closing.
Climate risk First Street
- Flood 1/10 Low FEMA zone X (shaded) · 0% chance over 30 yrs
- Wildfire 3/10 Moderate
- Heat 9/10 Extreme 7 d/yr ≥108°F today · 24 d/yr by 30 yrs out
- Wind 9/10 Extreme 99% chance of damaging wind over 30 yrs
- Air quality 1/10 Low 0 unhealthy d/yr today · 0 by 30 yrs out
Nearby sold comps map
Loading sold comps map…
Walkable amenities ~0.75 mi
Loading nearby amenities…
Taxation est. · year 1
- Rental income
- $15,387
- − Mortgage interest
- −$5,820
- − Property taxes
- −$1,039
- − Insurance
- −$520
- − Repairs & maintenance
- −$1,231
- − Management
- −$1,231
- − Depreciation
- −$3,023
- Taxable income
- $2,524
- Est. tax owed @ 24.0%
- −$606
- After-tax cash flow
- $3,453/yr
For passive investors: Depreciation is non-cash, so a rental often shows a tax loss while cash-flowing — sheltering income. Rental losses are passive: they offset passive income freely, and up to $25,000/yr can offset ordinary (W-2) income if you actively participate and your MAGI is under $100k (phasing out to $0 by $150k); unused losses carry forward. On sale, claimed depreciation is recaptured at up to 25%, and gains may owe capital-gains tax (a 1031 exchange can defer both). Figures are a year-1 estimate at your 24.0% rate — not tax advice; consult a CPA.
Schools (NCES district)
- District
- Citrus
- NCES district ID
- 1200270
- Math proficiency
- 49% ▼ -10.00%
- Reading proficiency
- 50% ▼ -6.00%
- Median HH income
- $38,618
- Composite
- 41.28/100
- National rank
- #3519
- State rank
- #44 of 73 in FL
Livability — Floral City
- Score
- 67/100
- State rank
- #573
- US rank
- #10898
Category grades
Schools grade is shown separately in the Schools card above.
Census & demographics
- Census place
- Floral City, FL
- City population
- 8,170
- Population (ZIP)
- 8,170
Population outlook (Citrus County) Hauer SSP2
- Today (2025)
- 138,622 people
- By 2030
- 136,886 · -1.3%
- By 2040
- 132,009 · -4.8%
- By 2050
- 125,196 · -9.7%
- By 2075
- 108,570 · -21.7%
- By 2100
- 84,454 · -39.1%
Race, ethnicity, and origin ACS 2023
- Neighborhood character
- Predominantly White (86%)
- Race & ethnicity
- White 86% Two or more races 5% Hispanic / Latino 4% Black 4% Native American 2%
- Common ancestry
- Lithuanian 4% Italian 4% Iranian 1%
- Foreign-born
- 5% · Canada
- Languages at home
- 93% English-only · Spanish 5% French/Haitian/Cajun 1%
Political lean MEDSL · Citrus
- 2024 margin
- Solid R (+45.9) · D 26.8% · R 72.6%
- 2008→2024 swing
- -29.8pp toward R · 2008: -16.1pp · 2024: -45.9pp
- All cycles
- 2024: R+45.9 2020: R+41.0 2016: R+39.7 2012: R+21.9 2008: R+16.1
Not yet ingested
- Civics
- —
Market trends
- HPI YoY
- ▼ -12.20%
- Current HPI
- 374.4353
- Rent YoY
- —
- Metro
- —
- State GDP YoY
- ▲ 3.28%
- F500 in state
- 36
Industry mix (Fortune 500 HQ in FL)
| Industry | F500 HQs | Revenue |
|---|---|---|
| Industrial Technology | 2 | $29B |
|
||
| Insurance | 2 | $17B |
|
||
| Retail | 1 | $60B |
|
||
| Technology Distribution | 1 | $58B |
|
||
| Homebuilding | 1 | $35B |
|
||
| Technology Manufacturing | 1 | $35B |
|
||
Price history
+271.1% since first listed6 events — show timeline
- 2026-05-21 Listed $103,900 RACC
- 2012-07-16 Sold (MLS) $35,000 RACC
- 2011-08-22 Listed $39,900 RACC
- 2008-01-03 Sold (Public Records) $45,000 Public Records
- 1995-04-06 Sold (Public Records) $29,000 Public Records
- 1994-11-01 Sold (Public Records) $28,000 Public Records
Property tax history
+5.2%/yrLatest (2025): $1,039 · +11.1% YoY. Source: county tax records.
Cash-flow waterfall
monthlySold comps — $/sqft
last 12 mo · ≤1 miLoading sold comps…