905 Kirkwall Dr Unit 34A · Fairlawn, OH
Flood risk 1/10 · Minimal
- FEMA flood zone
- X (unshaded)
- Chance of flooding over 30 yrs
- 0.0%
- Est. flood insurance / yr
- $507 – $1,088
Fire risk 1/10 · Minimal
- Est. fire insurance / yr
- $713 – $1,323
Heat risk 3/10 · Minor
- Hot days now (above 97°F)
- 7 days/yr
- Hot days in 30 yrs
- 18 days/yr
Wind risk 1/10 · Minimal
- Chance of severe wind over 30 yrs
- —
Air-quality risk 2/10 · Minimal
- Unhealthy air days now
- 1 days/yr
- Unhealthy air days in 30 yrs
- 2 days/yr
Risk factors via First Street. Map © Google.
Why this score? — see what drove the B- grade
The composite is a weighted blend of 9 inputs, each scored 0–100. Each bar is that input's sub-score; the figure is the points it added to the 100-point composite (weight × sub-score).
- Cash flow +24.0/30.0
- 1% rule +9.5/10.0
- DSCR +7.7/10.0
- ARV discount +7.5/15.0
- Schools +6.8/10.0
- Livability +4.5/5.0
- Condition / age +3.8/5.0
- Rent growth +2.5/5.0
- Appreciation +0.0/10.0
$142,500
🖨 Deal sheet 📄 Offer letter ✓ Due diligence
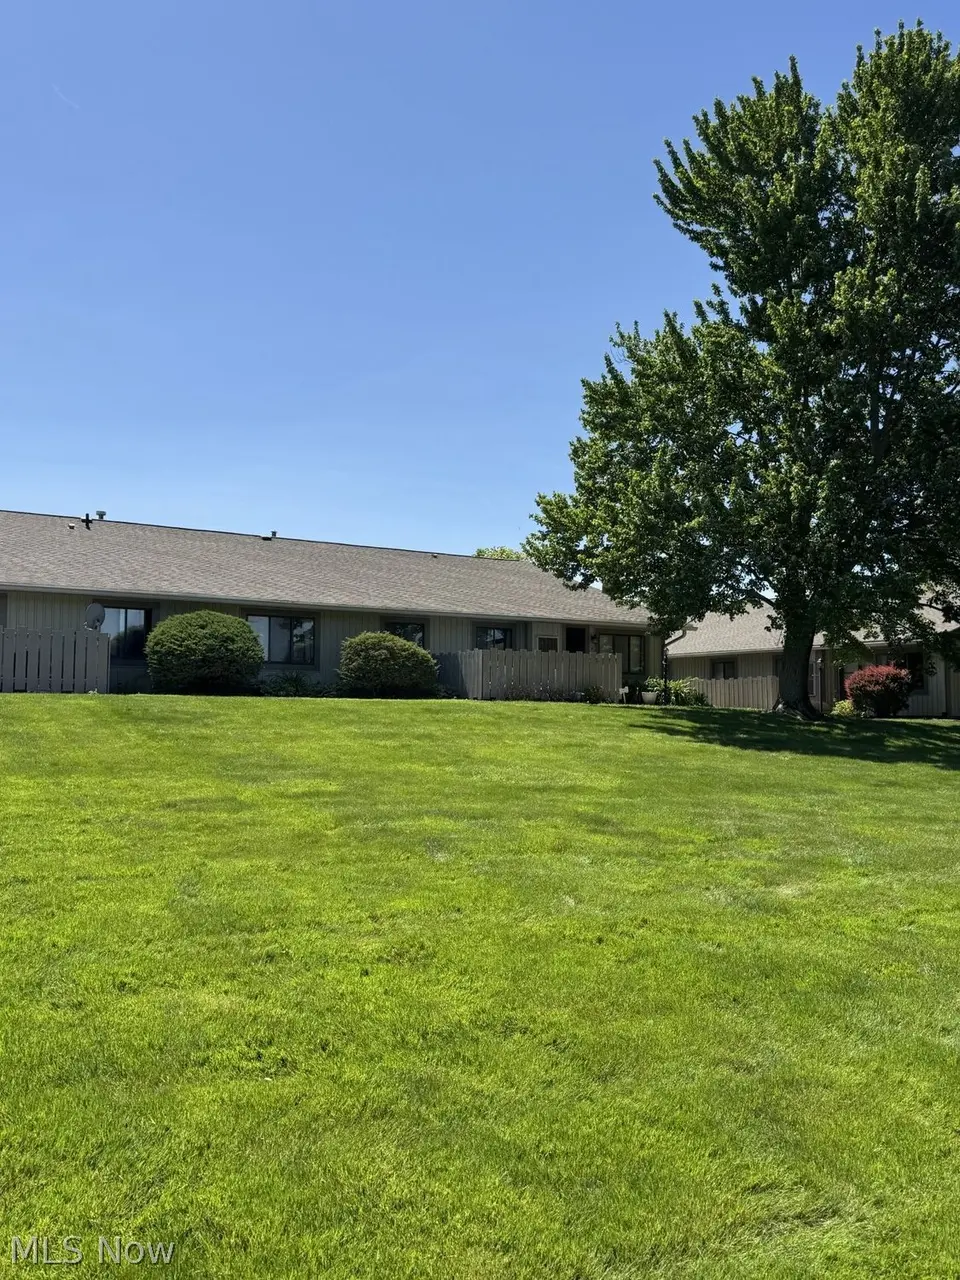
Listing remarks
Welcome Home to this cheery 3 bedroom, 2 bath condo in the highly sought after Copley Fairlawn School District! This end unit offers: vaulted ceilings in the living/dining area; cozy, woodburning fireplace; lovely remodeled kirchen; LVP flooring in the main area and carpeting in bedrooms; step-saving laundry closet conveniently located in unit. There is a concrete patio with a privacy fence just outside the front door, perfect for relaxing! Conveniently located near parks, schools, places of worship, highway access and restaurants and shopping in Montrose. Call your favorite Realtor for a showing today!
Key facts
- Remodeled kitchen
- Laundry closet
- Concrete patio
Tags
Neighborhood map
What this means for you Summary
Snapshot
- This is a 3-bed/2.0-bath condo listed at $142k. Condition is rated good.
Deal economics
- At list price, monthly cash flow is $280 ($3k/yr) — positive.
- The deal already cash-flows at list — no discount required.
- Meets the 1% rule at list price ($2k rent vs $142k).
- Recommended offer: $140k (1.5% below list) — sets the bar for market timing.
- Cap rate 8.7% vs local median 2.8% in Fairlawn — top-decile yield for the area; either an underpriced asset or a hidden risk that comps aren't pricing in. Stress-test before assuming the spread holds.
Location & tenants
- Location reads 89/100 on livability (#11 in OH, #122 nationally) — a professional / high-income tenant draw. Strengths: schools A+, crime A+, amenities A+; Watch: commute F.
- Copley-Fairlawn City (suburban): math 77% / reading 79% proficiency, ranked #58 of 656 in OH (top 9%) — strong family-tenant draw, lease renewals of 3-5y typical; only 15% free/reduced lunch — higher-income household profile.
- Market conditions: 71 active listings in the ZIP; 1 comparable units currently listed for rent nearby; high-income renter base; 1,114 units permitted in Summit County in 2024 (397 in 5+ unit buildings).
Forward outlook
- Local home prices are declining (-3.0%/yr); year-one equity from $985 of loan paydown is wiped out by about $4k of value loss. Plan a longer hold.
- Summit County population projected to shrink 6% by 2050 — rents likely to lag national; underwrite the cash flow, not the appreciation.
Negotiation context
- It's been on market 26 days — a 2% lower offer ($140k) is reasonable based on typical stale-listing flexibility.
Questions for the listing agent
- Built in 1979 — when were the roof, HVAC, electrical panel, plumbing, and water heater last replaced?
- What does the HOA fee cover, when was the last increase, and are there any pending special assessments or reserve-fund shortfalls?
- Any open or pending special assessments — roof, HVAC, plumbing, elevator, façade? What's the per-unit balance and payoff schedule, and is the seller paying it off at close or rolling it to the buyer?
- Is there a deadline driving the sale (1031 exchange, divorce, estate, relocation)? That informs how much negotiation room exists.
- Schools are A-rated — typically a magnet for longer-tenancy family renters. What's the average tenant stay here, and is there a school-zone premium baked into asking?
- What's the average days-on-market for RENTAL listings here right now (not sales)? A rising rental-DOM trend means longer vacancies and softer asking-rent achievability than the comps imply.
- What's the recent tenant-quality profile in this submarket — average credit score on applications, eviction rate, late-payment / NSF rate, and stable-employment percentage? A property-management company in the area should have these aggregated.
- How much new apartment / multifamily construction is in the pipeline within 1–3 miles? Heavy new supply (>2% of stock underway) typically softens rents 12–24 months out; light construction supports rent growth.
Investment metrics
- 1% rule
- 1.45% ✓
- Cap rate
- 8.65%
- Cash-on-cash
- 8.43%
- DSCR
- 1.37
- GRM
- 5.8
CMA / ARV
No comps found within radius.
Projected returns pro-forma
-3.0% appreciation · 3.0% rent growth · sell at horizon
- IRR
- -3.3%
- Equity multiple
- 0.87×
- Total profit
- $-4,988
- Equity at exit
- $21,247
- IRR
- 6.5%
- Equity multiple
- 1.49×
- Total profit
- $19,677
- Equity at exit
- $12,321
Cash invested: $39,900 (down + closing). Projections, not guarantees.
Landlord ↔ Tenant lean methodology
- Overall (STATE)
- 73 Landlord-Friendly
- State Ohio
- 73 Landlord-Friendly · R+6
- County
- — inherits STATE
- City
- — inherits STATE
ZIP-level market 44321
- Active inventory
- 71
- Price-to-rent
- 5.8×
Monthly cashflow live
- Estimated rent
- $2,063 medium interval (Pro) →
- Mortgage (P&I)
- −$747
- Tax est. 1.5%
- −$178 /mo · $2,138/yr
- Insurance
- −$59
- HOA
- −$365
- Vacancy / Maint / Mgmt
- −$433
- Net cashflow
- $280
Break-even live
UW: 25.0% down · 7.5% · 30yr · 1.5% tax · 5.0% vac · 8.0% maint · 8.0% mgmt
Financing live
Cash to close
- Down payment
- $35,625
- Closing costs
- $4,275
- Reserves months
- —
- Total cash needed
- —
Loan-product check · same deal, 3 products live
Conventional
25% down · 7.5% · 30yr
- Down + closing
- —
- Monthly P&I
- —
- Monthly cashflow
- —
- DSCR
- —
- Eligible?
- —
Personal DTI + credit; lowest rate.
DSCR
20% down · 8.5% · 30yr
- Down + closing
- —
- Monthly P&I
- —
- Monthly cashflow
- —
- DSCR
- —
- Eligible?
- —
No personal income docs; deal must DSCR.
Hard money
10% down · 12.0% · 12mo
- Down + closing
- —
- Monthly P&I
- —
- Monthly cashflow
- —
- DSCR
- —
- Eligible?
- —
Short-term bridge; refi at stabilization.
Rent comps 1 comps
| Address | Beds | Baths | Sqft | Rent | $/sqft | DOM | Units | Dist |
|---|---|---|---|---|---|---|---|---|
| 1335 Vale Dr Akron, OH | 2.0–3.0 | 1.5–2.0 | 1100 | $1,600 | $1.45 | 43d | 1 | 0.31mi |
HOA detail condo
- Monthly dues
- $365 · $4,380/yr
- Assessments
- None detected in remarks — confirm with the listing agent.
Listing history 15 events
-
2026-06-18days on market $142,500 Active 26 DOM
-
2026-06-17days on market $142,500 Active 25 DOM
-
2026-06-16days on market $142,500 Active 24 DOM
-
2026-06-15pricedays on market $142,500 Active 23 DOM
-
2026-06-14days on market $145,000 Active 21 DOM
-
2026-06-10days on market $145,000 Active 18 DOM
-
2026-06-09days on market $145,000 Active 17 DOM
-
2026-06-08days on market $145,000 Active 16 DOM
-
2026-06-07days on market $145,000 Active 15 DOM
-
2026-06-03days on market $145,000 Active 11 DOM
-
2026-06-02days on market $145,000 Active 10 DOM
-
2026-06-01pricedays on market $145,000 Active 9 DOM
-
2026-05-31days on market $150,000 Active 8 DOM
-
2026-05-31days on market $150,000 Active 7 DOM
-
2026-05-22$150,000 Active
ⓘ Source: listings_history table (triggers on properties + properties_extension) + one-shot
backfill from property_details.listing_events for pre-trigger history.
Climate risk First Street
- Flood 1/10 Low FEMA zone X (unshaded) · 0% chance over 30 yrs
- Wildfire 1/10 Low
- Heat 3/10 Moderate 7 d/yr ≥97°F today · 18 d/yr by 30 yrs out
- Wind 1/10 Low
- Air quality 2/10 Low 1 unhealthy d/yr today · 2 by 30 yrs out
Nearby sold comps map
Loading sold comps map…
Walkable amenities ~0.75 mi
Loading nearby amenities…
Taxation est. · year 1
- Rental income
- $24,760
- − Mortgage interest
- −$7,982
- − Property taxes
- −$2,138
- − Insurance
- −$712
- − Repairs & maintenance
- −$1,981
- − Management
- −$1,981
- − HOA
- −$4,380
- − Depreciation
- −$4,145
- Taxable income
- $1,440
- Est. tax owed @ 24.0%
- −$346
- After-tax cash flow
- $3,017/yr
For passive investors: Depreciation is non-cash, so a rental often shows a tax loss while cash-flowing — sheltering income. Rental losses are passive: they offset passive income freely, and up to $25,000/yr can offset ordinary (W-2) income if you actively participate and your MAGI is under $100k (phasing out to $0 by $150k); unused losses carry forward. On sale, claimed depreciation is recaptured at up to 25%, and gains may owe capital-gains tax (a 1031 exchange can defer both). Figures are a year-1 estimate at your 24.0% rate — not tax advice; consult a CPA.
Condition & rehab AI · 1 photo
This well-maintained townhouse in the Copley Fairlawn School District offers updated kitchens and bathrooms, a good roof and exterior, and a well-maintained yard. Minor updates to the exterior and landscaping can further enhance its value.
Value-add opportunities
- Both Painting the exterior and interior — Fresh paint can enhance the curb appeal and interior aesthetics.
- Both Landscaping improvements — A well-maintained yard can increase both resale and rental value.
- Rental HVAC maintenance — A functioning HVAC system is crucial for rental properties and can attract tenants.
- Resale Kitchen and bathroom minor updates — Modernizing the kitchen and bathrooms can appeal to potential buyers looking for updated spaces.
Renovation cost estimate screening
Value-add ROI direction
- Both Painting the exterior and interior — Fresh paint can enhance the curb appeal and interior aesthetics. ↑
- Both Landscaping improvements — A well-maintained yard can increase both resale and rental value. ↑
- Rental HVAC maintenance — A functioning HVAC system is crucial for rental properties and can attract tenants. ↑
- Resale Kitchen and bathroom minor updates — Modernizing the kitchen and bathrooms can appeal to potential buyers looking for updated spaces. ↑
ⓘ Cost ranges are severity-bucket heuristics (US national rule-of-thumb). Get contractor quotes + a written scope before underwriting a rehab budget.
Schools (NCES district)
- District
- Copley-Fairlawn City
- NCES district ID
- 3904998
- Math proficiency
- 77% ▼ -6.00%
- Reading proficiency
- 79% ▼ -5.00%
- Median HH income
- $66,228
- Composite
- 67.55/100
- National rank
- #370
- State rank
- #58 of 656 in OH
Livability — Fairlawn
- Score
- 89/100
- State rank
- #11
- US rank
- #122
Category grades
Schools grade is shown separately in the Schools card above.
Census & demographics
- County
- Summit County · 440,783 people
- Metro
- Akron, OH
- Population (ZIP)
- 15,878
- Household income
- $119,178
- Rent vs Own
- Severe rent burden
- 156.0
Population outlook (Summit County) Hauer SSP2
- Today (2025)
- 546,583 people
- By 2030
- 544,028 · -0.5%
- By 2040
- 531,363 · -2.8%
- By 2050
- 514,923 · -5.8%
- By 2075
- 481,765 · -11.9%
- By 2100
- 432,265 · -20.9%
Race, ethnicity, and origin ACS 2023
- Neighborhood character
- Predominantly White (73%)
- Race & ethnicity
- White 73% Two or more races 9% Black 9% Asian 7% Hispanic / Latino 2%
- Common ancestry
- Romanian 6% Slovak 3% Serbian 1%
- Foreign-born
- 11% · China, Canada
- Languages at home
- 89% English-only · Other Indo-European 3% Chinese 2% Other Asian/Pacific 2%
Political lean MEDSL · Summit
- 2024 margin
- Lean D (+7.0) · D 53.0% · R 46.0%
- 2008→2024 swing
- -9.6pp toward R · 2008: 16.6pp · 2024: 7.0pp
- All cycles
- 2024: D+7.0 2020: D+9.6 2016: D+8.2 2012: D+14.8 2008: D+16.6
Not yet ingested
- Civics
- —
Market trends
- HPI YoY
- ▼ -127.90%
- Current HPI
- 195.821
- Rent YoY
- —
- Metro
- Akron, OH
- State GDP YoY
- ▲ 1.98%
- F500 in state
- 48
Industry mix (Fortune 500 HQ in OH)
| Industry | F500 HQs | Revenue |
|---|---|---|
| Insurance | 3 | $145B |
|
||
| Industrial Machinery | 3 | $49B |
|
||
| Financial Services | 3 | $24B |
|
||
| Consumer Goods | 2 | $93B |
|
||
| Aerospace / Defense | 2 | $47B |
|
||
| Utilities | 2 | $33B |
|
||
Price history
1 event — show timeline
- 2026-05-22 Listed $150,000 MLSNOW
Cash-flow waterfall
monthlySold comps — $/sqft
last 12 mo · ≤1 miLoading sold comps…