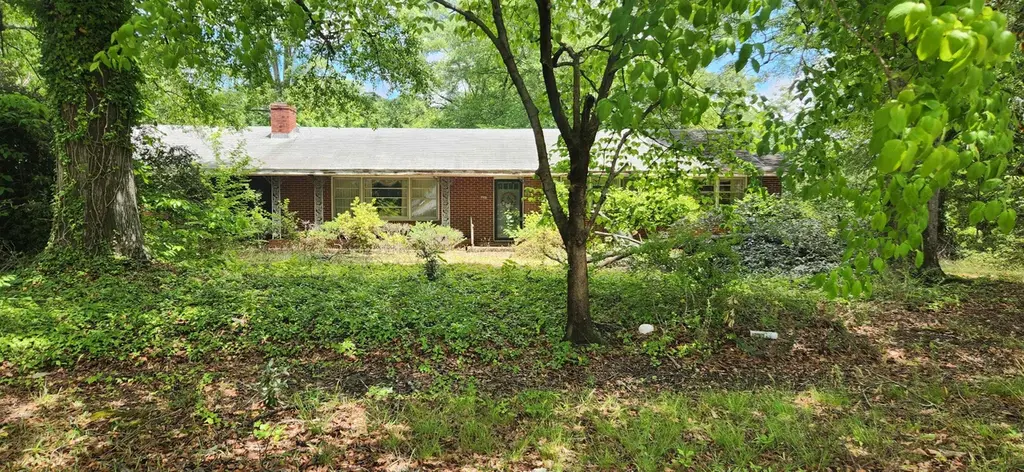
139 Whittier Pl · Hilltop, SC
Flood risk 1/10 · Minimal
- FEMA flood zone
- X (unshaded)
- Chance of flooding over 30 yrs
- 0.0%
- Est. flood insurance / yr
- $507 – $1,088
Fire risk 1/10 · Minimal
- Est. fire insurance / yr
- $783 – $1,453
Heat risk 6/10 · Moderate
- Hot days now (above 105°F)
- 7 days/yr
- Hot days in 30 yrs
- 16 days/yr
Wind risk 2/10 · Minimal
- Chance of severe wind over 30 yrs
- 2.0%
Air-quality risk 4/10 · Minor
- Unhealthy air days now
- 4 days/yr
- Unhealthy air days in 30 yrs
- 4 days/yr
Risk factors via First Street. Map © Google.
Why this score? — see what drove the B grade
The composite is a weighted blend of 9 inputs, each scored 0–100. Each bar is that input's sub-score; the figure is the points it added to the 100-point composite (weight × sub-score).
- Cash flow +26.7/30.0
- ARV discount +15.0/15.0
- DSCR +9.2/10.0
- 1% rule +7.8/10.0
- Rent growth +3.4/5.0
- Schools +3.1/10.0
- Livability +2.5/5.0
- Condition / age +2.5/5.0
- Appreciation +0.0/10.0
$145,000
🖨 Deal sheet 📄 Offer letter ✓ Due diligence
Listing remarks MLS
Great investment opportunity. 3 bedroom 2 bath home just 5 minutes from down town Spartanburg. Close to shopping, hospitals , schools, restaurants, and interstate 85 and Interstate 26. Schedule your showing today.
Key facts
- 0.4 acre lot
- 2 garage spots
- Built 1963
Property features AI
Exterior
- Parking: 2-car garage; Driveway
- Utilities: Public water; Public sewer
- Home design: Single-family residence; One story
- Construction: Vinyl siding
- Exterior features: Front porch
Interior
- Kitchen: Electric water heater
- Flooring: Parquet flooring
- Bathrooms: 2 full bathrooms
- Heating & cooling: Central air (electric); Electric forced-air heating
- Interior features: Walk-in closet(s); Open floor plan
- Laundry & utility: Laundry on main level
Neighborhood map
What this means for you Summary
Snapshot
- This is a 4-bed/2.0-bath single-family listed at $145k.
Deal economics
- At list price, monthly cash flow is $393 ($5k/yr) — positive.
- The deal already cash-flows at list — no discount required.
- Meets the 1% rule at list price ($2k rent vs $145k).
Location & tenants
- Location reads: area grade B — affects rentability + tenant quality, not the cash-flow math above.
- Spartanburg 07 (urban): math 34% / reading 41% proficiency, ranked #39 of 80 in SC (top 49%) — families likely to look elsewhere, expect single-tenant / working-renter base with shorter leases; 62% free/reduced lunch — lower-income household profile, screen leases tightly.
- Zoned schools: Spartanburg High (math 67% / reading 79%, grade B+, #44 of 196 statewide, top 23%, 2,056 students, 85% FRL) — zoned schools average 85% FRL vs 62% district-wide (24 pts higher); higher-poverty schools than district average — tighter screening recommended.
- Zoned-school proficiency averages 73% at this address vs 38% district-wide (+36 pts) — the actual schools serving this property are materially stronger than the Spartanburg 07 average implies; a family-tenant draw the district grade alone would hide.
- Market conditions: Rents rising (+3.7%/yr); 378 active listings in the ZIP; 6 comparable units currently listed for rent nearby; rentals leasing fast (median 14d on market — plan ~1-2 weeks tenant-placement turnaround); 3,129 units permitted in Spartanburg County in 2024 (40 in 5+ unit buildings).
- At $1,861/mo this rent would consume 46% of the median local household income ($48k/yr) (locally 1218% of renters already pay >50% of income on rent) — very limited rent-growth headroom before tenants either downsize or default.
Forward outlook
- Local home prices are declining (-3.0%/yr); year-one equity from $1k of loan paydown is wiped out by about $4k of value loss. Plan a longer hold.
- Spartanburg County population projected at +18% by 2050 — long-run rental-demand tailwind backs the buy-and-hold thesis.
- At projected returns (-3.0% appreciation + 3.7% rent growth), your $41k cash investment doubles in ~9 years — after that, you're playing with house money.
Negotiation context
- Only 1 days on market — expect competitive offers; lowballing is unlikely to land.
- 3 sale attempts with the ask held roughly flat each time — persistent listings suggest the price (not the market) is what's stuck; bring a comps-based counter.
Risks & watch-outs
- Climate carrying-cost: extreme-heat days projected 7→16/yr by 2055 (HVAC capex compounding) — expect insurance premiums to compound above CPI over the hold.
Questions for the listing agent
- Built in 1963 — when were the roof, HVAC, electrical panel, plumbing, and water heater last replaced?
- Is there a deadline driving the sale (1031 exchange, divorce, estate, relocation)? That informs how much negotiation room exists.
- What's the average days-on-market for RENTAL listings here right now (not sales)? A rising rental-DOM trend means longer vacancies and softer asking-rent achievability than the comps imply.
- What's the recent tenant-quality profile in this submarket — average credit score on applications, eviction rate, late-payment / NSF rate, and stable-employment percentage? A property-management company in the area should have these aggregated.
- How much new for-sale + rental construction is in the pipeline within 1–3 miles? Heavy new supply typically softens prices + rents 12–24 months out; constrained supply supports both.
Investment metrics
- 1% rule
- 1.28% ✓
- Cap rate
- 9.54%
- Cash-on-cash
- 11.61%
- DSCR
- 1.52
- GRM
- 6.5
CMA / ARV
- ARV (on-the-fly)
- $215,501
- Comps found
- 10
Show comp detail 10 sales within ~0.75 mi
| Address | Dist | Beds/Ba | Sqft | Sold | Price | $/sf | Match |
|---|---|---|---|---|---|---|---|
| 139 Whittier Pl | 0.00mi | 3/2.0 (-1) | 1,781 (0%) | 1mo | $145,000 | $81 | 94 |
| 140 Lanier St | 0.05mi | 3/2.0 (-1) | 1,598 (-10%) | 1mo | $239,000 | $150 | 74 |
| 457 Hawthorne Rd | 0.18mi | 3/2.0 (-1) | 1,962 (+10%) | 0mo | $170,000 | $87 | 69 |
| 140 Huxley St | 0.16mi | 3/2.0 (-1) | 2,039 (+14%) | 6mo | $230,000 | $113 | 58 |
| 541 Glenwood Dr | 0.27mi | 3/2.0 (-1) | 1,555 (-13%) | 12mo | $254,000 | $163 | 51 |
| 791 Fulton Ave | 0.57mi | 3/2.0 (-1) | 1,937 (+9%) | 5mo | $216,000 | $112 | 50 |
| 250 Sullivan Ave | 0.18mi | 3/1.5 (-1) | 1,551 (-13%) | 17mo | $150,000 | $97 | 49 |
| 300 W Wood Street St | 0.54mi | 4/2.0 | 1,556 (-13%) | 9mo | $189,000 | $121 | 46 |
| 270 Pierpont Ave | 0.58mi | 3/2.0 (-1) | 1,600 (-10%) | 15mo | $210,000 | $131 | 39 |
| 210 Pierpont Ave | 0.68mi | 4/2.5 | 2,048 (+15%) | 17mo | $255,000 | $125 | 27 |
Match score weights: distance 35% · size 25% · config 20% · recency 20%. Top-matched comps best support the ARV.
Projected returns pro-forma
-3.0% appreciation · 3.69% rent growth · sell at horizon
- IRR
- 1.8%
- Equity multiple
- 1.07×
- Total profit
- $2,889
- Equity at exit
- $21,620
- IRR
- 12.2%
- Equity multiple
- 2.00×
- Total profit
- $40,438
- Equity at exit
- $12,537
Cash invested: $40,600 (down + closing). Projections, not guarantees.
Landlord ↔ Tenant lean methodology
- Overall (STATE)
- 90 Strongly Landlord-Friendly
- State South Carolina
- 90 Strongly Landlord-Friendly · R+6
- County
- — inherits STATE
- City
- — inherits STATE
ZIP-level market 29303
- Home prices YoY
- -14.1%
- Rents YoY
- 3.7%
- Active inventory
- 378
- Price-to-rent
- 6.5×
Monthly cashflow live
- Estimated rent
- $1,861 high interval (Pro) →
- Mortgage (P&I)
- −$760
- Tax from tax record
- −$257 /mo · $3,084/yr
- Insurance
- −$60
- HOA
- −$0
- Vacancy / Maint / Mgmt
- −$391
- Net cashflow
- $393
Break-even live
UW: 25.0% down · 7.5% · 30yr · 1.5% tax · 5.0% vac · 8.0% maint · 8.0% mgmt
Financing live
Cash to close
- Down payment
- $36,250
- Closing costs
- $4,350
- Reserves months
- —
- Total cash needed
- —
Loan-product check · same deal, 3 products live
Conventional
25% down · 7.5% · 30yr
- Down + closing
- —
- Monthly P&I
- —
- Monthly cashflow
- —
- DSCR
- —
- Eligible?
- —
Personal DTI + credit; lowest rate.
DSCR
20% down · 8.5% · 30yr
- Down + closing
- —
- Monthly P&I
- —
- Monthly cashflow
- —
- DSCR
- —
- Eligible?
- —
No personal income docs; deal must DSCR.
Hard money
10% down · 12.0% · 12mo
- Down + closing
- —
- Monthly P&I
- —
- Monthly cashflow
- —
- DSCR
- —
- Eligible?
- —
Short-term bridge; refi at stabilization.
Rent comps 6 comps
| Address | Beds | Baths | Sqft | Rent | $/sqft | DOM | Units | Dist |
|---|---|---|---|---|---|---|---|---|
| 515 Howard St Spartanburg, SC | 3.0–4.0 | 2.5–3.5 | 1729 | $2,195 | $1.27 | 13d | 70 | 1.15mi |
| 500 Howard St Spartanburg, SC | 1.0–3.0 | 1.0–2.0 | 999 | $1,650 | $1.65 | 13d | 1 | 1.17mi |
| 458 Arch St Spartanburg, SC | 4.0 | 1.5 | 1380 | $1,325 | $0.96 | 21d | 1 | 1.18mi |
| 650 Polina Ave Spartanburg, SC | 1.0–3.0 | 1.0–2.5 | 1243 | $1,999 | $1.61 | 13d | 9 | 1.40mi |
| 32 Beverly Hills Spartanburg, SC | 3.0 | 2.5 | 1368 | $1,425 | $1.04 | 13d | 1 | 1.46mi |
| 30 Beverly Hills Dr Spartanburg, SC | 3.0 | 2.5 | 1368 | $1,575 | $1.15 | 21d | 1 | 1.47mi |
Listing history 7 events
-
2026-05-08status Pending
-
2026-05-08status Active
-
2026-05-07$145,000
-
2025-07-08soldstatus $130,000
-
2025-07-07soldstatus $130,000 Closed 213-char remark
Show marketing remark (213 chars)
Great investment opportunity. 3 bedroom 2 bath home just 5 minutes from down town Spartanburg. Close to shopping, hospitals , schools, restaurants, and interstate 85 and Interstate 26. Schedule your showing today.
-
2025-05-25status Pending 213-char remark
Show marketing remark (213 chars)
Great investment opportunity. 3 bedroom 2 bath home just 5 minutes from down town Spartanburg. Close to shopping, hospitals , schools, restaurants, and interstate 85 and Interstate 26. Schedule your showing today.
-
2025-05-23$125,000 Active 213-char remark
Show marketing remark (213 chars)
Great investment opportunity. 3 bedroom 2 bath home just 5 minutes from down town Spartanburg. Close to shopping, hospitals , schools, restaurants, and interstate 85 and Interstate 26. Schedule your showing today.
ⓘ Source: listings_history table (triggers on properties + properties_extension) + one-shot
backfill from property_details.listing_events for pre-trigger history.
Tax reassessment forecast SC · Resets to sale price
- Current annual tax
- $3,084 · $257/mo
- Projected year-2 tax
- $3,084 · $257/mo
- Expected delta
- $0/yr ($0/mo · 0.0%)
ⓘ Screening estimate from a state-policy table — verify with the county assessor before closing.
Climate risk First Street
- Flood 1/10 Low FEMA zone X (unshaded) · 0% chance over 30 yrs
- Wildfire 1/10 Low
- Heat 6/10 Major 7 d/yr ≥105°F today · 16 d/yr by 30 yrs out
- Wind 2/10 Low 2% chance of damaging wind over 30 yrs
- Air quality 4/10 Moderate 4 unhealthy d/yr today · 4 by 30 yrs out
Nearby sold comps map
Loading sold comps map…
Walkable amenities ~0.75 mi
Loading nearby amenities…
Taxation est. · year 1
- Rental income
- $22,336
- − Mortgage interest
- −$8,122
- − Property taxes
- −$3,084
- − Insurance
- −$725
- − Repairs & maintenance
- −$1,787
- − Management
- −$1,787
- − Depreciation
- −$4,218
- Taxable income
- $2,613
- Est. tax owed @ 24.0%
- −$627
- After-tax cash flow
- $4,085/yr
For passive investors: Depreciation is non-cash, so a rental often shows a tax loss while cash-flowing — sheltering income. Rental losses are passive: they offset passive income freely, and up to $25,000/yr can offset ordinary (W-2) income if you actively participate and your MAGI is under $100k (phasing out to $0 by $150k); unused losses carry forward. On sale, claimed depreciation is recaptured at up to 25%, and gains may owe capital-gains tax (a 1031 exchange can defer both). Figures are a year-1 estimate at your 24.0% rate — not tax advice; consult a CPA.
Schools (NCES district)
- District
- Spartanburg 07
- NCES district ID
- 4503660
- Math proficiency
- 34% ▼ -1.00%
- Reading proficiency
- 41% ▼ -1.00%
- Median HH income
- $35,825
- Composite
- 31.04/100
- National rank
- #6087
- State rank
- #39 of 80 in SC
Livability — Hilltop
No livability data for this city. (Only ~50 U.S. cities are tracked.)
Census & demographics
- Census place
- Hilltop, SC
- County
- Spartanburg County · 258,607 people
- Metro
- Spartanburg, SC
- Population (ZIP)
- 28,381
- Household income
- $48,295
- Rent vs Own
- Severe rent burden
- 1218.0
Population outlook (Spartanburg County) Hauer SSP2
- Today (2025)
- 325,495 people
- By 2030
- 338,800 · +4.1%
- By 2040
- 363,471 · +11.7%
- By 2050
- 384,156 · +18.0%
- By 2075
- 430,137 · +32.1%
- By 2100
- 442,733 · +36.0%
Race, ethnicity, and origin ACS 2023
- Neighborhood character
- Diverse neighborhood (Simpson 0.67)
- Race & ethnicity
- White 42% Black 36% Hispanic / Latino 16% Two or more races 11% Asian 2%
- Hispanic origin (detail)
- Mexican 10% Puerto Rican 2%
- Common ancestry
- Slovak 2% Italian 1% Subsaharan African 1%
- Foreign-born
- 11% · Canada
- Languages at home
- 81% English-only · Spanish 15% Russian/Polish/Slavic 2% Other Asian/Pacific 1%
Political lean MEDSL · Spartanburg
- 2024 margin
- Solid R (+33.6) · D 32.6% · R 66.2% · Other 1.2%
- 2008→2024 swing
- -12.0pp toward R · 2008: -21.6pp · 2024: -33.6pp
- All cycles
- 2024: R+33.6 2020: R+27.3 2016: R+30.0 2012: R+23.1 2008: R+21.6
Not yet ingested
- Civics
- —
Market trends
- HPI YoY
- ▼ -45.19%
- Current HPI
- 274.443
- Rent YoY
- ▲ 3.69%
- Metro
- Spartanburg, SC
- State GDP YoY
- ▲ 4.51%
- F500 in state
- 2
Industry mix (Fortune 500 HQ in SC)
| Industry | F500 HQs | Revenue |
|---|---|---|
| Packaging | 1 | $7B |
|
||
Price history
+16.0% since first listed7 events — show timeline
- 2026-05-08 Pending — SPMLS
- 2026-05-08 Relisted — SPMLS
- 2026-05-07 Listed $145,000 SPMLS
- 2025-07-08 Sold (Public Records) $130,000 Public Records
- 2025-07-07 Sold (MLS) $130,000 SPMLS
- 2025-05-25 Pending — SPMLS
- 2025-05-23 Listed $125,000 SPMLS
Property tax history
+3.2%/yrLatest (2025): $3,084 · +2.9% YoY. Source: county tax records.
Cash-flow waterfall
monthlySold comps — $/sqft
last 12 mo · ≤1 miLoading sold comps…